Download presentation
Presentation is loading. Please wait.

1
Dust Detection in MODIS Image Spectral Thresholds based on Zhao et al., 2010 Pawan Gupta NASA Goddard Space Flight Center GEST/University of Maryland Baltimore County NASA ARSET Air Quality Training – Salt Lake City, April 22-25, 2013

2
Global Dust Sources

3
Dust Source Strength Global dust emission strength is estimated using data on dust loading in the atmosphere, surface material characteristics, marine sediments, and numerical dust transport models. Recent studies estimate that global dust-emission rates falls within a range from less than 1000 to 3000 Tg yr –1 Estimates show a wide range of values, reflecting differences in modeling procedures, model resolution, the considered time scale, and specification of the source areas. About 80% of the dust is from the Northern Hemisphere. Seven to twenty percent of the dust emissions are less than 1 µm in diameter (Cakmur et al., 2006; Schulz et al., 1998) The world's largest source of dust is the Sahara Desert - 160 to 760 Tg yr –1 Removal of dust from atmosphere is by direct contact with the surface without precipitation (dry deposition), or through scavenging by cloud droplet and precipitation (wet deposition).. Current estimates of the atmospheric dust loading range from less than 10 Tg to 35 Tg, an uncertainty factor of about 3–4.
 The world s largest source of dust is the Sahara Desert to 760 Tg yr –1 Removal of dust from atmosphere is by direct contact with the surface without precipitation (dry deposition), or through scavenging by cloud droplet and precipitation (wet deposition).. Current estimates of the atmospheric dust loading range from less than 10 Tg to 35 Tg, an uncertainty factor of about 3–4..")
4
Available Satellite Aerosol Products for Dust Detection Work well over ocean but not over land Good for qualitative purpose only Only available over dark land targets (not available over desert s) Lack of information on scattering aerosols Sensitive to absorbing aerosols (fine dust) more sensitive to elevated aerosols Large footprint – cloud contamination Sensitive to small mode aerosols Can be used with MODIS data to separate dust from non-dust aerosols Available over both dark and bright targets Narrow swath (almost point measurement) Very limited global coverage, Larger uncertainties in retrieved data sets Very good to estimated vertical distribution of aerosols, Limited swath width (360km) It can separate dust and non-dust aerosols NO daily observations for air quality Sensor Product Comment Available over land – bright targets Angstrom coefficient & Single Scattering Albedo also can be used to detect dust (Ginoux et al., 2010) s)
 Lack of information on scattering aerosols Sensitive to absorbing aerosols (fine dust) more sensitive to elevated aerosols Large footprint – cloud contamination Sensitive to small mode aerosols Can be used with MODIS data to separate dust from non-dust aerosols Available over both dark and bright targets Narrow swath (almost point measurement) Very limited global coverage, Larger uncertainties in retrieved data sets Very good to estimated vertical distribution of aerosols, Limited swath width (360km) It can separate dust and non-dust aerosols NO daily observations for air quality Sensor Product Comment Available over land – bright targets Angstrom coefficient & Single Scattering Albedo also can be used to detect dust (Ginoux et al., 2010) s)")
5
Spectral Signature Qu et al., 2006

6
Spectral Response of Dust and Clouds Xie et al., 2009 BT11-BT12 >0.0 for clouds BT11-BT12 <0.0 for dust

7
Spectral Response of Dust and Clear Surface

8
Dust Detection Dust detection is purely based on simple spectral thresholds Effective under heavy dust loading Works globally both over land and ocean (separate thresholds) Works on 1km pixels Following bands are primarily used – 0.47, 0.64, 0.86, 1.38, 2.26, 3.9, 11.0, 12.0 Can also be applied to future JPSS/VIIRS and GOES- R/ABI)
 Works on 1km pixels Following bands are primarily used – 0.47, 0.64, 0.86, 1.38, 2.26, 3.9, 11.0, 12.0 Can also be applied to future JPSS/VIIRS and GOES- R/ABI)")
9
Dust Detection: Parameters Definition

10
Dust Detection Tests

11
Tests – Theoretical Basis Dust Rat2 MNDVI

12
Theoretical Basis..Cont. Dust clouds clear

13
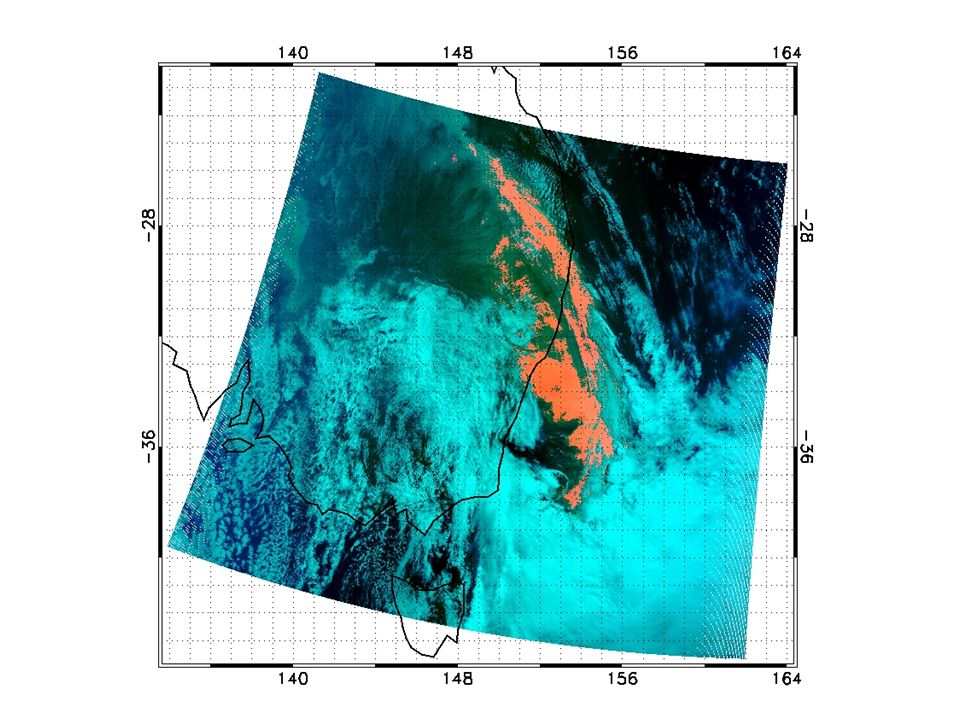
Example Dust out break in Australia DUST Land Water Clouds MODIS-TERRA September 23, 2009 0005 GMT

14
Dust Detection – Test # 1 Pixel should pass these two conditions - – R 0.47μm, R 0.64μm, R 0.86μm, R 1.38μm > 0 – BT 3.9μm, BT 11μm, BT 12μm > 0K – If pixel deos not pass these tests – Flaged as bad data – Pixels in RED Remove bad pixels points from the image

15
Dust Detection – Test # 2 Remove cloudy pixels from the image – BT 11μm − BT 12μm ≤ −0.5K & – BT 3.9μm − BT 11μm ≥ 20K & – R 1.38μm < 0.055 – If pixel failed any of these test..then flag is set as other class – Pixels in BLUE

16
Dust Detection – Test # 3 Dust Detection - – If MNDVI 0.005 – then DUST – If BT 3.9μm - BT 11μm >= 25K - then DUST – DUST PIXELS are in YELLOW

17
Dust Detection – Test # 4 Thick Dust Detection -- – If MNDVI <0.2 then THICK DUST – If BT 11μm - BT 12μm = 25K & if R 1.38μm < 0.035 then THICK DUST

20
RGB TEST # 1 TEST # 2 TEST # 3 TEST # 4 DUST AOD Dust Detection – Data Processing Chain

21
Dust Detection – over Ocean

22
Reference Zhao, T.-P.; Ackerman, S.; Guo, W. Dust and Smoke Detection for Multi-Channel Imagers. Remote Sens. 2010, 2, 2347-2368. – (http://www.mdpi.com/2072-4292/2/10/2347/)http://www.mdpi.com/2072-4292/2/10/2347/ John J. Qu, Xianjun Hao, Menas Kafatos, and Lingli Wang, Asian Dust Storm Monitoring Combining Terra and Aqua MODIS SRB Measurements, IEEE GEOSCIENCE AND REMOTE SENSING LETTERS, VOL. 3, NO. 4, OCTOBER 2006. – (http://estc.gmu.edu/homemain_files/dust.pdf)http://estc.gmu.edu/homemain_files/dust.pdf Ginoux, P., D. Garbuzov, and N. C. Hsu (2010), Identification of anthropogenic and natural dust sources using Moderate Resolution Imaging Spectroradiometer (MODIS) Deep Blue level 2 data, J. Geophys. Res., 115, D05204, doi:10.1029/2009JD012398. – (http://www.gfdl.noaa.gov/bibliography/related_files/png1001.pdf) (http://www.gfdl.noaa.gov/bibliography/related_files/png1001.pdf
, Identification of anthropogenic and natural dust sources using Moderate Resolution Imaging Spectroradiometer (MODIS) Deep Blue level 2 data, J. Geophys. Res., 115, D05204, doi: /2009JD – ( (")
Similar presentations

 Brazil EUMETRAIN.>")


>")


