Download presentation
Presentation is loading. Please wait.

1
Presented by: Steve Burrage State Auditor & Inspector

5
The Washington Times March 11, 2010 “The recession and the ongoing jobless recovery devastated much of the private-sector work force last year, sending unemployment soaring, but government workers emerged essentially unscathed, according to data released by the Labor Department.”

6
U.S. Unemployment Rate 2001-2010 March Source: Bureau of Labor Statistics

7
U.S. Unemployment Rate March 2009 – March 2010 Source: Bureau of Labor Statistics

8
U.S. Unemployment Rate by Industry March 2009 compared to March 2010 Source: Bureau of Labor Statistics

9
Source: U.S. Department of Labor

10
CNN Money.com April 4, 2010 A total of 33 states and the Virgin Islands have depleted their [unemployment compensation] funds and borrowed more than $38.7 billion [from the federal government].
![CNN Money.com April 4, 2010 A total of 33 states and the Virgin Islands have depleted their [unemployment compensation] funds and borrowed more than $38.7 billion [from the federal government].](http://images.slideplayer.com/18/6099706/slides/slide_10.jpg "CNN Money.com April 4, 2010 A total of 33 states and the Virgin Islands have depleted their [unemployment compensation] funds and borrowed more than $38.7 billion [from the federal government].")
11
Unemployment Compensation Trust Funds Top 10 Insolvent States (in millions) 1. California -$8,409 2. Michigan -$3,783 3. New York -$3,001 4. Pennsylvania -$2,814 5. Ohio -$2,229 6. N. Carolina -$2,136 7. Illinois -$2,057 8. Texas -$2,026 9. Indiana -$1,807 10. New Jersey -$1,551 Source: National Employment Law Project

12
Unemployment Compensation Trust Funds Top 10 Likely Solvent States (Months of Benefits Saved) 1. Louisiana 21 2. D.C. 17 Maine 17 Mississippi 17 5. Alaska 16 6. Puerto Rico 14 7. N. Dakota 13 8. Utah 11 9. Washington 10 10. Oklahoma 9 Source: National Employment Law Project

13
News from Around the Country The Oklahoman The Star-Ledger Stateline.org

14
The Christian Science Monitor Chicago Sun-Times Columbia Tribune Des Moines Register News from Around the Country Las Vegas Sun

15
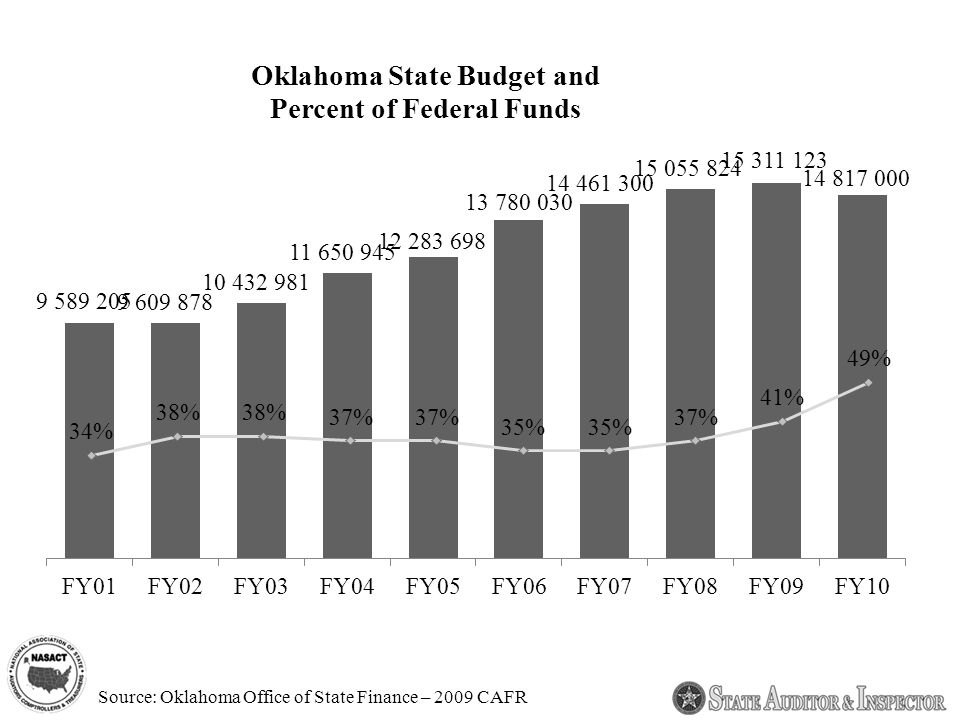
Source: Oklahoma Office of State Finance – 2009 CAFR

18
Variance from prior year: July – February $981.9 million -25.8% * in millions General Revenue Fund Collections FY09-FY10 YTD† Comparison †July-February Source: Oklahoma Office of State Finance

19
General Revenue Fund Collections FY09-FY10 YTD† Comparison – Top 5 Revenue Sources -19.3% -48.7% -65.3% -59.0% -12.6% -25.8% -$258,400,000 -$ 75,200,000 -$335,100,000 -$ 50,500,000 -$144,500,000 Variance †July-February Source: Oklahoma Office of State Finance

20
“A state budget is not balanced if the pension funds are not adequately funded.” Sheila Weinberg Institute for Truth in Accounting Oklahoma Financial State of the State

21
Oklahoma Financial State of the State

22
“Debt has become our country’s drug of choice, personally, in the states and nationally, and until we are honest with ourselves about how much we really owe, we can’t begin to solve this problem” Sheila Weinberg Oklahoma Financial State of the State

23
“State revenue collections in February exceeded the estimate for the first time since December 2008. What we’re seeing now appears to be signs that we’ve hit the bottom, and now we’re starting to climb back up a little bit.” State Treasurer Scott Meacham The Oklahoman

24
“Agencies are currently facing significant additional cuts if revenue projections prove true.” House Speaker Chris Benge The Oklahoman “I would caution against making those kind of statements. We’re looking at 10% in additional cuts to state agencies and I don’t see any way for education to be spared.” Senate President Pro-Tem Glenn Coffee Speaking to a Leadership Oklahoma Class The Oklahoman

25
“If we don’t do some things, and we rely totally on cuts to agencies, we will devastate state government... these agencies and the programs that are vitally important to Oklahomans are not going to be able to recover.” Governor Brad Henry The Oklahoman March 31, 2010

26
Employment: 12 Month Percent of Change Oklahoma – February 2010 Source: Bureau of Labor Statistics

27
Percent of Employment by Industry Sector Oklahoma - February 2010 Source: OESC Economic Research & Analysis Construction Mining/Logging Percentages may not equal 100% due to rounding.

28
State Government Employees Source: Office of State Finance

29
State & Local Government Employment January 2005-2010 2005 2006 2007 2008 2009 2010 Previous Budget Crisis Source: OESC Economic Research & Analysis 28.6% since 2006

30
a. A smaller government with fewer services... b. A larger government with many services... c. Don’t Know/No Response... a. A smaller government with fewer services... 61% b. A larger government with many services... 28% c. Don’t Know/No Response... 12% Source: Oklahoma Council of Public Affairs “Which would you rather see in Oklahoma?”

31
“If Oklahoma’s state government is faced with a budget shortfall, which of the following actions do you think the state should do?” a. Raise taxes and/or fees... b. Cut spending... c. Neither... d. Both... e. Don’t Know/No Response... a. Raise taxes and/or fees... 10% b. Cut spending... 77% c. Neither... 3% d. Both... 8% e. Don’t Know/No Response... 2% Source: Oklahoma Council of Public Affairs

32
“Would you support or oppose a proposal to reduce the number of state government employees by 10 percent?” a. Support... b. Oppose... c. Don’t Know/No Response... a. Support... 67% b. Oppose... 26% c. Don’t Know/No Response... 8% Source: Oklahoma Council of Public Affairs

33
State Budgets at FY05/06 Funding Levels State Workers at FY05/06 Staffing Levels Smaller state/local government(s) Increasing share of Federal dollars to fund state government(s) Astronomical federal deficit – Larger federal government
 Increasing share of Federal dollars to fund state government(s) Astronomical federal deficit – Larger federal government")
34
Questions?

35
Presented by: Steve Burrage State Auditor & Inspector

Similar presentations