Download presentation
Presentation is loading. Please wait.

1
Measuring zSeries System Performance Dr. Chu J. Jong School of Information Technology Illinois State University 06/11/2012 Sponsored in part by Deer & Company

2
Outline Computer System Performance Performance Factors and Measurements zSeries Performance – Measuring Application Performance – Measuring System Performance Additional Tools used Discussion

3
Computer System Performance Amount of time used to complete a task Amount of work completed in unit of time Resource required and resource usage Others – Storage – Channel – Scalability – Availability (MTBF and MTTF) – Power – Etc.
 – Power – Etc.")
4
Factors of System Performance Hardware Processor Bus Clock Memory Secondary Storage I/O Devices Network Cooling Power Software Resource Allocation Resource Sharing Process Distribution Operating Systems Algorithms Context Switches Compilation Optimization Others … and more

5
Performance Measurement Metrics include: availability, response time, channel capacity, latency, completion time, service time, bandwidth, throughput, scalability, performance per watt, compression ratio, speed up, …, and more. Two are used: – Response Time – Throughput

6
Measuring zSystem Performance Application – DB2 Compare the performance of accessing data stored in DB2 table against reading the same data accessed directly in VSAM running on z/OS hosted by IBM zSystem. System – CP, the Hypervisor Compare and analysis the performance of resource management by Hypervisor against the performance of resource management by z/VM and Linux (guest) of z/VM hosted by IBM zSystem
 of z/VM hosted by IBM zSystem.")
7
Application – DB2 A Normalized Comparison of DB2 and Direct Access Performance under z/OS Environment (By Christopher Corso) Compares the performance of accessing data stored in DB2 tables against reading the same data values accessed directly in VSAM files. Validation testing is performed on MVS mainframes running DB2 version 9 under zOS. The comparison of the performance will be of a DB2 FETCH with a read until end of file on a direct access VSAM file. The resulting CPU processing times of the different methods are discussed and conclusions are offered

8
Testing and System Configuration Time differentials of: Task Control Blocks (TCB) Service Request Blocks (SRB) Computer clock speeds (CPU) Systems Used ISU Mainframe (z890) – zOS, DB2 version 9 IIC Mainframe (IBM Innovation Center-Dallas) VM – zOS, DB2 version 9
 Service Request Blocks (SRB) Computer clock speeds (CPU) Systems Used ISU Mainframe (z890) – zOS, DB2 version 9 IIC Mainframe (IBM Innovation Center-Dallas) VM – zOS, DB2 version 9")
9
Table Relationships

10
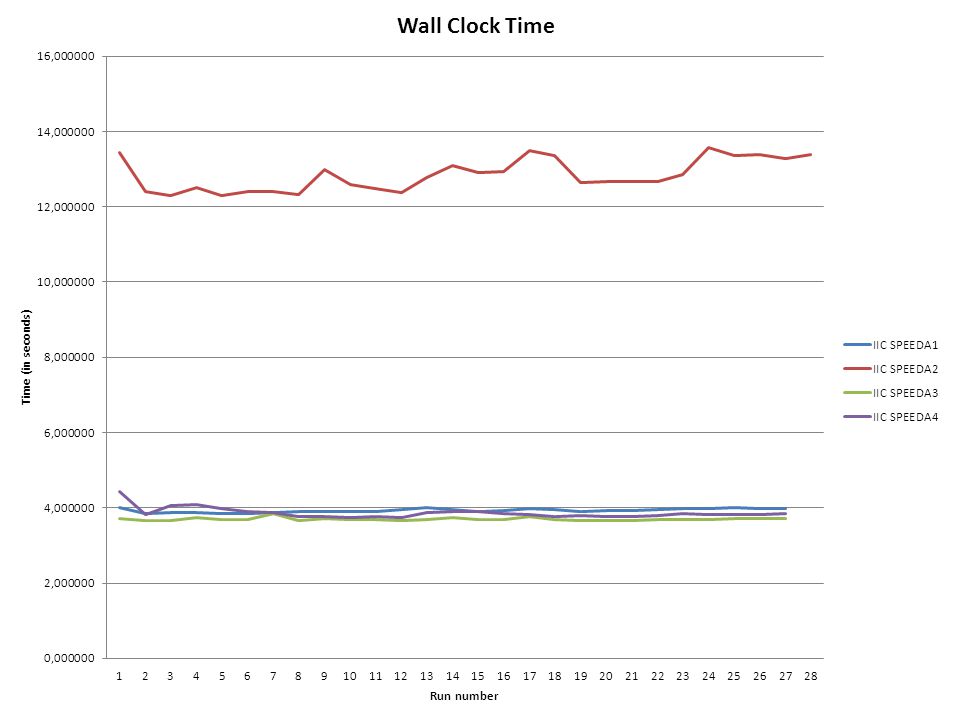
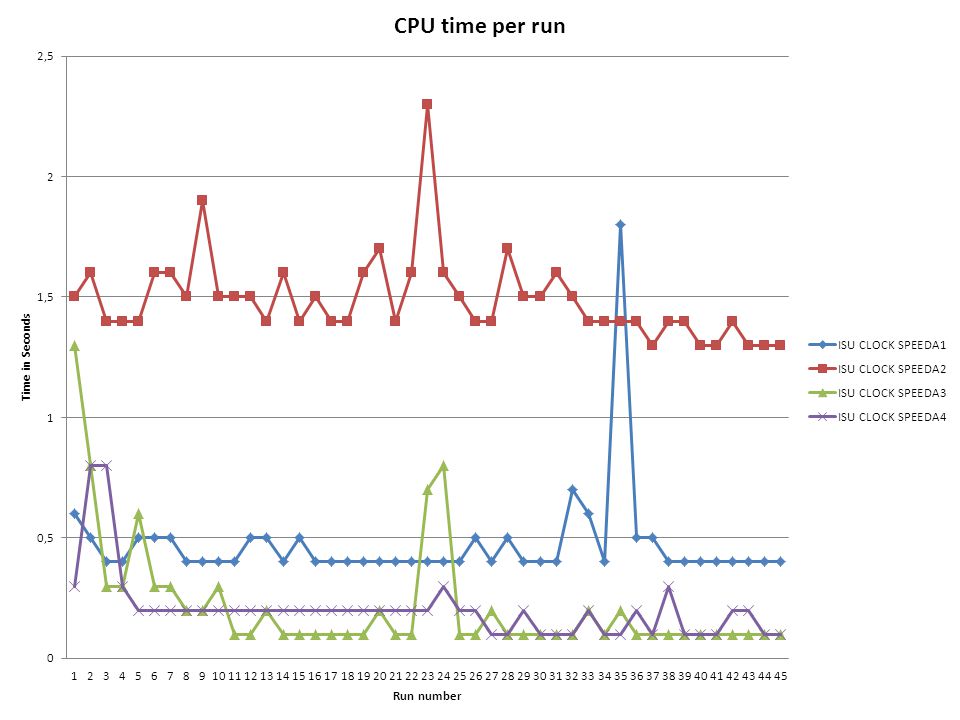
Testing Programs and Names DB2 only VSAM only DB2 with internal files VSAM with internal files SPEED1 – DB2 processing only SPEED2 - direct access VSAM processing only SPEED3 - direct access VSAM with internal files SPEED4 - DB2 with internal files.

11
Testing Results Wall Clock Time Task Control Block (TCB) Time Service Request Block (SRB) Time CPU Time
 Time Service Request Block (SRB) Time CPU Time")
17
Observation DB2 proved faster than direct VSAM access One method is not significantly faster to process than the other The least practical method of storing the data is to put it in variables within the source code itself Converting direct access VSAM is not always the best option It is much easier for users of the data to access it via DB2 tables

18
System – CP Hypervisor compare and analysis the performance of resource management by Hypervisor against the performance of resource management by z/VM and Linux (guest) of z/VM hosted by IBM zSystem. The purpose is to analyze and correlate the relationship between the resource management of Guest Virtual Machine (Linux on z/VM) and the hypervisor of hosting Virtual Machine (z/VM). We will run benchmark on combinations of different of processes and guest VMs to collect their performance data for a closure statement. Optimizing Guest System’s Addressing Space in a Virtual Environment By Niranjan Sharma
 and the hypervisor of hosting Virtual Machine (z/VM). We will run benchmark on combinations of different of processes and guest VMs to collect their performance data for a closure statement. Optimizing Guest System’s Addressing Space in a Virtual Environment By Niranjan Sharma.")
19
Performance of CP and z/VM Resource Allocation – By CP, By z/VM, By guest O/S – Linux Memory Management – By CP, By z/VM, By guest O/S – Linux CPU Cycle Distribution – By CP, By z/VM, by guest O/S – Linux Mainframe Resource Utilization and Scalability – Do they fit in the distributed system? – How about Cloud Computing and Parallel Computing

20
Performance Concerns LPAR Optimization – How many LPARs becomes too many – What are the overheads of managing LPARs Guest Optimization – How many guest O/S’s becomes too many – What are the overheads of managing guest O/S’s Process Optimization – How many processes a guest O/S may handle to maintain scalability – What are the cost of context switches Resource Sharing – Processor assignment – Memory allocation – Buffer space and channel distribution

21
Benchmark Testing CPU Intensive Application Response Time and Throughput – Scaling from 1 to 2 n processes per guest O/S – Scaling from 1 to 2 m guests per LPAR – Scaling from 1 to 2 k LPAR per system Memory Intensive Application Response Time and Throughput – Scaling from 1 to 2 n processes per guest O/S – Scaling from 1 to 2 m guests per LPAR – Scaling from 1 to 2 k LPAR per system Resource Utilization and Scalability LINPACK test suite – parallel computing

22
Tivoli Performance Monitoring Tools

23
Discussions Under what circumstance CP allocate its resource adequately Under what circumstance VM manage its resource effectively Scalability of CPU intensive applications Scalability of memory intensive applications Mainframes v.s. Distributed Systems – A Collaboration Approach

24
Question ?

Similar presentations


 Gartner.>")


