Download presentation
Presentation is loading. Please wait.

2
Hudson River Dredging: Overview and Update January, 2010

3
The Hudson: History 1948-1977: PCBs used by GE capacitor manufacturing plants 1973: Removal of Ft Edward Dam - PCBs spread downstream 1976: New York and GE settle enforcement action for PCB discharges 1984: 1st EPA ROD calls for shoreline capping (60 acres), but no dredging 1989-1990: GE implements 1984 Remedy 1990 – EPA reassessment begins 2/1/2002 : new EPA ROD calls for dredging GE Hudson Falls Capacitor Plant 3 Dam Location
, but no dredging : GE implements 1984 Remedy 1990 – EPA reassessment begins 2/1/2002 : new EPA ROD calls for dredging GE Hudson Falls Capacitor Plant 3 Dam Location")
4
Upper Hudson River Hadley Glens Falls Hudson Falls Fort Edward WASHINGTON WARREN Schuylerville SARATOGA Thompson Is. Dam Fort Miller Dam Stillwater Mechanicville Hoosic River Waterford Cohoes Green Island Troy Mohawk R RENSSELAER Federal Dam Section 1 Bakers Falls 0 0 5 mi 10 k Section 2 Section 3 Northumberland Dam

5
Dredging along 40 miles of river Phase 1: –1 st year dredging (May - November) –Test equipment/processing facility –Evaluate performance standards vis-à-vis the design Review of Phase 1: – Independent peer review panel – Receive public comments – EPA decision on modifications to project Phase 2: –Remaining dredging Project Phases
 –Test equipment/processing facility –Evaluate performance standards vis-à-vis the design Review of Phase 1: – Independent peer review panel – Receive public comments – EPA decision on modifications to project Phase 2: –Remaining dredging Project Phases")
6
–2002: ROD selects dredging remedy –2004: EPA completes development of Quality of Life and Engineering Performance Standards, Siting of Processing Facility and Community Relations –2002-2005: Three EPA/GE agreements to perform work —Sediment sampling (complete) — Engineering design of 2-phase project (Phase 1 complete) — Performance of project (Phase 1 complete). Agreement includes Phase 2 “opt-in/opt-out” provision for GE. Decision to be made in second half of 2010. If GE opts out, EPA retains all enforcement authorities to compel performance of Phase 2. –2007-2009: Construction of Sediment Processing Facility –2009: Phase 1 dredging commences May 15, continues to November Project Overview

7
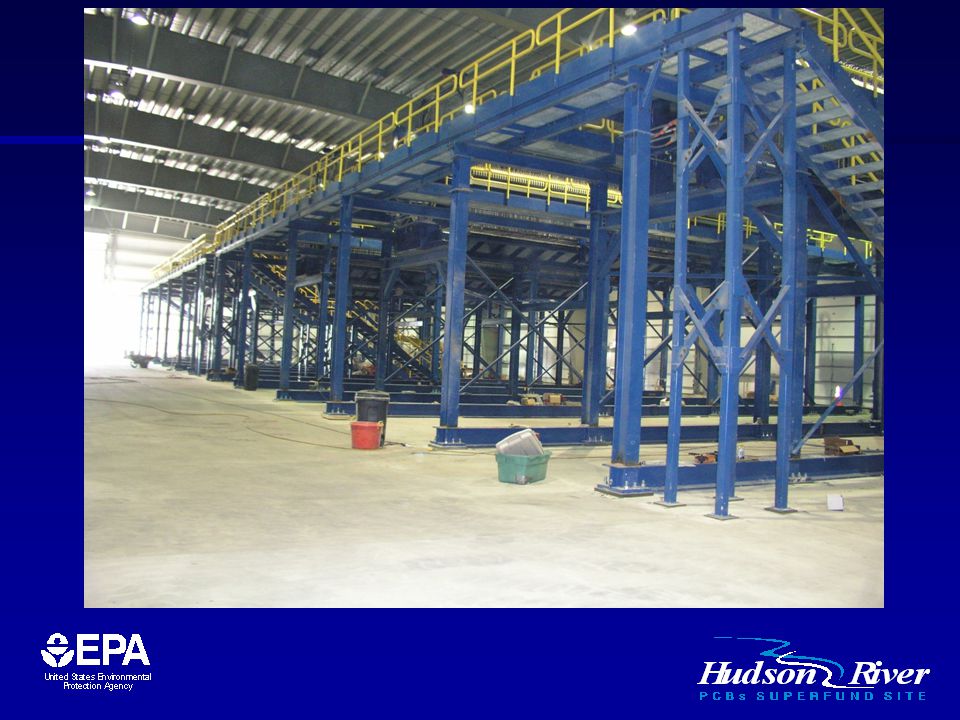
Construction of Processing Facility –2 miles of road; utilities; 90,000+ cy of fill –Rail yard with 7 miles of new track –1,500 foot long wharf to unload barges; widen canal by 65 feet –2 MGD water treatment plant –Screens and a bank of “hydrocyclones” to remove sand –12 filter presses –300,000 sq yds of liners, 55,000 sq yds paved area –7 acres of storm water basins to handle 100-year flood –5 staging areas for dewatered sediment (2 enclosed -- 19,000 cu yds each) 9
 9")
8
November 2008 Sediment Processing Facility April 2007 Champlain Canal

9
Sediment Processing Facility Operations Once at the processing facility, the sediment is off-loaded and debris is removed The sediment is then processed and the water is extracted. The water is treated on-site before being returned to the Champlain Canal The remaining sediment, called “filter cake,” is loaded onto railcars for transport to a secure, PCB-approved landfill in Andrews, Texas –some sediment was directly off loaded, dried and then placed in railcars

15
Phase 1 and 2 Dredge Area Delineation > 50,000 sediment samples taken 2002-2006; sampling data collected to enable EPA and GE to: –determine the distribution of PCBs in the sediment –refine estimates of the amount and location of PCBs in the sediment –establish river sediment characteristics (e.g., silt, sand, gravel) 490 acres planned to be dredged – 90 acres during Phase 1, 400 acres during Phase 2
 490 acres planned to be dredged – 90 acres during Phase 1, 400 acres during Phase 2")
16
–May-November 2009; operating 24/6 –Up to 12 mechanical clamshell dredges working at same time –27 Hopper Barges/13 Tugs –Constant monitoring –Backfill (or cap) after dredging –Habitat replacement (in 2010) Phase 1 Dredging
 after dredging –Habitat replacement (in 2010) Phase 1 Dredging")
17
Dredging Operations Dredging & Debris Removal Resuspension controls –Rock dike –Silt curtain –7,000 yds 2 steel sheeting Backfill, if area meets residual standard –165,000cy –12” of cover over much of area –38,000cy near-shore backfill to match original bathymetry –Add’l. backfill in specified planting areas Capping, if area cannot meet residual standard –Depends on residual concentrations –Consider capping if residuals not removed after 4 passes –Requires EPA approval Dredging and/or backfilling operations continued 24/6 while Champlain Canal was open (May – November, 2009)
.")
18
Engineering Performance Standards Engineering Performance Standards were developed to: - minimize resuspension of PCBs during dredging - set limits on PCBs left in sediment, and - set production rates Resuspension standard designed to: - Protect drinking water intakes downriver of the dredging operations, and - Limit the downriver transport of PCBs Performance standards now being evaluated through peer review process Standards and design likely to be modified for Phase 2

19
Protection of Water Supplies Two communities downstream of dredging area – Waterford & Halfmoon -- utilize Hudson River for drinking water supplies. A third community – Stillwater – uses well field immediately adjacent to Hudson River EPA built new 4.5-mile water line for Waterford and Halfmoon to bring non-Hudson water from Troy during any time when Hudson River water downstream of dredging exceeds 500 ppt (federal drinking water standard) EPA provided GAC treatment for Stillwater Water supplies in Lower Hudson were sampled by DOH (with funding from EPA); 2009 levels were not elevated in comparison to baseline 2008 levels
 EPA provided GAC treatment for Stillwater Water supplies in Lower Hudson were sampled by DOH (with funding from EPA); 2009 levels were not elevated in comparison to baseline 2008 levels.")
20
Quality of Life Standards Air Noise Light Odor Navigation

21
Dredging Began May 15, 2009

22
The First Scoop of Mud

24
Shoreline Preparation Pre-Dredging Tree trimming

25
Removal of Logs, Stumps & Debris from Western Channel of Rogers Island

26
Debris is a Major Problem Debris removal

27
Dredging in Ft. Edward, NY

28
Residents Watch Dredging in the Ft. Edward Yacht Basin

29
Loading a Mini-Scow

30
Large Hopper Scow

31
Noise Monitors Along Shore of Rogers Island, Ft. Edward, NY

32
Locks Open May - November Barge transport through Lock 7

33
100+ Acre Processing Facility Unloading at processing facility

34
Installation of Plastic Liners in Rail Cars for Transport of Contaminated Sediment

35
Workers Load Rail Cars with Dried Sediment

36
Rail Transport to West Texas

38
Assessment & Peer Review Assessment of Phase 1 underway. Purpose is to evaluate engineering & performance standards and make appropriate changes EPA & GE prepared draft reports evaluating Phase 1; reports exchanged and released to public in mid- January; final reports released March 8 –Reports draw some significantly different conclusions from same facts Peer Review started mid-February, continues to June

39
EPA Report Findings: Overview –Phase 1 Plan: Minimum removal was to be 200,000 CY Target was 265,000 CY removed from 90 acres –Phase 1 Achieved: 283,000 CY removed from 48 acres >1.5 times more PCB mass removed than estimated in ROD –About the same mass as estimated in design, but from fewer acres 31 acres backfilled; 17 acres capped –Significantly less capping expected in Phase 2 – East Rogers Island area is atypical of rest of River – about 11.5 acres capped -- About half of the remaining capped areas were buried under several feet of clean backfill thus addressing habitat concerns

40
283,000 Cubic Yards 265,000 Cubic Yards

41
Phase 1 Target = 18 CUs dredged; Achieved = 10 CUs dredged

42
EPA Draft Report Findings Phase 1 indicated much greater mass of PCB in the areas dredged than estimated. In fact, PCB-bearing oils were frequently encountered. The depth of contamination (DOC) was greater than estimated in the design (in one area DOC was 13 feet deeper than designed). On average the depth of cut was 1.5 X deeper than designed. –Inaccurate estimates primarily attributable to woody debris interference with sediment sampling during design phase. If the actual DOC is better defined prior to actual dredging, the contaminated material can be removed with fewer and fuller bucket bites, and fewer passes over a given area. Fewer bucket bites equates to less resuspension and greater productivity.
 was greater than estimated in the design (in one area DOC was 13 feet deeper than designed). On average the depth of cut was 1.5 X deeper than designed. –Inaccurate estimates primarily attributable to woody debris interference with sediment sampling during design phase. If the actual DOC is better defined prior to actual dredging, the contaminated material can be removed with fewer and fuller bucket bites, and fewer passes over a given area. Fewer bucket bites equates to less resuspension and greater productivity..")
43
EPA Draft Report Findings: Resuspension Standards Findings Near-field TSS - 100 m Evaluation Level - 700 mg/L Near-field TSS - 300 m Evaluation Level - 100 mg/L Max. allowable Total PCBs in water column -- 500 ng/L Far-field net suspended solids concentration Evaluation Level -- 12 mg/L Av. TSS well below Evaluation Level Av. TSS well below Evaluation Level; 4 exceedances observed (but not supported by continuous turbidity measurements). 3 exceedances; dredging activities halted less than 4 four days. Not exceeded
. 3 exceedances; dredging activities halted less than 4 four days. Not exceeded.")
44
Monitoring PCBs During Dredging: Schuylerville, NY Data

45
EPA Draft Report Findings: Resuspension Standards Findings Far-field Total and Tri+ PCB load Control levels: 1,080 grams/day and 361 grams/day Exceeded at Thompson Island for majority of the dredging period. At Waterford, loads were significantly lower -- exceeded control level ~ 20% of time. Note: load criteria were not revised during Phase 1 to address the larger- than-planned PCB mass removed. Overall target of no more than 1% export to lower Hudson was achieved.

46
EPA Draft Report Findings: Residuals Standards Findings Affirmation of removal of all PCB-contaminated sediment inventory in target dredging areas (“Certi- fication Units” or CUs) Arithmetic average Tri+ PCBs concentration in the residual sediments ≤ 1 mg/kg Substantial removal of inventory confirmed in all CUs. Where inventory left in place, engineered caps constructed to isolate the remaining inventory. Expect that ≤ 1 mg/kg can be achieved in residual sediments during Phase 2

47
EPA Draft Report Findings: Productivity Standards Findings Target Phase 1 dredging volume = 265,000 CY Targeted Maximum Phase 1 monthly volume = 88,350 CY Shoreline stabilization, backfilling, and processing and shipment of removed sediment accomplished prior to the end of calendar year. Total volume removed = 283,000 cy Max. monthly Phase 1 volume removed = ~77,000 CY. (Very likely that the target of 88,350 CY would have been achieved but for shortages of empty scows.) Due to difficulties at disposal site, not all sediment shipped off-site by end of 2009. Provisions should be made for back-up disposal site for Phase 2.
 Due to difficulties at disposal site, not all sediment shipped off-site by end of Provisions should be made for back-up disposal site for Phase 2..")
48
Met or exceeded sediment volume & PCB mass goals Few shut-downs with limited impact on production ~70% of dredged area closed in compliance with the Residuals Standard No measurable impacts to Lower River We learned enough in Phase 1 to improve the project and do it well in Phase 2 What Went Well

49
Phase 1 Challenges Higher than normal flows Extent of wood debris DoC consistently underestimated NAPL releases Limitations on scow unloading Extent of erosion since 2001 – 35K CY lost in the 18 planned CU’s before start of dredging; system is dynamic, redistribution occurs all the time % of bedrock/clay bottom 48

50
Resuspension Standard: Summary of Observations No significant release of solids during dredging Water column PCB concentrations were significantly above baseline during dredging. PCB-bearing oil sheens were extensive and are likely a significant vector for PCB release. Water column concentrations of PCB decreased substantially downstream of Thompson Island to Waterford. –Tri+ PCB Loads at Lock 5 and Waterford were significantly lower than loads at Thompson Island, yet solids transport increased slightly (though still within the baseline variations) There were no observable impacts of dredging to PCB water column concentrations downstream of Albany.
 There were no observable impacts of dredging to PCB water column concentrations downstream of Albany..")
51
Resuspension Standard Observations (con’t.) Net load at Thompson Island was still small relative to the overall mass removed : 440 kg vs. the 20,000 kg removed (roughly 2 percent). The net load to the Lower Hudson was roughly 150 kg total PCB. The resuspension goal of maintaining the Total PCB export rate to 1 percent or less relative to the mass of PCBs removed was achieved at Waterford and nearly met at Schuylerville. 50
. The net load to the Lower Hudson was roughly 150 kg total PCB. The resuspension goal of maintaining the Total PCB export rate to 1 percent or less relative to the mass of PCBs removed was achieved at Waterford and nearly met at Schuylerville. 50.")
52
Productivity Standard: Major Factors Affecting Productivity During Phase 1 Scow unavailability due to limited scow unloading capacity at Dewatering Facility Presence of wood debris in sediment Limited capacity of mini-scows Underestimated DoC Fine grading to meet cut line tolerances

53
Debris in Sediment

54
Impacts of Underestimated DoC and Fine Grading Underestimated DoC: – Additional dredge passes –Time lost in mapping, sampling, and designing new cut lines –CUs open longer Fine Grading: –Reduced production rate Both factors also increased resuspension losses

55
Phase 2 Productivity Standard Can be Met by: Addressing uncertainty in DoC to minimize passes Improving scow unloading capacity Minimizing fine grading and small cuts Conducting access dredging where needed

56
Residual Standard – Summary of Findings Resuspension, Productivity and Residual standards are related Basic problems arise from the uncertainty in the design DoC –Core samples used for design were often incomplete, yielding inaccurate design Modifications needed in the approaches for dredging and post-dredging sampling EPA is recommending simplifications to the Residuals Standard but not changes to the basic approach

57
Closure Summary

58
Simultaneously Meeting Standards Efficient dredging of inventory with fewer cuts (productivity) leads to fewer bottom disturbances and smaller dredging releases (resuspension) and quicker certification of post-dredging concentrations (residuals) reducing duration of exposed bottom surface (resuspension). Per Residual Standard, appropriate selection of cut lines is important in minimizing re-dredging...and therefore in meeting the standards simultaneously.

59
OVERALL BENEFITS OF PROJECT Far more PCBs in the River than estimated The River is NOT “cleaning itself” at the rate predicted by the model used in the 1990s. –Sediments are not being buried.. –Surface concentrations are 3x higher, and water column concentrations are 2-3 X higher, than 1990s model predicted. Both show little or no decline over a decade. Even with an increase in the resuspension standard, completion of the dredging project will confer significant and lasting benefits.

63
More Information For information on Hudson River Dredging Project: http://www.epa.gov/hudson/ For EPA’s Report on Phase 1: http://www.hudsondredgingdata.com/Report For GE’s Report on Phase 1: http://www.hudsondredging.com/

Similar presentations


, Nova Scotia has long been subject to effluent and atmospheric inputs of metals, polycyclic aromatic hydrocarbons.>")


 Lance Lumbard Water Resources Project Manager.>")


 be located?>")