Download presentation
Presentation is loading. Please wait.

1
Severe Thunderstorm forecasting

2
From www.spc.noaa.gov/faq/#4.2, SPC defines a thunderstorm as severe if it has one of more of the following:www.spc.noaa.gov/faq/#4.2 a. Hail at least 1 inch in diameter (quarter size) b. Wind gusts to 58 mph or greater (50 knots) c. Any tornado The website goes on to say: “… Although lightning can be deadly, the NWS doesn't use it to define a severe thunderstorm. If it did, every thnderstorm would be severe, by definition. Also, excessive rainfall may lead to deadly flash flooding, but heavy rain is not a severe criterion either. The flood threat is handled through a separate set of watches and warnings from your lcoal NWS forecast office.
 b. Wind gusts to 58 mph or greater (50 knots) c. Any tornado The website goes on to say: … Although lightning can be deadly, the NWS doesn t use it to define a severe thunderstorm. If it did, every thnderstorm would be severe, by definition. Also, excessive rainfall may lead to deadly flash flooding, but heavy rain is not a severe criterion either. The flood threat is handled through a separate set of watches and warnings from your lcoal NWS forecast office..")
3
Storm reports from the Storm Prediction Center are color coded: Each dot is a reported location. Red for tornadoes, green for hail, blue for straight-line winds These are preliminary reports. They can and do change as more information comes in (such as the NWS damage surveys). For final reports, consult Storm Data.
. For final reports, consult Storm Data..")
4
The warning system consists of three parts 1. Convective outlook (just for us, not for the general public) The convective outlook is issued early in the day and again in the afternoon. We get convective outlooks for today (day 1), tomorrow (day 2), and the day after tomorrow (day 3).
 The convective outlook is issued early in the day and again in the afternoon. We get convective outlooks for today (day 1), tomorrow (day 2), and the day after tomorrow (day 3)..")
5
There are 6 categories, general (nonsevere) thunderstorms, Marginal risk, Enhanced risk, Slight risk, Moderate risk, and High risk. The High risk category is rarely used but when it is, that’s a seriously bad situation!

6
2. Severe thunderstorm and tornado watches. Watches are announced for the general public. They are meant to put people on guard. Usually, watches are issued before any severe weather is seen, but sometimes they are issued after the first reports are received. A watch covers all or most of a middle-sized state. Watches come in two varieties: a. severe thunderstorm b. tornado

7
3. Warnings. These are issued when severe weather is spotted or indicated by radial velocity on Doppler Radar. Warnings may have significant (10-20 minute) lead time or no lead time, depending on the situation. Warnings trigger TV and radio announcements and NOAA weather radio broadcasts. Warnings come in two varieties, just like watches: a. severe thunderstorm b. tornado This radar signature triggers a tornado warning: Or a storm spotter could see a funnel.
 lead time or no lead time, depending on the situation. Warnings trigger TV and radio announcements and NOAA weather radio broadcasts. Warnings come in two varieties, just like watches: a. severe thunderstorm b. tornado This radar signature triggers a tornado warning: Or a storm spotter could see a funnel..")
8
The Pre-storm Environment What to look for in the morning. Remember, things may change by afternoon! Here’s a powerful case from 2011. It’s the day before the Superoutbreak: The SPC forecasters were impressed with the setup in this case. They predicted severe weather all the way north to Michigan and New York.

9
Ingredients for deep moist convection (Doswell, 1987): 1) Moisture2) Instability 3) Lift We look for the synoptic conditions which increase any or all of those three.
: 1) Moisture2) Instability 3) Lift We look for the synoptic conditions which increase any or all of those three.")
10
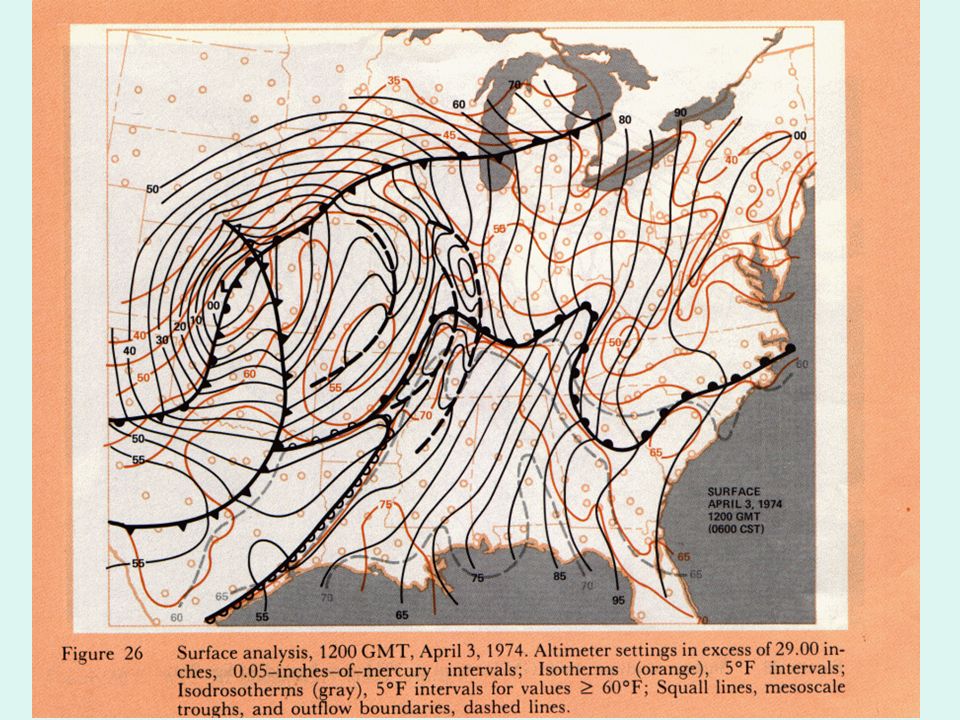
The MSLP or surface chart. Find the conditions that favored severe thunderstorms.

11
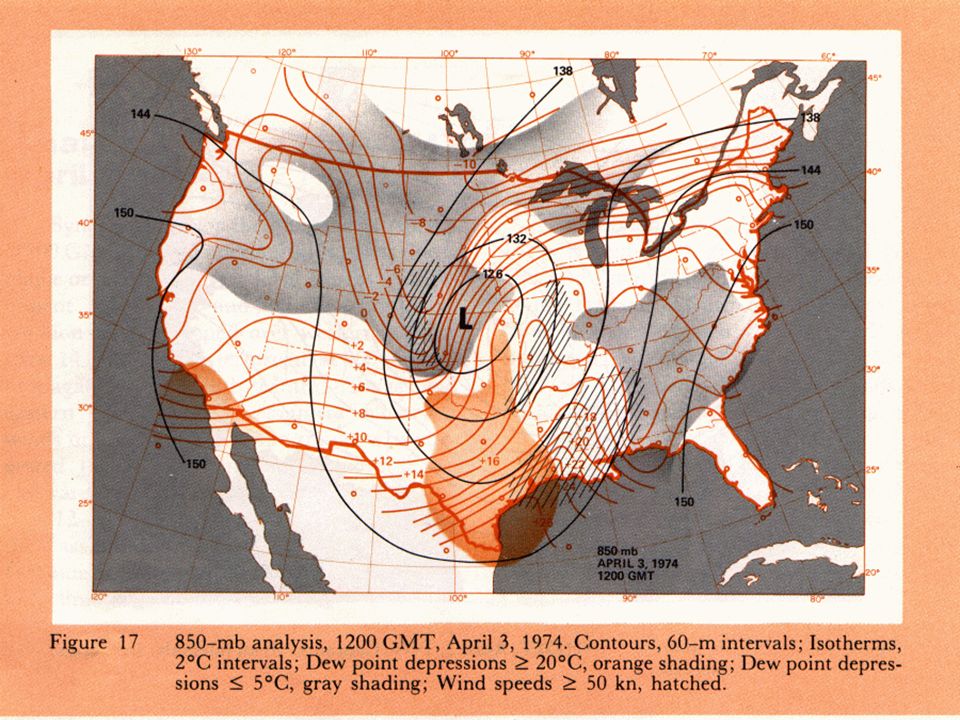
Low-level (850 or 925 hPa) warm air advection is favorable. So is low-level moisture advection or just high absolute humidity. Wind? 850 hPa

12
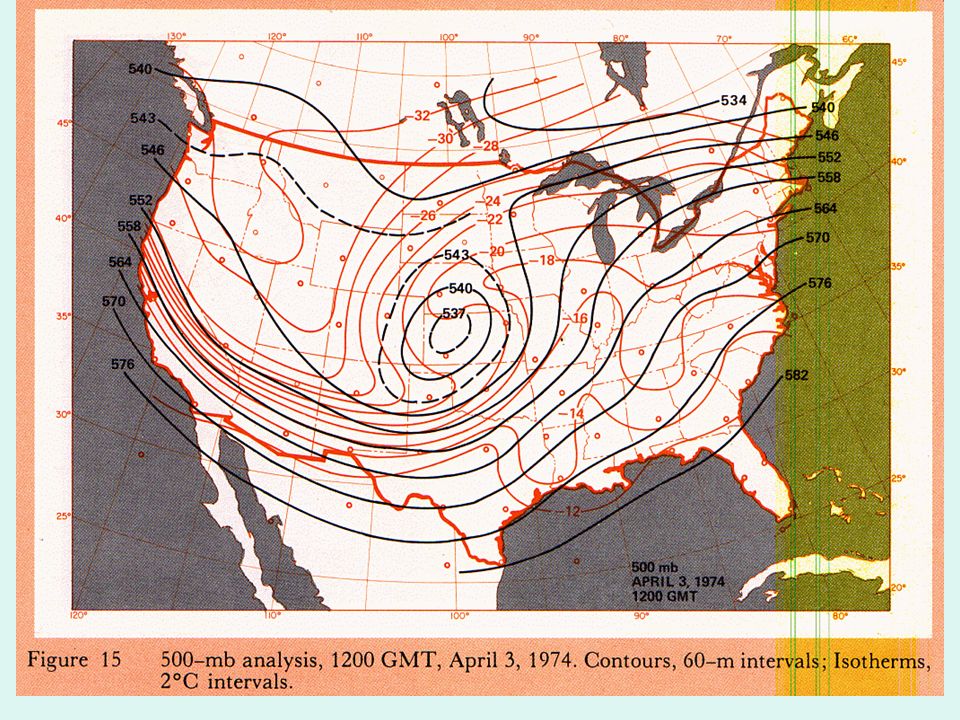
At the 500 hPa mid-troposphere level, look for an amplified trough and difluent winds. 500 hPa

13
Vorticity advection supports the cyclone and fronts but is not directly related to most severe thunderstorms.

14
In the upper troposphere (200 and 300 hPa), it’s all about the jets. 200 hPa
, it’s all about the jets. 200 hPa")
15
300 hPa How is this map different from the 200 hPa map?

16
700 hPa is a special map. Here’s one from this case at the same time as the others. Notice anything that seems odd?

17
700 hPa 850 hPa How about a comparison with 850 hPa? moisture advection dry air advection

18
Convective Instability is what happens when lifting a layer of air makes the entire layer absolutely unstable. Here’s how you do it: Dry at 700 mb Humid at 900 mb Lift the bottom of the layer from 900 to 600 mb Lift the top of the layer from 700 to 400 mb Look at the resulting lapse rate! Start with a 200 mb layer which is humid on the bottom but very dry on top. Lift the entire layer 300 mb. The bottom and top cool at different rates. This will always work if you have dry air over humid air. You just have to lift the entire layer far enough. It will be very powerfully destabilized.

20
Parcel Instability C.A.P.E.: Convective Available Potential Energy. From the AMS Glossary of Meteorology: On a thermodynamic diagram this is called positive area, and can be seen as the region between the lifted parcel process curve and the environmental sounding, from the parcel's level of free convection to its level of neutral buoyancy. Measured in joules/kilogram

21
CAPE definitions (http://www.spc.noaa.gov/misc/acronyms.html) MUCAPE: Most unstable CAPE –Lifts most unstable parcel in lowest 300 mb. –Useful in non-surface based (elevated) CAPE. SBCAPE: Surface-based CAPE –Lift surface parcel. –Usually identical to MUCAPE in the afternoon. MLCAPE: Mean-mixed CAPE –Parcel lifted using mean temp/moisture (lowest 100mb). –Most representative for diurnal development when boundary layer is well mixed.
 CAPE. SBCAPE: Surface-based CAPE –Lift surface parcel. –Usually identical to MUCAPE in the afternoon. MLCAPE: Mean-mixed CAPE –Parcel lifted using mean temp/moisture (lowest 100mb). –Most representative for diurnal development when boundary layer is well mixed..")
22
Convective Inhibition (CIN)
")
23
CIN: Convective Inhibition. Again, from the AMS Glossary of Meteorology, for an air parcel possessing positive CAPE, the CIN represents the negative area on a thermodynamic diagram. In this closeup of the KLZK sounding from 00Z, April 26, 2011, the CIN is the small light blue area to the left (colder) of the black temperature sounding. CIN is also j/kg but it is negative and means downward (negative) buoyancy.
 of the black temperature sounding. CIN is also j/kg but it is negative and means downward (negative) buoyancy..")
24
More on instability CAPE is hard for people to calculate just on seeing a sounding. So, we have some easier ways such as the Lifted Index (LI). To find the LI, first lift a parcel to its LCL:. To find the LCL, lift from the temperature along a dry adiabat, here shown in red, until your line meets the mixing ratio line from the same parcel, here shown in purple. Above the LCL, you must lift along the wet or moist adiabat, also shown in red.
. To find the LI, first lift a parcel to its LCL:. To find the LCL, lift from the temperature along a dry adiabat, here shown in red, until your line meets the mixing ratio line from the same parcel, here shown in purple. Above the LCL, you must lift along the wet or moist adiabat, also shown in red..")
25
LI = T 500 – T lifted parcel Other indices (SWEAT, K, Total-Totals) will be covered in lab
 will be covered in lab")
26
Other important levels are the Convective Condensation Level or CCL, the Level of Free Convection (LFC), and the Equilibrium Level (EL) The EL is simply where buoyancy becomes negative in the upper troposphere. It’s the level of the top of the anvil (some clouds overshoot the EL).
..")
27
If a parcel reaches its LCL and keeps rising, probably by being forced upward since it’s usually in a CIN area, it might cross the temperature sounding and become warmer than the environmental air. Where that occurs is the LFC. The CCL is the level where air heated to its Convective Temperature meets the surface mixing ratio and saturates. It’s the level where clouds become cumuloform.

28
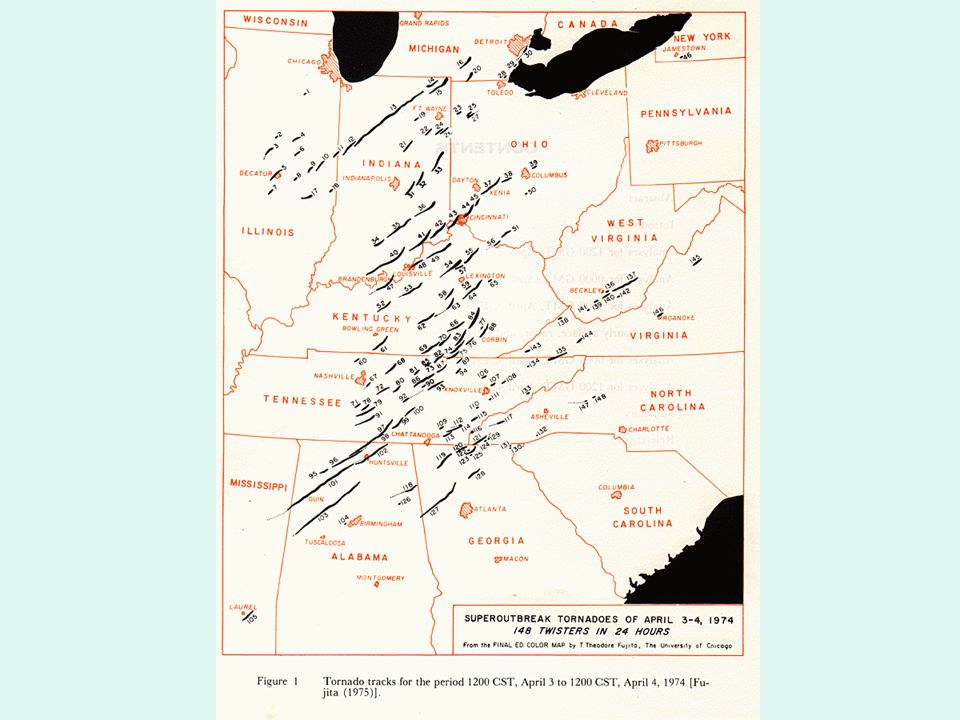
The 1974 Superoutbreak

30
1200 UTC From the daily weather map series

31
From a 1975 article by Agee, Church, Morris, and Snow. Note the time of this map is 20 UTC.

33
The remainder of the figures in this presentation are from this technical report.

39
Jackson, MS sounding, April 3, 1974 12 UTC

40
Nashville, TN sounding, April 3, 1974 12 UTC Notice how both these soundings have an elevated inversion. It’s called a lid or cap.

41
The lid means that air parcels rising from the surface have CIN. They are negatively buoyant and will not rise above the capping inversion. This prevents cumulus clouds from becoming thunderstorms early in the day, allowing more sunshine and building more instability by heating of lower layers. When parcel get hot enough, usually when they reach the Convective Temperature, they break through the lid explosively, rather than gradually. External forcing mechanisms, like fronts or drylines, can push parcels through the lid, producing the same violent upward cloud growth. You can get severe thunderstorms without a cap, but usually the most intense storms start in a capped environment.

42
What happens if the temperature rises to here?

43
That’s when you get this

Similar presentations


 Thunderstorms on Weather Maps METR 180 (Lightning and Thunderstorms)>")

