Download presentation
Presentation is loading. Please wait.

2
NAICS? YIKES! (North American industry classification system (NAICS)? Yearly index of constant (k) dollar estimates (YIKES)!) Jeff Moon, Queens (moonj@post.queensu.ca) & Laine Ruus, University of Toronto (laine.ruus@utoronto.ca)moonj@post.queensu.ca OLA 2006/02/03 http://www.chass.utoronto.ca/~laine/misc/naics_yikes.ppt
 dollar estimates (YIKES)!) Jeff Moon, Queens & Laine Ruus, University of Toronto OLA 2006/02/03")
3
Overview Finding what you’re looking for Searching www.statcan.ca and Bibliocatwww.statcan.ca Decoding Stats Can catalogue numbers Finding what things mean (definitions) Finding classifications and concordances Getting access to it Levels of access Getting to the DSP www collection What’s not available on the DSP www site
 Finding classifications and concordances Getting access to it Levels of access Getting to the DSP www collection What’s not available on the DSP www site")
4
Overview (cont’d) And your question is….? Some things we learned this year CPI: index year versus basket Census: community profiles versus census profiles versus profiles on E-stat Health region census profile

5
Searching -- www.statcan.ca

7
Results by category

8
The Daily CANSIM Census

9
75-001-XPE 75 = subject group 001 = unique number for the product X = status of product ( preliminary, revision, supplement) (X= N/A) P = medium: ‘Print’ E = language (E=English)
 (X= N/A) P = medium: ‘Print’ E = language (E=English)")
10
Click on PDF to get Internet version of this publication.

11
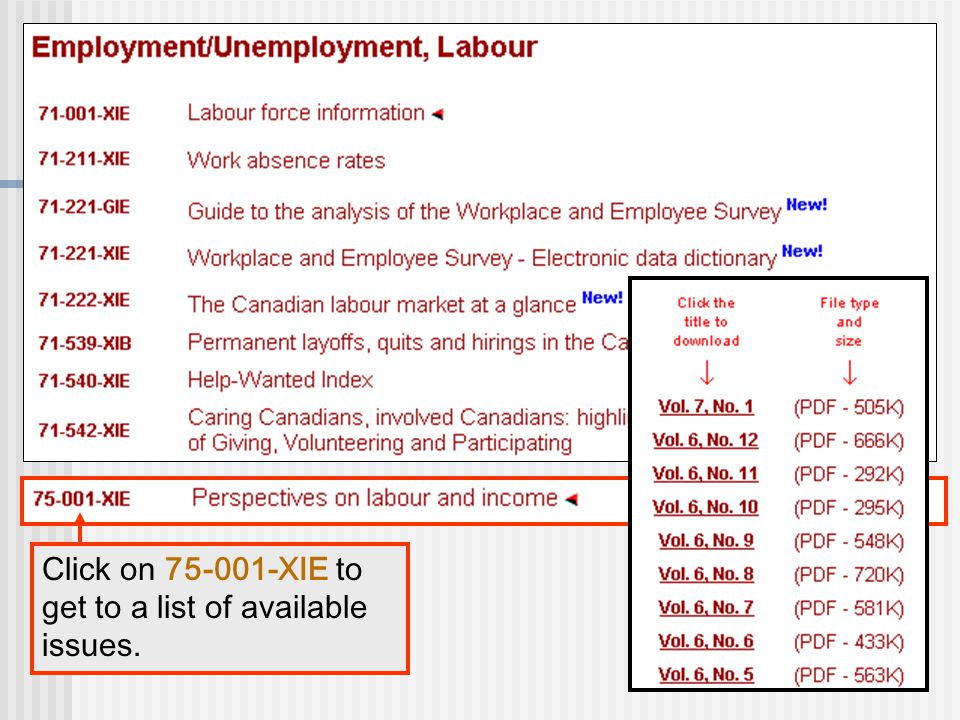
75-001-XIE 75 = subject group (Employment/Labour) 001 = unique number for the product X = preliminary, revision, supplement etc status of the product (X=not applicable) I = medium: ‘Internet’/pdf format E = language (E=English) But we don’t want to pay Click on “ Information for Libraries ”
 001 = unique number for the product X = preliminary, revision, supplement etc status of the product (X=not applicable) I = medium: ‘Internet’/pdf format E = language (E=English) But we don’t want to pay Click on Information for Libraries")
12
Click on DSP

14
Click on 75-001-XIE to get to a list of available issues.

15
Source: At the bottom of the STC Daily New products listing, e.g. http://www.statcan.ca/Daily/English/060119/p060119.htm Last published overview of codes: 1997 Stat Can catalogue Table of ‘media’ and ‘language’ codes… More on ‘decoding’ Stats Can Product Codes…

16
Where are product codes used? Used: In the Stats Can Products and services database In the Daily In Bibliocat (STC Library Catalogue) On Stats Can publications (print and electronic) Searchable: On Stats Can web site In Stats Can Products and Services database In the Daily In Bibliocat In CANSIM I on www.chass.utoronto.ca (DLI only)
 On Stats Can publications (print and electronic) Searchable: On Stats Can web site In Stats Can Products and Services database In the Daily In Bibliocat In CANSIM I on (DLI only).")
17
Speaking of Bibliocat…

18
Use BiblioCat to search for older publications and resources. Alternatives include the 1994 STC catalogue and the Historical Catalogue of Statistics Canada Publications, 1918 – 1980.

19
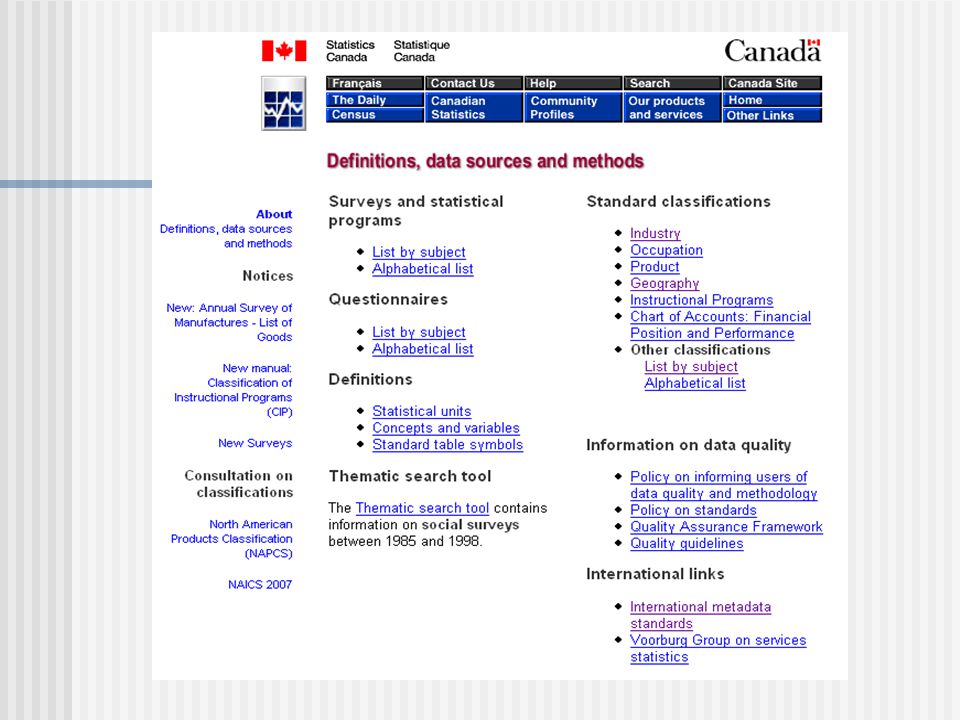
Finding what things mean (definitions) Also look in Statistics Canada print/print-like (PDF) products http://www.statcan.ca/english/concepts/index.htm http://www4.statcan.ca/english/thesaurus/index.htm
 Also look in Statistics Canada print/print-like (PDF) products")
20
Finding what things mean (cont’d) Note: the thesaurus is well hidden on the STC web site, search the web site for it. See also other web sites Economic concepts: http://canadianeconomy.gc.ca/english/economy/concepts.html Glossary of frequently used [financial and economic] terms http://www.fin.gc.ca/gloss/gloss-e.html Thesauri and controlled vocabularies http://www.collectionscanada.ca/8/4/r4-280-e.html

21
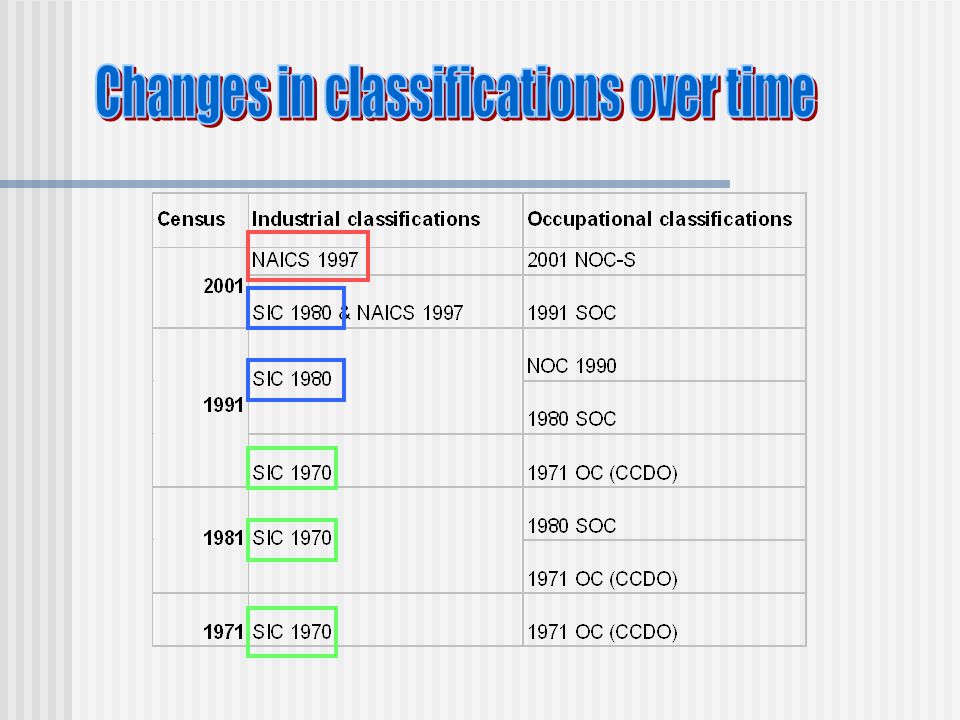
Classifications and concordances Classifications Available from Definitions, data sources and methods Outline the hierarchical structure of non- numeric concepts Indicate what is included & excluded at each level of the classification Updated to accommodate new goods, services, concepts, definitions Eg NAICS 1997, NAICS 2002, NAICS 2007

24
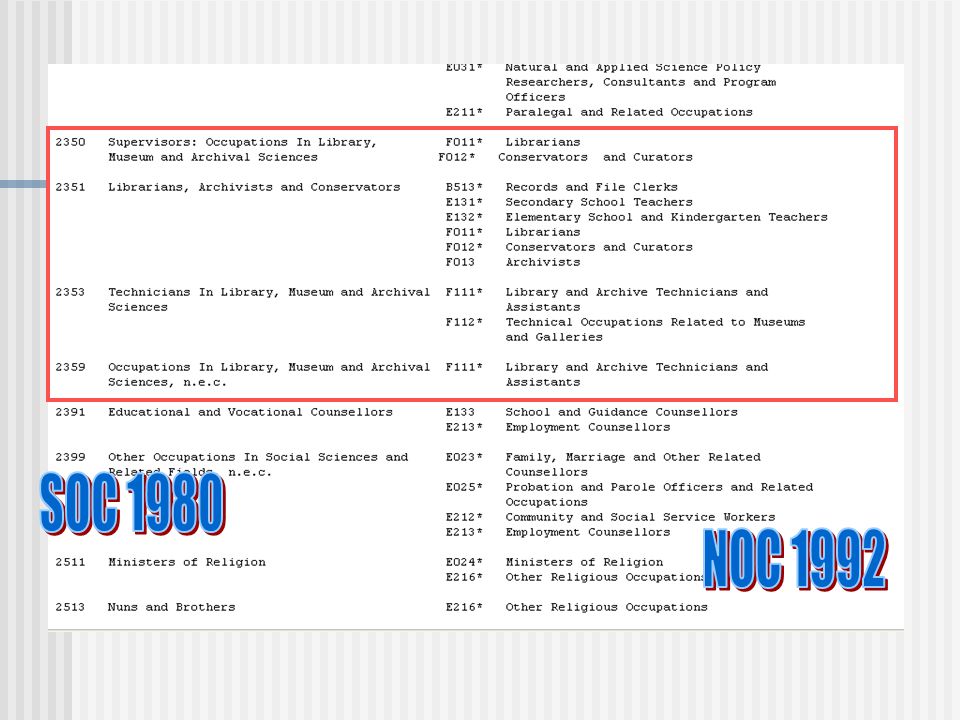
Classifications and concordances (cont’d) Concordances Cross-walk between classifications, ie outline which categories in one classification are the same as/different from which categories in another classification Especially important when comparing categories over time
 Concordances Cross-walk between classifications, ie outline which categories in one classification are the same as/different from which categories in another classification Especially important when comparing categories over time")
29
Getting access Levels of access Access to the DSP collection What’s not in the DSP collection

30
Levels of access Who has access to what, where, when, and at what cost? One view is Chuck Humphrey’s continuum of access approach, outlined at: http://www.statcan.ca/english/Dli/continuumofacc ess.htm

31
http://www.statcan.ca/english/Dli/continuumofaccess.htm Free, Unrestricted For Fee, Restricted Continuum of Access http://www.statcan.ca/english/Dli/continuumofaccess.htm Chuck Humphrey, U of Alberta Data Library

32
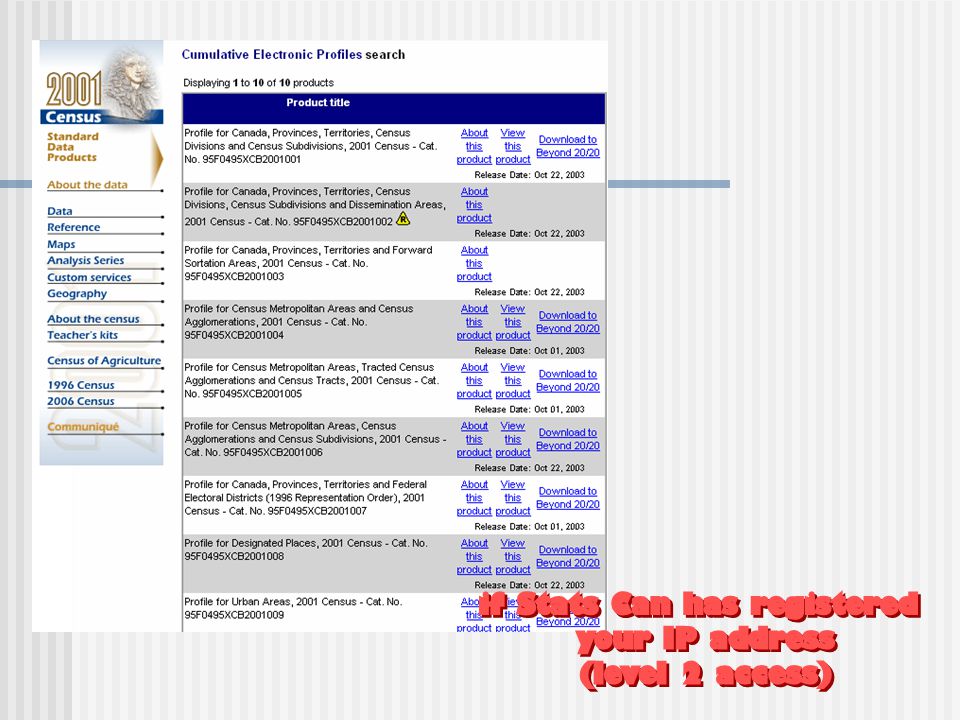
Levels of access for Census 2001 Level 1: 'public good access‘ on the STC web site available to the entire general public Level 2: "public good - expanded access“ more detailed data (eg lower geography) available to DLI, DSP, provincial focal points, funding federal departments IP address controlled
 available to DLI, DSP, provincial focal points, funding federal departments IP address controlled")
33
Levels of access for Census 2001 (cont’d) Level 2+: DLI (via DLI ftp site) geography to DA and FSA levels includes spatial data products & geographic reference files (eg Postal code conversion file) selected semi-custom products (eg Travel to work files) and public use microdata files Level 3: has the most detail (geography and characteristics) for internal STC employees only
 Level 2+: DLI (via DLI ftp site) geography to DA and FSA levels includes spatial data products & geographic reference files (eg Postal code conversion file) selected semi-custom products (eg Travel to work files) and public use microdata files Level 3: has the most detail (geography and characteristics) for internal STC employees only")
34
What’s not on the DSP web site Many statistical (non-pdf) products: eg Annual demographic statistics Excel files ESAS, Employment dynamics, Small area data, Canadian Centre for Justice Statistics files,etc. Gradually moving to free STC web access, eg Health indicators database Human activity and the environment Health regions cd-rom Public use microdata files Semi-custom and custom products

35
Some things we learned this year CPI: index year versus basket Census profiles: community profiles, electronic profiles, versus E-stat profiles Profile of health regions (2001 census)
")
36
CPI index year versus basket

38
Baskets About 600 goods & services priced each month (incl. GST & PST) Weights assigned to reflect importance of the items in the basket 1% change in price of milk affects index more than 5% change in price of tea Updated about every 4 years 1992 basket was first to include GST 2001 basket contains ‘Internet service charges’, previous baskets didn’t
 Weights assigned to reflect importance of the items in the basket 1% change in price of milk affects index more than 5% change in price of tea Updated about every 4 years 1992 basket was first to include GST 2001 basket contains ‘Internet service charges’, previous baskets didn’t.")
40
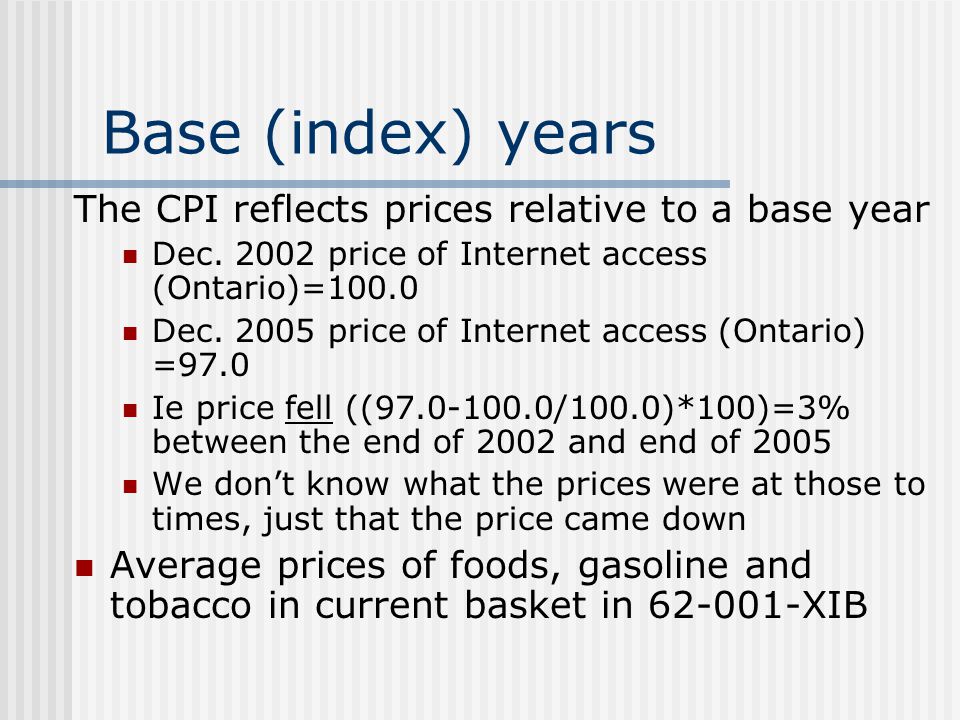
Base (index) years The CPI reflects prices relative to a base year Dec. 2002 price of Internet access (Ontario)=100.0 Dec. 2005 price of Internet access (Ontario) =97.0 Ie price fell ((97.0-100.0/100.0)*100)=3% between the end of 2002 and end of 2005 We don’t know what the prices were at those to times, just that the price came down Average prices of foods, gasoline and tobacco in current basket in 62-001-XIB
=100.0 Dec price of Internet access (Ontario) =97.0 Ie price fell (( /100.0)*100)=3% between the end of 2002 and end of 2005 We don’t know what the prices were at those to times, just that the price came down Average prices of foods, gasoline and tobacco in current basket in XIB.")
41
How do I convert an index to another base year? Compute a ratio = [new index at time1]/[old index at time1]. Eg new index has base year 1995=100; the old index has base year 1985=100 the index value for year 1995 (1985=100) was 127.5; the value for year 1995 (1995=100) is 100 the ratio is (100/127.5)=.7843 Multiply values on the old index by.7843 to convert them to the new base year (1995=100).
 was 127.5; the value for year 1995 (1995=100) is 100 the ratio is (100/127.5)=.7843 Multiply values on the old index by.7843 to convert them to the new base year (1995=100)..")
42
Conversion factor: (100/127.5)=0.7843 New series= (old series x conversion factor)
= New series= (old series x conversion factor)")
43
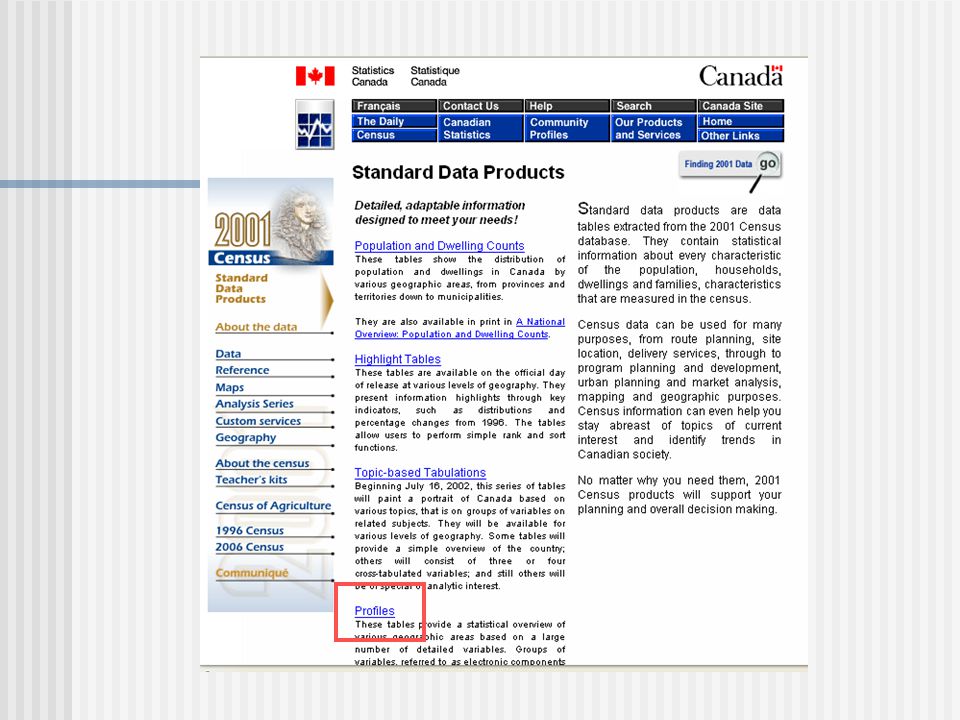
Census profiles …many flavours There are 5 main products you should be aware of (2001 census): Community profiles Electronic profiles Census profiles on the E-stat web site Profile of health regions Topic-based tabulations – for additional breakdowns (in addition to gender)
: Community profiles Electronic profiles Census profiles on the E-stat web site Profile of health regions Topic-based tabulations – for additional breakdowns (in addition to gender)")
45
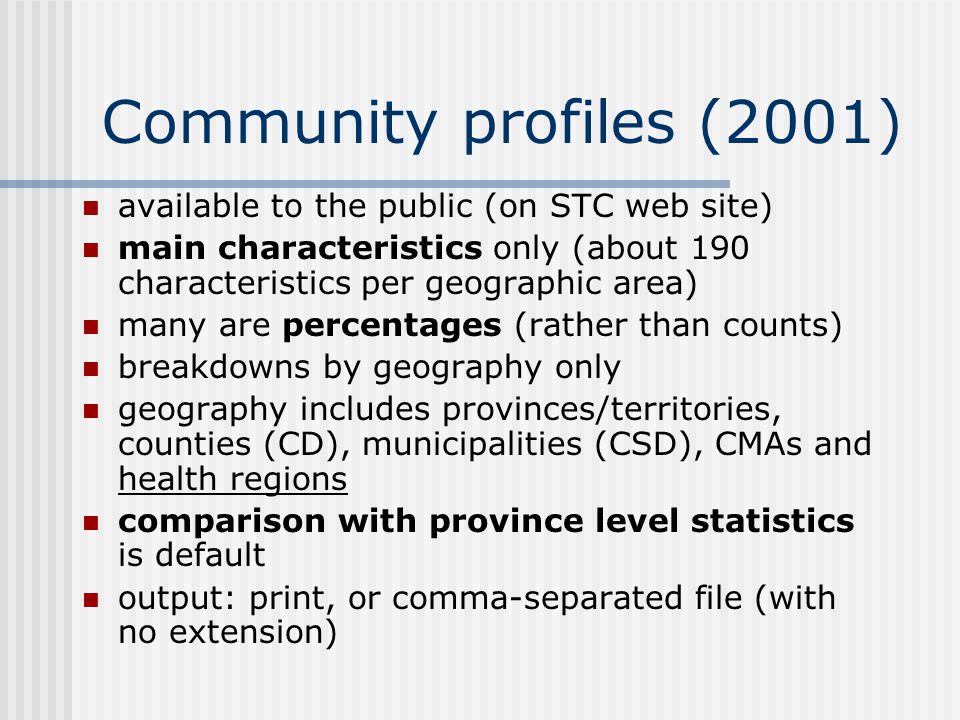
Community profiles (2001) available to the public (on STC web site) main characteristics only (about 190 characteristics per geographic area) many are percentages (rather than counts) breakdowns by geography only geography includes provinces/territories, counties (CD), municipalities (CSD), CMAs and health regions comparison with province level statistics is default output: print, or comma-separated file (with no extension)
 available to the public (on STC web site) main characteristics only (about 190 characteristics per geographic area) many are percentages (rather than counts) breakdowns by geography only geography includes provinces/territories, counties (CD), municipalities (CSD), CMAs and health regions comparison with province level statistics is default output: print, or comma-separated file (with no extension)")
52
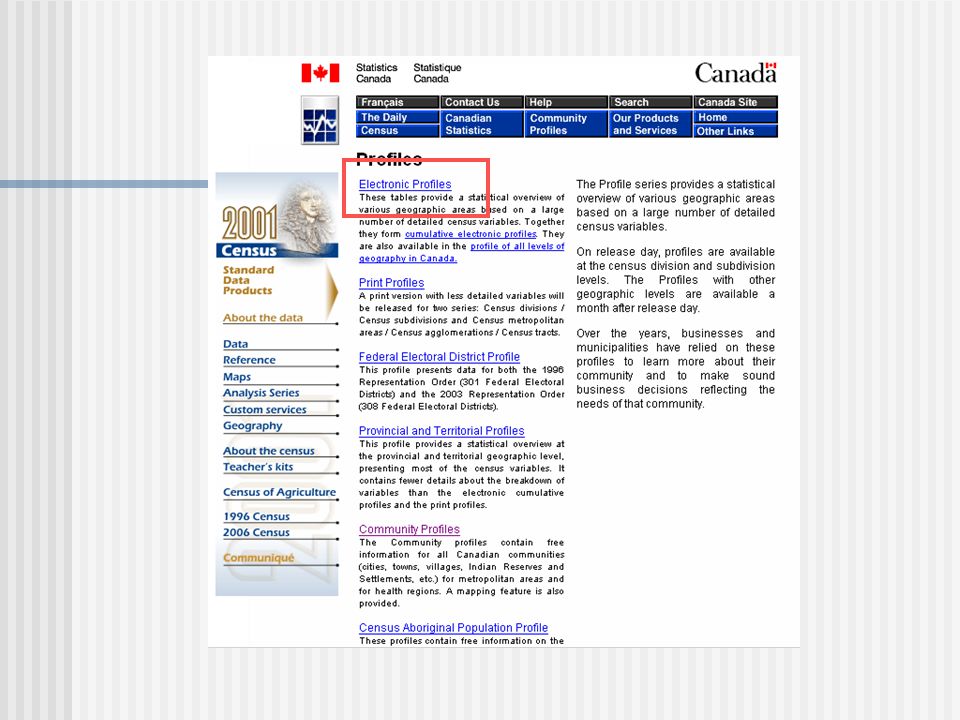
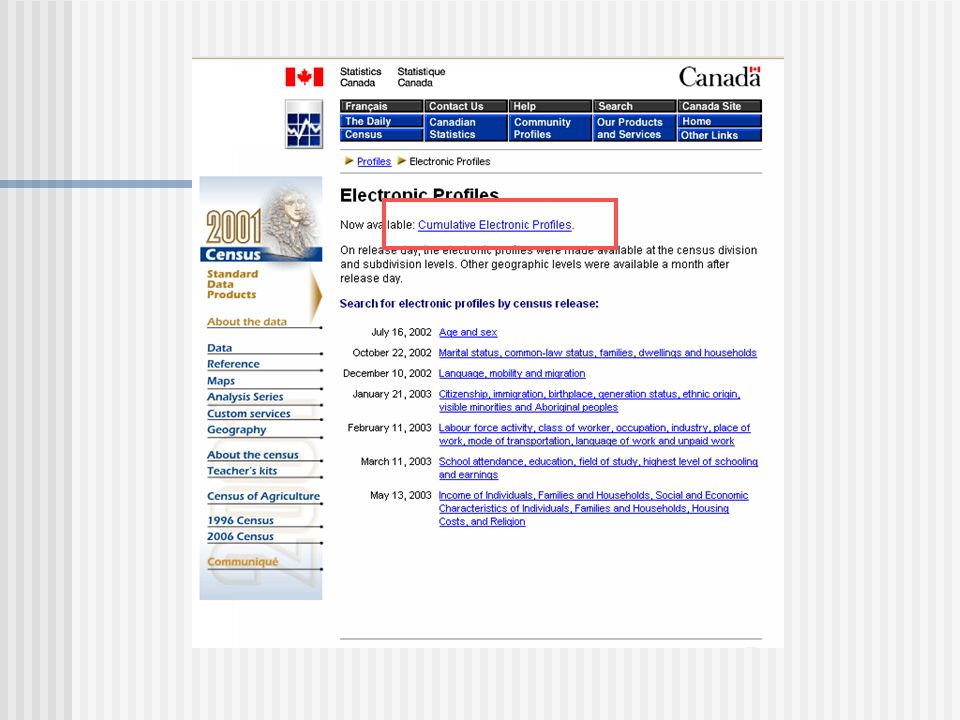
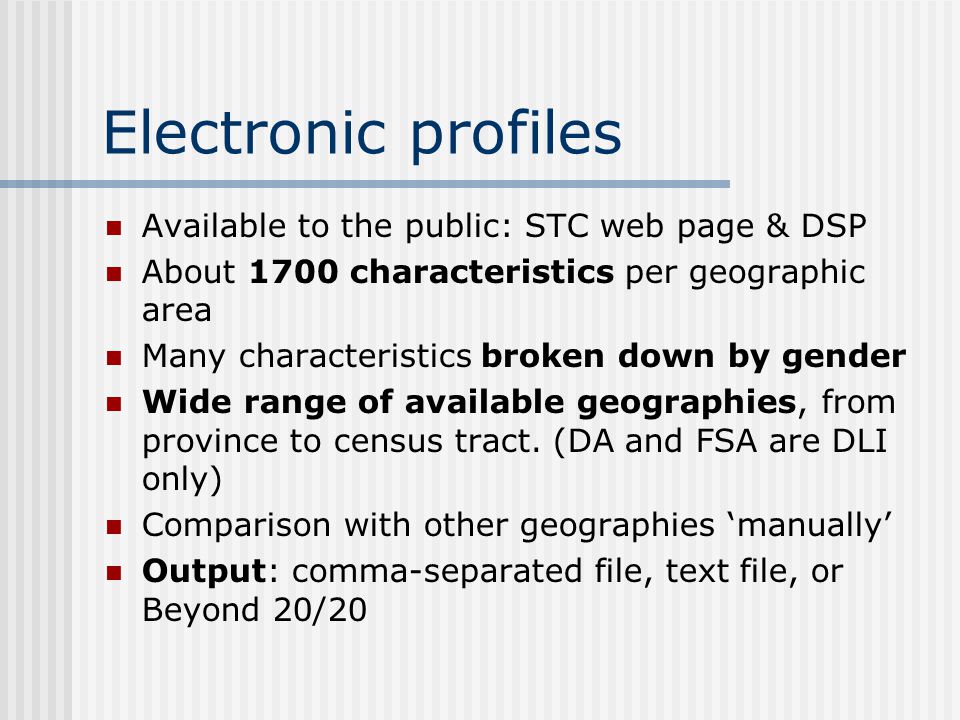
Electronic profiles Available to the public: STC web page & DSP About 1700 characteristics per geographic area Many characteristics broken down by gender Wide range of available geographies, from province to census tract. (DA and FSA are DLI only) Comparison with other geographies ‘manually’ Output: comma-separated file, text file, or Beyond 20/20
 Comparison with other geographies ‘manually’ Output: comma-separated file, text file, or Beyond 20/20.")
55
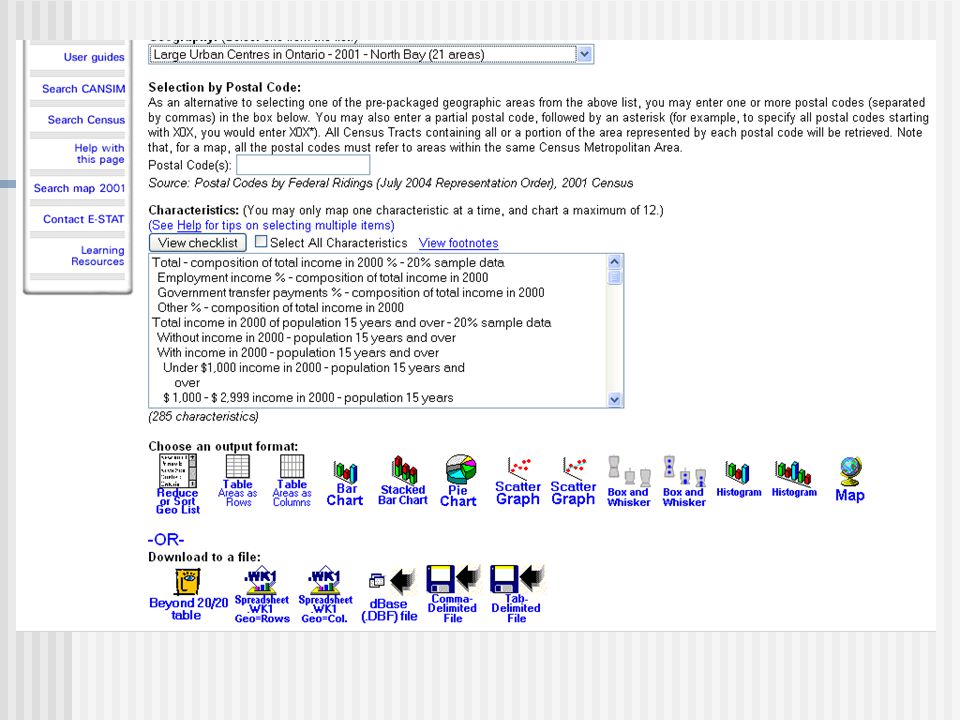
Profiles on E-stat available to the public under DSP includes all census profile characteristics (1700+) geography by county (CD), municipality (CSD), CMA and census tract only select by postal code capability (census-tract level profiles) widest range of output products, including interactive mapping includes Census of Agriculture products
 geography by county (CD), municipality (CSD), CMA and census tract only select by postal code capability (census-tract level profiles) widest range of output products, including interactive mapping includes Census of Agriculture products")
56
Profile of health regions (2001) Not linked to 2001 census profiles web pages Access from Health regions web page About 1250 census characteristics Beyond 20/20 format
 Not linked to 2001 census profiles web pages Access from Health regions web page About 1250 census characteristics Beyond 20/20 format")
58
And your question is………?

Similar presentations


: product review Laine G.M. Ruus Data Library Service, University of Toronto Ontario DLI Training Guelph University, Guelph,>")
 Queens University National DLI Training Montreal May.>")


