Download presentation
Presentation is loading. Please wait.

1
Authors: Vasily Bankovsky, Igor Bankovsky, Pavel Bankovsky

2
Part I Introduction

3
RTS-1C, Reverse Tube Spinner — Real Time Cell Growth Logger Specifications: Temperature setting range +4°C... + 70°C Measurement periodicity till 60 measurements per hour Rotation Speed 250–2000 rpm Software Controlled Experiments 10 units simultaneously Continuous Operating Time n/d Warranty 35 000 hrs

4
RTS-1 — 4 Instruments in 1 Measuring Thermostating Mixing Software Logging

5
Introduction: Noninvasive Mixing Principles

6
Reverse Spinning vs Orbital Shaking Ability to measure OD non invasively Cell Growth in single use reactors Natural centric auto-balancing Simplicity No power consumption for contra- balancing Do not need to take aliquot for OD measurement Proportionality between orbital diameter and the diameter of the moving vessel Artificial hula-hoop auto-balancing Larger size Heavy Extra power consumption for contra-balancing

7
Orbital Shaking vs Reverse Spinning

8
Part II Principles of Reverse Spinning

9
Growth medium behavior inside the bioreactor Rotation IntensityRotation around axis Spread of the broth media inside of rotation tube as a function of rotation intensity

10
Vortex behavior inside the tube Video demonstration:

11
Reverse Spinning Lifecycle

12
Centrifugal Forces as a Mechanical Defoamer

13
Principle of OD measurement Automatic(A) - Wavelength of light source: 850nm
 - Wavelength of light source: 850nm")
14
Principle of absorption measurement and measurement modes H-L-A Video demonstration:

15
Fig. 1 The effect of media volume on layer thickness(mm) during 2000 rpm rotation intensity Fig. 2 Video demonstration:

16
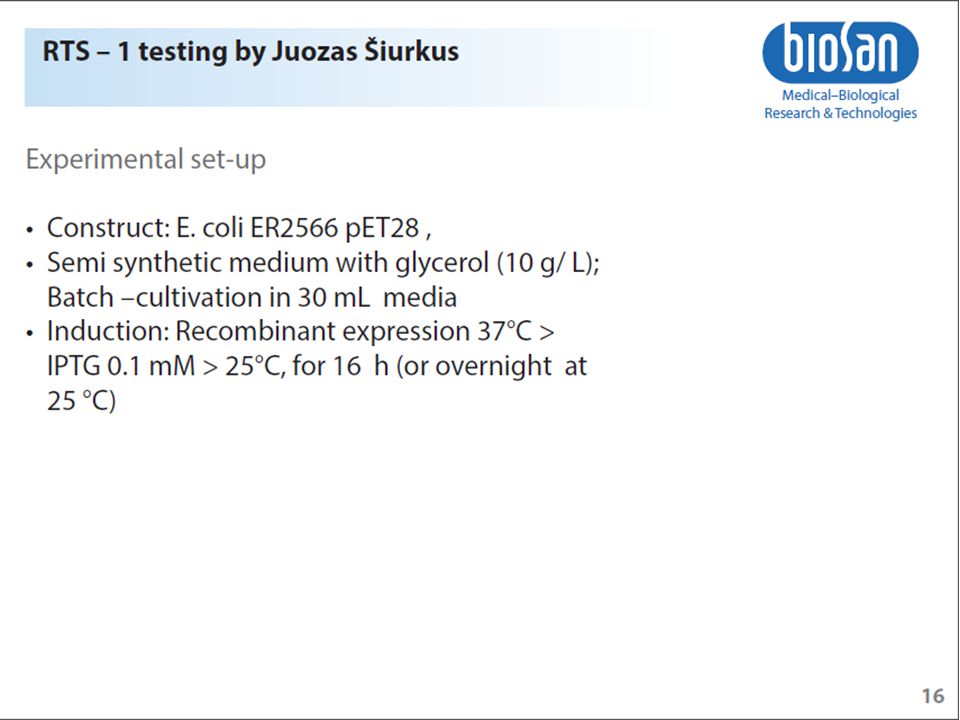
Recommended bioreactor tube: TPP plastic 50mL Tubespin bioreactor working volume 1 – 30 ml conical form 5 openings (A, B, C, D, E) of different size above the gas permeable, sterile PTFE filter of the screw cap openings can be sealed and by this, exchange adjusted to need sterile gas exchange is guaranteed by the 0.22 µm filter membrane even with a high cell density the supply of oxygen through the openings is sufficient tube fits in a standard 50 ml centrifuge rotor Single use
 of different size above the gas permeable, sterile PTFE filter of the screw cap openings can be sealed and by this, exchange adjusted to need sterile gas exchange is guaranteed by the 0.22 µm filter membrane even with a high cell density the supply of oxygen through the openings is sufficient tube fits in a standard 50 ml centrifuge rotor Single use")
17
Part III Experimental Results

18
Reverse Spin longitude (RSL) effect on E.coli BL21 growth kinetics and growth rate [ µ ( 1/h ) vs time (hr)] Fig. 1 RSL effect on E.coli growth kinetics over time Fig. 2 RSL effect on E.coli growth rate over time Fig. 3 3D representation of Fig. 1 Fig. 4 3D representation of Fig. 1
![Reverse Spin longitude (RSL) effect on E.coli BL21 growth kinetics and growth rate [ µ ( 1/h ) vs time (hr)] Fig.](http://images.slideplayer.com/18/6092638/slides/slide_18.jpg "1 RSL effect on E.coli growth kinetics over time Fig. 2 RSL effect on E.coli growth rate over time Fig. 3 3D representation of Fig. 1 Fig. 4 3D representation of Fig. 1.")
19
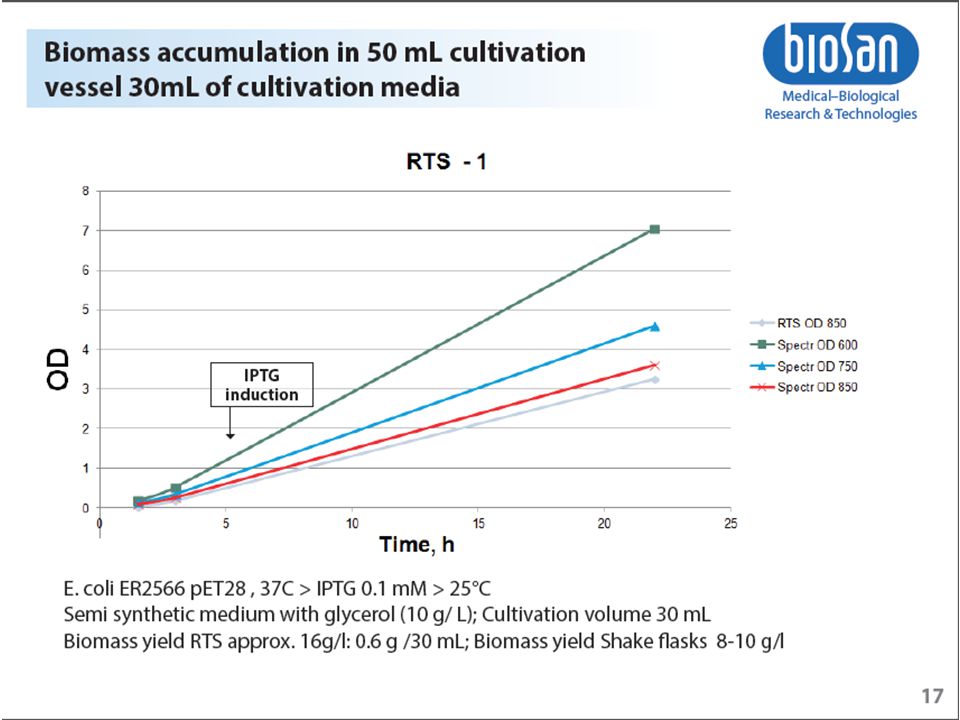
Growth media volume effect on E.coli BL21 growth kinetics [ 0D(860 nm) vs time (hr)] and growth rate [ µ ( 1/h ) vs time (hr)] Fig. 1 Growth media volume effect on E.coli growth kinetics over time Fig. 2 Growth media volume on E.coli growth rate over time Fig. Growth media volume on E.coli growth kinetics over time in 3D
![Growth media volume effect on E.coli BL21 growth kinetics [ 0D(860 nm) vs time (hr)] and growth rate [ µ ( 1/h ) vs time (hr)] Fig.](http://images.slideplayer.com/18/6092638/slides/slide_19.jpg "1 Growth media volume effect on E.coli growth kinetics over time Fig. 2 Growth media volume on E.coli growth rate over time Fig. Growth media volume on E.coli growth kinetics over time in 3D.")
20
LB x 2 LB x 1 LB x 1/2 LB x 1/4 LB x 1/8 LB x 4 Influence of LB concentration on E.Coli BL21 growth kinetics [ OD(860 nm) vs time (hr)] and growth rate [ µ ( 1/h ) vs time (hr)] Fig. 1 LB conc. effect on E.coli growth kinetics over time Fig. 2 LB conc. effect on E.coli growth rate over time Fig. 3 3D representation of Fig. 1
![LB x 2 LB x 1 LB x 1/2 LB x 1/4 LB x 1/8 LB x 4 Influence of LB concentration on E.Coli BL21 growth kinetics [ OD(860 nm) vs time (hr)] and growth rate [ µ ( 1/h ) vs time (hr)] Fig.](http://images.slideplayer.com/18/6092638/slides/slide_20.jpg "1 LB conc. effect on E.coli growth kinetics over time Fig. 2 LB conc. effect on E.coli growth rate over time Fig. 3 3D representation of Fig. 1.")
21
Lactobacillus acidophilus sp. growth kinetics and growth rate [ µ ( 1/h ) vs time (hr)] Nitrogen was purged into the bioreactor in sterile conditions to eliminate O2 presence Fig. 1 LB conc. effect on E.coli growth kinetics over time Fig. 2 LB conc. effect on E.coli growth rate over time Fig. 3 3D representation of Fig. 1 Fig. 4 3D representation of Fig. 2
 vs time (hr)] Nitrogen was purged into the bioreactor in sterile conditions to eliminate O2 presence Fig. 1 LB conc. effect on E.coli growth kinetics over time Fig. 2 LB conc. effect on E.coli growth rate over time Fig. 3 3D representation of Fig. 1 Fig. 4 3D representation of Fig. 2.")
22
Effect of T(c) on E.coli BL21 growth kinetics [ OD(860 nm) vs time (hr)] and growth rate [µ ( 1/h ) vs time (hr)] Fig. 1 T(c) effect on E.coli growth kinetics over time Fig. 2 T(c) on E.coli growth rate over time Fig. 3 3D Graph representation of Fig. 1 Fig. 4 3D Graph representation of Fig. 2
![Effect of T(c) on E.coli BL21 growth kinetics [ OD(860 nm) vs time (hr)] and growth rate [µ ( 1/h ) vs time (hr)] Fig.](http://images.slideplayer.com/18/6092638/slides/slide_22.jpg "1 T(c) effect on E.coli growth kinetics over time Fig. 2 T(c) on E.coli growth rate over time Fig. 3 3D Graph representation of Fig. 1 Fig. 4 3D Graph representation of Fig. 2.")
23
Effect of different T-shock (42-70°C) on E.coli BL21 growth kinetics of Fig. 1 T-shock effect on E.coli growth kinetics over time Fig. 2 T-shock effect on E.coli growth rate over time Fig. 3 3D graph of Fig.1 Fig. 4 Temperature in bioreactor over time

24
Effect of T-shock (63…69°C) on E.coli BL21 growth kinetics Fig. 1 T-shock effect on E.coli growth kinetics over time Fig. 3 T-shock effect on E.coli growth rate over time Fig. 4 3D graph of Fig.1 Fig. 2 Temperature in bioreactor over time

25
Coarse approximation delta 5 (C) increments from 37(C) to 70(C) Fine approximation with a delta 1(C) increments from 63(C) to 69(C) At 70 (C) irreversible inactivation of 30S subunit of E.coli ribosome take place. ( J.Lee at all.,Appl.Env.Micr. 2002 5379 – 5386 ) Process of inactivation in range 62 (C) till 69 (C) is reversible Heat treatment optimization by E.coli BL21 growth kinetics investigation of T(C) value pretreatment Fig. 1 3D graph representation of T-shock effect on E.coli growth kinetics over time (42C-70C) Fig. 2 3D graph representation of T-shock effect on E.coli growth kinetics over time (63C-69C)
 Process of inactivation in range 62 (C) till 69 (C) is reversible Heat treatment optimization by E.coli BL21 growth kinetics investigation of T(C) value pretreatment Fig. 1 3D graph representation of T-shock effect on E.coli growth kinetics over time (42C-70C) Fig. 2 3D graph representation of T-shock effect on E.coli growth kinetics over time (63C-69C).")
26
Fig. 3 cycling type temperature profiling over time Possibility to apply different profiling modes: A) Periodic (cycling type) B) Stochastic(random values) C) Mixed type (A+B) Effect of temperature fluctuation (delta 10°C from 37°C) on growth kinetics and growth rate of E.coli BL21 Fig. 1 t(C) fluctuation effect on E.coli growth kinetics over time Fig. 2 t(C) fluctuation effect on E.coli growth rate over time
 Periodic (cycling type) B) Stochastic(random values) C) Mixed type (A+B) Effect of temperature fluctuation (delta 10°C from 37°C) on growth kinetics and growth rate of E.coli BL21 Fig. 1 t(C) fluctuation effect on E.coli growth kinetics over time Fig. 2 t(C) fluctuation effect on E.coli growth rate over time.")
27
Effect of temperature fluctuation (delta 10°C from 37°C) on growth kinetics and growth rate of E.coli BL21 on LB media Fig. 2 periodic cycling type temperature profiling over time Fig. 1 t(C) fluctuation effect on E.coli growth kinetics over time Fig. 3 t(C) fluctuation effect on E.coli growth rate over time Bioreactors set temperature: 1. Prof32 – Delta
 fluctuation effect on E.coli growth kinetics over time Fig. 3 t(C) fluctuation effect on E.coli growth rate over time Bioreactors set temperature: 1. Prof32 – Delta.")
31
Cultivation of CHO-K1 Cell Culture using Reverse-Spin method

32
Part IV The Future Developments

36
Multi-option in 6 Channel Reverse Spinner

37
RS-4

38
Color of Phenol Red vs pH after E.coli BL 21 growth on LB and LB+Glucose media pH= 6 pH= 7 pH=8LB+Glu LB

39
pH Indicator Dyes and Micro Color Sensors

40
Thermophilus sp. cultivation using different non invasive mixing principles Growth conditions RS -1 Falcon……...……...50 ml TY(0,2%NaCl) ……25 ml Speed of rotation 2000 rpm Reverse ………… 10 sec Temperature ….. 60 C Orbital shaker ES20/60 Falcon …………… 50 ml TY(0,2%NaCl) ……25 ml Orbit ……………….20 mm Speed of rotation.240 rpm Temperature ……. 60 C Rocker Falcon……...……...50 ml TY(0,2%NaCl) ……25 ml Angle of rocking ….7 grad Oscillation freq. 120 min-1 Temperature …….60 C Thermophillus sp extremely Difficult to control cells growth in real time because of high optimum of growth temperature ( T(C) is more than 60 C )
 ……25 ml Speed of rotation 2000 rpm Reverse ………… 10 sec Temperature ….. 60 C Orbital shaker ES20/60 Falcon …………… 50 ml TY(0,2%NaCl) ……25 ml Orbit ……………….20 mm Speed of rotation.240 rpm Temperature ……. 60 C Rocker Falcon……...……...50 ml TY(0,2%NaCl) ……25 ml Angle of rocking ….7 grad Oscillation freq. 120 min-1 Temperature …….60 C Thermophillus sp extremely Difficult to control cells growth in real time because of high optimum of growth temperature ( T(C) is more than 60 C ).")
41
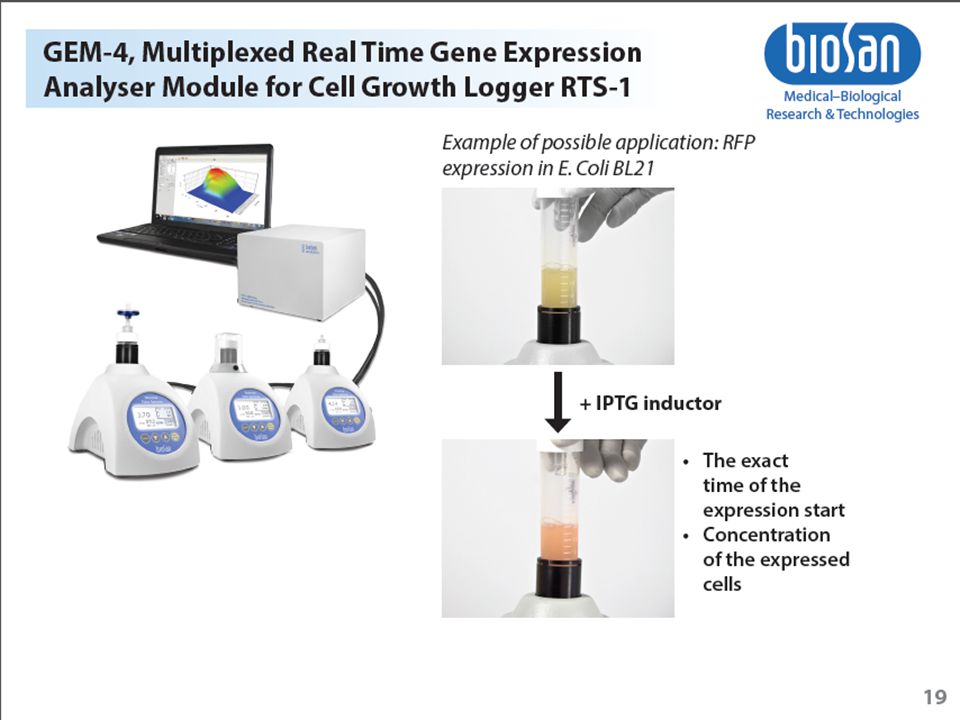
New projects with Personal bioreactor RTS-1 optical pH and Oxygen measurement Yeast cultivation optimization Cultivation of microbes associates Viruses vs cells investigations Recombinants growth optimization Environmental models research Fluorescence detectors for non intrusive analyses of goal fermentation products

42
Thank you for your attention

Similar presentations


, water activity (aw) and cooking loss. Other physical parameters.>")

 (auxotroph) YPD with antibiotics.>")


 - VIALS WITH NUTRIENT STOCK SOLUTIONS A (2 vials),>")


. Principle Fermentation: it is a metabolic process that converts complex organic compounds (ex: sugars) into simpler ones.>")
 to determine.>")

