Download presentation
Presentation is loading. Please wait.

1
The South African Forestry and Forest Products Industry 2007 Roger Godsmark Produced by Forestry South Africa, August 2008

2
Presentation Outline Introduction The importance of the Forestry Industry The importance of the Forest Products Industry Industry Contribution to Employment Investment Industry Contribution to GDP Industry Contribution to Foreign Trade

3
Section 1 Introduction

4
Land Use in South Africa Total RSA land area – 122.3 million ha 1 266 196 ha

5
Land Use in Mpumalanga Total Mpum. land area – 8.2 million ha (6.7% of total) 514 956 ha
 ha")
6
Land Use in KwaZulu Natal Total KZN land area – 9.1 million ha (7.5% of total) 486 967 ha
 ha")
7
Land Use in the Eastern Cape Total E. Cape land area – 17.1 million ha (13.9% of total) 155 078 ha
 ha")
8
Land Use in the Western Cape Total W. Cape land area – 12.9 million ha (10.6% of total) 61 097 ha
 ha")
9
Land Use in Limpopo Total Limpopo land area – 12.0 million ha (9.8% of total). 48 096 ha
 ha")
10
Plantation Area as % of Land Area by Province Forestry in Mpumalanga greatest % of land area

11
Land Use Comparisons in RSA 1996, 2001 & 2007 Drop in Forestry Area – 221 000 ha (14.9%)
")
12
Section 2 The Forestry Industry

13
Plantation Area by Species 2007 Total – 1 266 194 ha

14
Plantation Area by Ownership 2007 Total – 1 266 194 ha

15
Plantation Area by Province 2007 Total – 1 266 194 ha

16
Plantation Area by Province and Genera 2007 Total – 677 079 ha (softwood) Total – 589 115 ha (hardwood)
 Total – ha (hardwood)")
17
Planted Area Comparisons by Region & Species 2007

18
Pine Plantation Area by Region 2007 Total – 677 079 ha (53.5% of total)
")
19
Eucalyptus Plantation Area by Region 2007 Total – 477 703 ha (37.7% of total)
")
20
Wattle Plantation Area by Region 2007 Total – 102 980 ha (8.1% of total)
")
21
Other Hardwood Plantation Area by Region 2007 Total – 8 432 ha (0.7% of total)
")
22
Plantation Area by Management Objectives 2007 Total – 1 266 194 ha

23
Softwood Plantation Area by Management Objectives 2007 Total – 677 079 ha

24
Hardwood Plantation Area by Management Objectives 2007 Total – 589 118 ha

25
Plantation Area by Province and Ownership 2007 Total Private – 1 051 223 ha (83%) Total Public – 214 971 ha (17%) Leased Safcol packages included in “Private”
 Total Public – ha (17%) Leased Safcol packages included in Private")
26
Percentage Plantation Ownership by Province 2007 Total Private – 1 051 223 ha (83%) Total Public – 214 971 ha (17%)
 Total Public – ha (17%)")
27
Plantation Area by Species and Ownership 2007 Total Private – 1 051 223 ha (83%) Total Public – 214 971 ha (17%)
 Total Public – ha (17%)")
28
Percentage Plantation Ownership by Species 2007 Total Private – 1 051 223 ha (83%) Total Public – 214 971 ha (17%)
 Total Public – ha (17%)")
29
Planted Area Comparisons by Region & Product 2007

30
Plantation Area by Ownership and Species 2007

31
Percentage Plantation Ownership by Species 2007

32
Roundwood Production by Province and Genera 2007 Total – 9.0 million m 3 (softwood) Total – 11.3 million m 3 (hardwood)
 Total – 11.3 million m 3 (hardwood)")
33
Roundwood Production by Province and Genera 2007 0.634 0.684 1.750 7.906 9.356 Total – 9.0 million m 3 (softwood) Total – 1.3 million m 3 (hardwood)
 Total – 1.3 million m 3 (hardwood)")
34
Total Roundwood Production ex Plantations by Province 2007 Total – 20.3 million m 3 or 17.8 million tons

35
Total Roundwood Production ex Plantations by Product 2007 Total – 20.3 million m 3 or 17.8 million tons

36
Softwood Roundwood Production ex Plantations by Product 2007 Total – 9.0 million m 3 or 9.3 million tons

37
Hardwood Roundwood Production ex Plantations by Product 2007 Total – 11.3 million m 3 or 8.4 million tons

38
Total Roundwood Production ex Plantations by Species 2007 Total – 20.3 million m 3 or 17.8 million tons

39
Composition of Roundwood Production by Product 2007

40
Total Roundwood Production ex Plantations 1980 to 2007 Total increase in production over period: 71.1% Total in increase in afforested area over period: 9.0%

41
Roundwood Production vs. Plantation Area 1980 to 2007 Total increase in production over period- 71.1% Total in increase in afforested area over period- 9.0%

42
Average Productivity per Hectare 1980 - 2007 Total increase in productivity over period – 5.8 m 3 per ha p.a. (57%)
.")
43
Production Comparisons 1996, 2001 & 2007

44
Value of Roundwood Production 2007 Total – R5.2 billion

45
Value of Roundwood Production 1980 to 2007 Nominal increase over period: R5.0 bn (3 037%) Real increase over period: R2.9 bn (129%)
 Real increase over period: R2.9 bn (129%)")
46
New Afforestation by Region 1980 to 2007 New afforestation over period- 375,811 ha Average per year- 13,422 ha AVERAGE

47
Total New Afforestation by Region 1980 to 2007 Total – 375 811 ha

48
New Afforestation by Region 10 Year Period – 1998 to 2007 New afforestation over period- 42 010 ha Average per year- 4 201 ha AVERAGE

49
Total New Afforestation by Region 10 Yr Period - 1998 to 2007 Total – 42 010 ha

50
New Afforestation by Province 2007 Total – 2,198 ha

51
New Afforestation by Species 1980 to 2007 Average p.a. 1980 to 1985- 10 974 ha (17.5% of total) Average p.a. 1986 to 1990- 24 558 ha (32.7% of total)
 Average p.a to ha (32.7% of total).")
52
Total New Afforestation by Species 1980 to 2007 Total – 375 809 ha

53
New Afforestation by Species 2007 Total – 2 196ha

54
New Afforestation by Product 1980 to 2007 Average p.a. 1991 to 1995- 24 406 ha (32.5% of total) Average p.a. 1996 to 2000- 7 019 ha (9.3% of total) Average p.a. 2001 to 2007- 4 293 ha (8.0% of total)
 Average p.a to ha (9.3% of total) Average p.a to ha (8.0% of total).")
55
Total New Afforestation by Product 1980 to 2007 Total – 375 809 ha

56
New Afforestation by Product 2007 Total – 2 198 ha

57
Area Converted Out of Timber Production by Species 1980 to 2007 Area converted over period- 85 140 ha Average p.a. - 3 041 ha

58
Total Area Converted out of Timber Production by Species 1980 to 2007 Total – 85 140 ha

59
Total Area Converted out of Timber Production by Species 2007 Total – 793 ha

60
Net New Afforestation by Species 1980 to 2007 Net new afforestation over period- 290 669 ha Average p.a. - 10 766 ha

61
Net New Afforestation by Species 1980 to 2007 Total – 290 669 ha

62
Net New Afforestation by Species 2007 Total net new afforestation - 1 403 ha

63
Area Converted Out of Timber Production by Region 1980 to 2007 Area converted over period- 85 140 ha Average p.a. - 3 041 ha

64
Total Area Converted out of Timber Production by Region 1980 to 2007 Total – 85 140 ha

65
Net New Afforestation by Region 1980 to 2007 Net new afforestation over period- 290 669 ha Average p.a. - 10 766 ha

66
Net New Afforestation by Region 1980 to 2007 Total – 290 669 ha

67
Conversion of Plantations out of Production & to Other Species 1980 to 2007 Net loss to production area over period- 85 140 ha Average p.a. - 3 041 ha

68
Total Area Converted out of Production & to Other Species 1980 to 2007 Net loss to production area over period- 85 140 ha Average p.a. - 3 041 ha

69
Area Converted out of Production & to Other Species 2007 Net loss to production area - 793 ha

70
Net Addition to Planted Area by Species 1980 to 2007 Total net addition to production area- 290 696 ha Average p.a. - 10 766 ha

71
Total Net Addition to Planted Area by Species 1980 to 2007 Total net addition to production area- 290 669 ha Average p.a. - 10 766 ha

72
Net Addition (Loss) to Planted Area by Species 2007 Total net gain in production area- 1403 ha
 to Planted Area by Species 2007 Total net gain in production area ha")
73
Damage to Plantations by Genera 1980 to 2007 Total area damaged over period- 830 615 ha Average p.a. - 29 665 ha

74
Damage to Plantations by Fires 1980 to 2007 Total area damaged over period- 830 615 ha Total area damaged by fire- 457 951 ha (55.1%) Total area damaged by other causes- 372 664 ha (44.9%)
 Total area damaged by other causes ha (44.9%)")
75
Damage to Plantations by Fires 1980 to 2007

76
Damage to Plantations by Genera 2007 Total – 97 593 ha (7.7% of total planted area)
")
77
Damage to Plantations by Cause 2007 Total – 97 593 ha

78
Damage to Plantations by Fire 2007 Total – 70 697 ha

79
FSC Certified Forests by Forest Type: October 2007 Certified Area – 1 622 196 ha (incl. planted & non-planted areas)
.")
80
FSC Certified Forests by Ownership: October 2007 Certified Area – 1 622 196 ha (incl. planted & non-planted areas)
.")
81
Section 3 The Forest Products Industry

82
Number of Processing Plants by Type 2007 Total – 178 plants

83
Intake of Roundwood into Processing Plants 1980 to 2007 Total increase in intake over period- 8.7 million m 3 (78%) Biggest increase that of pulpwood- 9.7 million m 3 (229%)
 Biggest increase that of pulpwood- 9.7 million m 3 (229%)")
84
Intake of Roundwood into Processing Plants 2007 Total – 19.8 million m 3

85
Average Size of Plant by Intake 1980 vs. 2007 Overall average intake has increased by: - 141% Average intake of PP & Board Mills has increased by: - 98% Only average intake of MT Mills has declined – by- 13%

86
Sales of Certain Products from Processing Plants 1980 to 2007 Biggest increase that of chips- 4.4 million tons (823%) Only decrease that of mining timber- 1.2 million tons (71%)
 Only decrease that of mining timber- 1.2 million tons (71%)")
87
Value of Sales from Primary Processing Plants 2007 Total – R18.5 billion

88
Value of Sales from Primary Processing Plants 1980 to 2007 Nominal increase over period- R17.8 bn (2 549%) Real increase over period- R8.9 bn (93%)
 Real increase over period- R8.9 bn (93%)")
89
Contribution to GDP 1980 to 2007 Increase in Forestry GDP over period from 4.5% to 9.1% Decrease in For. Prod. GDP over period from 6.3% to 5.7%

90
Gross Value of Output Comparisons 1996, 2001 & 2007

91
Gross Value of Output Comparisons per Planted Hectare 1996, 2001 & 2007

92
Value Addition in Primary Processing Industry 2007 Note : excludes secondary processing (e.g. paper manufacturing)
.")
93
Value Addition Comparisons in Primary Processing Industry 2007 Note : Based only on input value of raw fibre (i.e. excludes all other input costs)
.")
94
Section 4 Contribution to Employment

95
Forest Sector Employment – RSA 2007 Sub-sector No. of employees Total Employment DirectIndirect Forestry76,84430,000106,844 Pulp and Paper 13,20010,78123,981 Sawmilling20,000n/a20,000 Timber Board 6,000n/a6,000 Mining Timber 2,200n/a2,200 Other11,000n/a11,000 Total129,24440,781170,025

96
Direct Employment in Forestry Industry by Province 2007 Total – 77,000

97
Direct Employment in Forestry Industry by Region 2007 Total estimated direct jobs in Industry – 77,000

98
Direct Employment in Forestry Industry as % of Those Employed in 2007 Total employed in RSA – 12.5 million

99
Indirect Employment in Forestry Industry by Province 2007 Total estimated indirect jobs created by Industry – 462,000

100
Indirect Employment in Forestry Industry as % of Those Employed in 2007 Total employed in Mpumalanga – 803,000

101
Direct & Indirect Jobs in Forestry Industry by Province 2007 Estimated total – 539,400 jobs

102
Total Employment in Industry as % of Those Employed in Formal Sector 2007 Total employed in Mpumalanga – 0.8 million

103
Dependents of Those Working in Forestry Industry by Region 2007 Estimated total – 1.7 million dependents 59,000

104
Total Number of People Dependent on Forestry Industry by Region 2007 Estimated total – 2.3 million livelihoods

105
Estimated % of Population Dependent on Forestry Industry 2007

106
Section 5 Investment in Sector

107
Investment in RSA Forestry Industry 2007 Total Investment - R17.4 Billion

108
Investment in RSA Forestry Industry 2007 Total Investment - R17.4 Billion

109
Investment in RSA Forestry Industry 2007 Total Investment - R17.4 Billion

110
Investment in Plantations – By Province Mpumalanga has highest investment - 41.6% of total

111
Investment in Mpumalanga Forestry 2007 Total Investment - R7.2 Billion

112
Investment in KZN Forestry 2006 Total Investment - R5.9 Billion

113
Investment in E. Cape Forestry 2007 Total Investment - R2.5 Billion

114
Investment in W. Cape Forestry 2007 Total Investment - R1.1 Billion

115
Investment in Limpopo Forestry 2007 Total Investment - R745 Million

116
Investment in Forest Products Sector by Type of Processing Plant 2007 Total Book Value of Investments - R15.8 Billion

117
Investment in Forest Products Sector by Investment Category 2007 Total Book Value of Investments - R15.8 Billion

118
Section 6 Contribution to GDP

119
Composition of RSA GDP 2007 Total GDP – R1 727 Billion

120
Contribution to GDP 1980 to 2007 Increase in Forestry GDP over period from 4.5% to 9.1% Decrease in For. Prod. GDP over period from 6.3% to 5.7%

121
Forestry vs. Other Agricultural GGP per Region 2007 Forestry in Mpumalanga of major importance

122
Forest Products vs. Other Manufacturing GGP per Region 2007

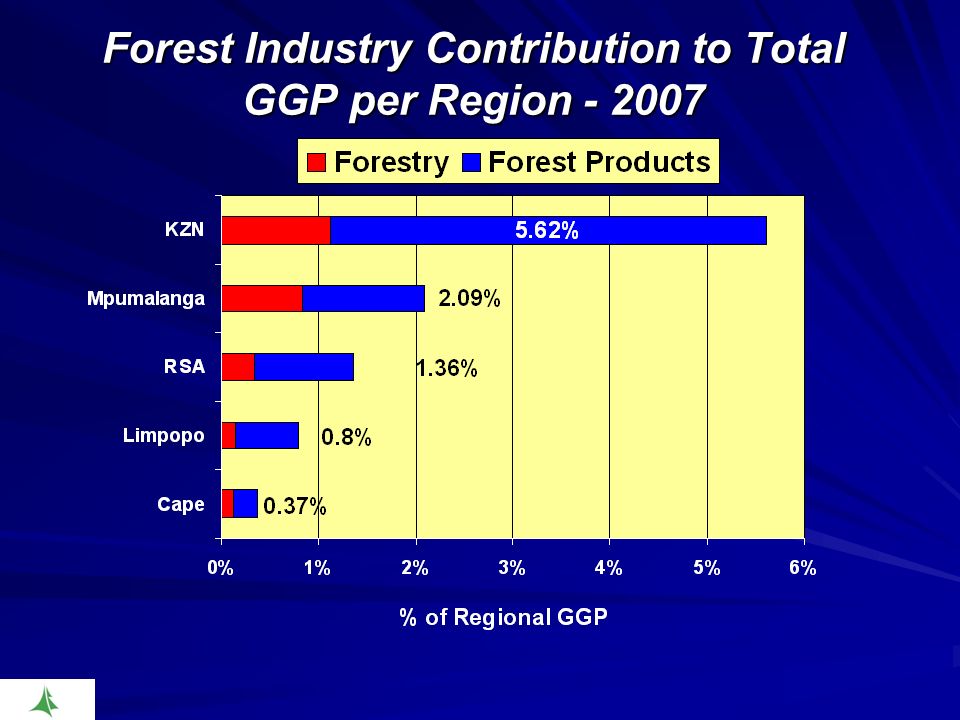
123
Forest Industry Contribution to Total GGP per Region - 2007

125
Gross Value of Output Comparisons 1996, 2001 & 2007

126
Gross Value of Output Comparisons per Planted Hectare 1996, 2001 & 2007

127
Section 7 Contribution to Foreign Trade

128
Forest Product Exports 2007 Total – R12.2 billion

129
Forest Product Imports 2007 Total – R9.8 billion

130
Trade Balance in Forest Products 1980 to 2007 (nominal) Increase in imports- R8.3 billion (589%) Increase in exports- R9.8 billion (421%) Increase in trade balance- R1.5 billion (164%)
 Increase in imports- R8.3 billion (589%) Increase in exports- R9.8 billion (421%) Increase in trade balance- R1.5 billion (164%)")
131
Trade Balance in Forest Products 1980 to 2007 (real) Increase in imports- R6.1 billion (168%) Increase in exports- R6.2 billion (103%) Increase in trade balance- R0.06 billion (3%)
 Increase in imports- R6.1 billion (168%) Increase in exports- R6.2 billion (103%) Increase in trade balance- R0.06 billion (3%)")
132
Export Comparisons 1996, 2001 & 2007

Similar presentations


 UNECE/FAO Forestry and Timber Section Geneva, Switzerland 16-19 October 2012.>")


 1965-801980-901990-98.>")

 Natural resources.>")


