Download presentation
Presentation is loading. Please wait.

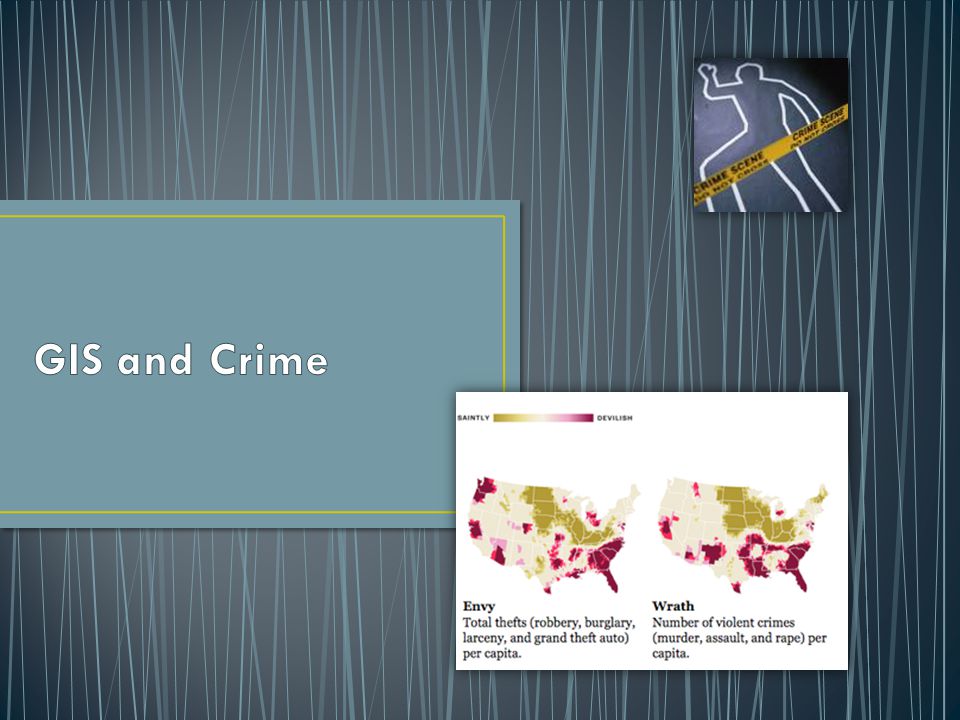
2
GIS helps crime analysis in many ways. The foremost use is to visualize crime occurrences. This allows law enforcement agencies to understand where crime is occurring as well as to determine if there are any spatial patterns. Therefore, GIS and crime mapping have the potential to improve the quality of life through the reduction of crime.

3
Depends on whom you speak to. One sub-discipline within criminology, environmental criminology, says yes.

4
Routine Activity Theory. Rational Choice Theory. Criminal Pattern Theory. Data clocks for burglary cases Hotspot mapping

5
Likely offender + suitable target – capable guardian = crime opportunity Center for Problem Oriented Policing The Crime Analysis Triangle Offender Target/ victim Problem Place

6
Routine activities theory is, as indicated by its name, based on the activities people, both offenders and victims, undertake on a routine basis: leave for school/work in the morning, lock up the store at night, go grocery shopping around lunch time, etc. At a general level, residential homes are burglarized during weekdays in the daytime, and commercial properties are burglarized during the weekend and nighttime hours. This theoretical framework also incorporates variables such as the presence of children, renting versus owning, married versus single, etc., to capture the activities of people. This highlights the temporal aspect of routine activities, but we also need to consider the spatial aspect.

7
If we are to assume that routine activities affect the time of the criminal event, we only need to look at those activities to see that they are spatial. Residential and commercial areas are not randomly located, different areas have different magnitudes of renting/owning, age composition of the resident population, etc. Assuming that socio-demographic and socio-economic characteristics of people are not random across space, then routine activities are also not random across space.

9
Brantingham and Brantingham (1991) discuss nodes of activity. These nodes are our places or residence, work/school, and leisure. Criminal victimization may occur at these nodes, or along the paths connecting them. Transportation cultures greatly affect the spatial distribution of criminal victimization. In a "walking culture" where people work and live closely, there may be a lot of criminal activity occurring between the nodes, but in a "car culture" such as living in the suburbs and working downtown, criminal victimization will occur primarily at the nodes.

10
gym home work friends shops Crime Activity

11
Most offenders make a (fairly) rational decision to commit an offence. What are the rewards against the chances of getting caught? The rewards and likelihood of capture vary by time and place.

12
Offenders are influenced by the daily activities and routines of their lives. They will tend to concentrate in areas that are known to them. In their day-to-day activities, they will be watching for targets that have no guardians or place managers.

13
While routine activity theory gives us a model to predict if a crime has all the right ingredients to occur, and rational choice theory gives us some insight into what an offender is thinking when they decide to commit the crime, criminal pattern theory helps us understand where and when the offence will occur.

14
Environmental criminology would be of little interest - either to scholars or those concerned with criminal policy - if the geographical distribution of offences, or of victimisation or offender residence, were random. In fact, this is very far from being the case, and the geographical concentration of crime and criminality parallels other skews in criminological data (for example, the fact that a relatively small number of persistent offenders commit a very disproportionate number of crimes).
..")
15
Traditionally, the two central concerns of environmental criminology have been explaining the spatial distribution of offences and explaining the spatial distribution of offenders.

16
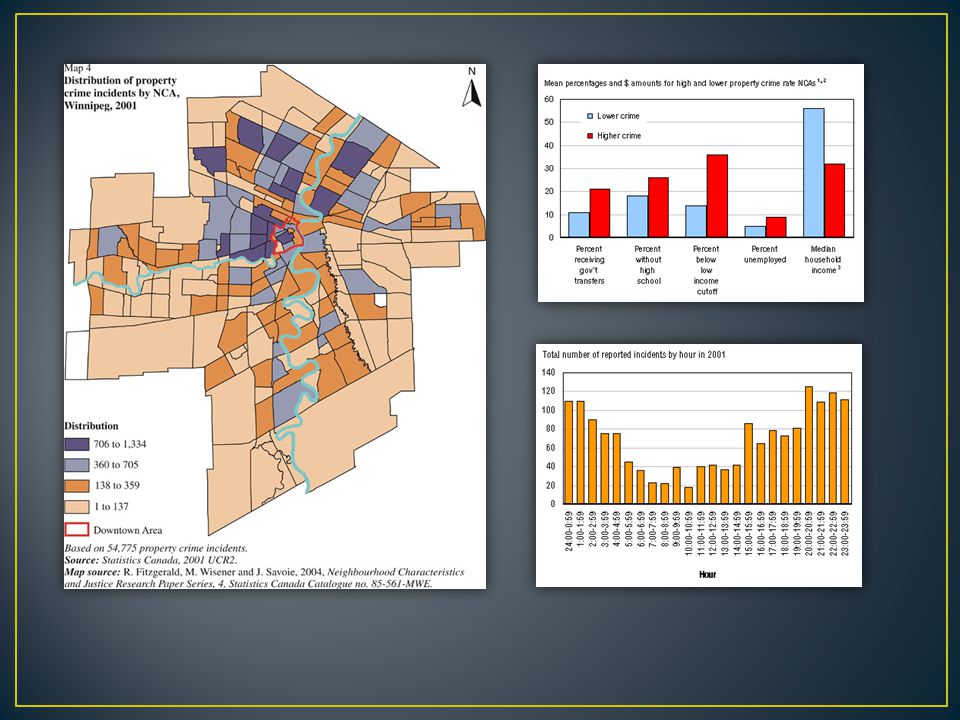
Crimes are human phenomena; therefore, their distribution across space is not random. Several factors, from the lure of potential targets to simple geographic convenience for an offender, influence where criminal events occur. Therefore, an understanding of where and why crimes occur can improve attempts to fight crime.

17
80,000 property crimes committed in Vancouver in 1996 assigned to the closest street address. The geographic pattern is obvious, even though roads per se aren't part of this map. [A more recent map.]A more recent map Homicides in Greater VancouverGreater

18
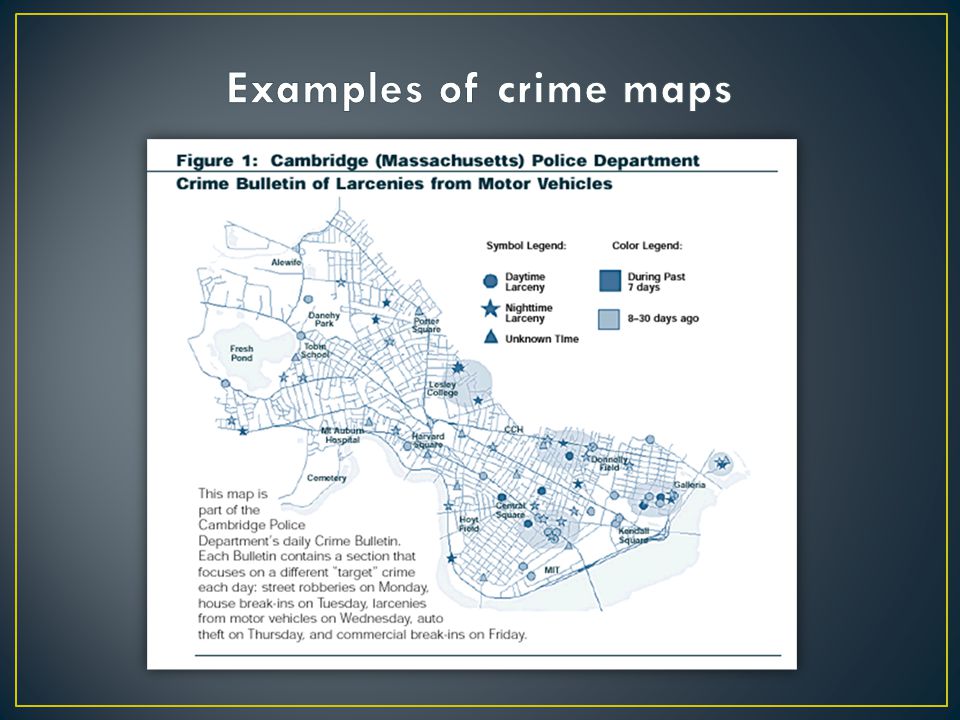
In the law enforcement field, increases in the number of calls for police service (currently over 30,000 per month in Vancouver), and in crime in general, have led to a greater need to sort, organize, analyze, and disseminate data. As a result, criminal justice agencies have been turning to GIS. The previous map, displaying over 80,000 calls for service on property crime, could not have feasibly been done on paper.

19
The inclusion of roads, bus routes, bus stops, and rapid transit is easily done in a GIS, making network analysis of crime possible on levels not possible before. Using GIS, Paul and Patricia Brantingham of SFU Criminology have shown that Skytrain routes and MacDonald's restaurants in Vancouver are hotspots for crime. The use of layers in a GIS allows the criminal investigator to easily add/remove data to the analysis.

20
Geographic profiling is an method of studying crime that uses the geographic locations of serial criminal offences to determine the most probable neighbourhood in which the serial offender resides. This technique is most often applied to cases of serial murder, sexual assault, arson, and robbery. Geographic profiling uses the combination of geographic crime site information and the known propensities of serial criminals in their selection of a target victim and location. The output of the procedure will be a map representing the probability density of the offender's place of residence.

21
One of the common misperceptions of geographic profiling is that it is used to actually solve criminal events, when it is simply a tool. This tool, however, is quite powerful. By using the geographic nature of serial criminal events and known offender residences, detectives can narrow their search to the most probable offender. If the serial offender is "new", geographic profiling narrows the area that detectives need to monitor.

22
Offenders, in general, do not want to commit a crime too close to home. They wish to distance the crime they commit from their home in order to deceive police. They also, however, like to commit crimes in areas that are familiar to them: escape routes need to be known. Crudely put, the offender places a buffer around their residence and then chooses their target using a distance decay function such as the gravity model.

23
Research has theorized that when offenders travel to commit crimes (called commuters) that they often travel to neighborhoods/areas that are similar to those that they live in. (Marauders commit crimes in their own neighbourhoods.) Research has shown that burglars will commit crimes in neighborhoods similar to their own so that they will fit in and not look out of place when they look for victims. Question: Do offenders commit crimes in neighborhoods that are similar to ones they live in, and can this information be used to help focus profile results?
 Research has shown that burglars will commit crimes in neighborhoods similar to their own so that they will fit in and not look out of place when they look for victims. Question: Do offenders commit crimes in neighborhoods that are similar to ones they live in, and can this information be used to help focus profile results .")
24
Commuter Marauder 87% of serial sexual offenders were found to be Marauders Commuter - Street Offences 26% Marauder - Convenience Stores 18%, Other Shops 25%, Service (GAS) Stations 17%
 Stations 17%")
25
Crime follows a geographic pattern. Since there is a pattern to criminal events, we have the ability to model and, possibly, predict crime--so, we need a tool that can incorporate both spatial and attribute data on criminal events. GIS is such a tool. Using this tool we can identify problem areas, produce maps for officers to use in the field, keep track of particular offenders, and assist in solving crimes.

26
The qualitative and quantitative study of crime and law enforcement information in combination with socio- demographic and spatial factors to apprehend criminals, prevent crime, reduce disorder, and evaluate organizational procedures.

27
Intelligence analysis: the study of 'organized' criminal activity in order to assist investigative personnel in linking people, events and property. Criminal investigative analysis: the study of serial criminals, victims and / or crime scenes as well as physical, socio-economic, psychological, and geographic characteristics to develop patterns that will assist in liking together and solving current serial criminal activities (aka profiling).
..")
28
Tactical crime analysis: the study of recent criminal incidents and potential criminal activity by examining characteristics such as how, when, and where the activity has occurred in order to assist in problem solving by developing patterns and trends, identifying leads / suspects, and clearing cases. Strategic crime analysis: the study of crime and law enforcement information integrated with socio- economic and spatial factors to determine long term 'patterns' of activity, to assist in problem solving, as well as to research and evaluate responses and procedures.

29
Administrative crime analysis: the presentation of interesting findings of crime research and analysis based on legal, political, and practical concerns to inform audiences within law enforcement administration, city government, and citizens.

30
Administrative CA Strategic CA Tactical CA Investigative and Criminal Investigative Analysis High Low Level of Aggregation

31
Early 1800’sSocial Theorists: Single symbol point and graduated area maps 1900’sNew York City Police Department and others: Single symbol point maps, “pin maps” 1920-30’sUrban sociologists at the University of Chicago: Graduated area maps of crime and delinquency 1960-60’sFirst computer-generated maps of crime 1980’sDesktop computers available for (limited quality) mapping; Environmental Criminology Theory 1990’sDesktop GIS and integration with law enforcement systems and data; government funding, etc.
 mapping; Environmental Criminology Theory 1990’sDesktop GIS and integration with law enforcement systems and data; government funding, etc.")
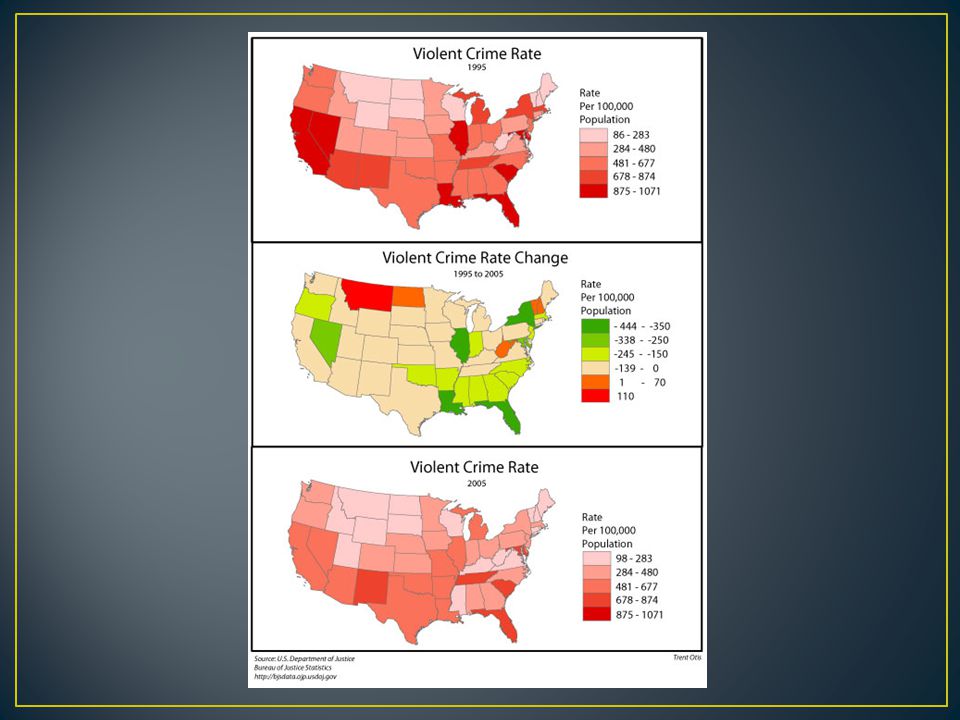
34
1999 crime data national violent crime rates 1999 crime data crime at the county level in Massachusetts 2000 crime data violent crime rates at the city level

35
Heroin arrests are the green / darker symbols.

36
Kernel smoothing hot spot analysis High Low

38
The CIA is using Geographic Information System (GIS) technologies to integrate counter-narcotics field operation information related to Plan Colombia (e.g., eradication spraying areas, locations of raided coca labs, hostile fire on aircraft, etc.)
 technologies to integrate counter-narcotics field operation information related to Plan Colombia (e.g., eradication spraying areas, locations of raided coca labs, hostile fire on aircraft, etc.)")
40
http://gawker.com/news/fiddling-with-the-kiddies/how-many-child-molesters-live-near-your-harry-potter-party-280622.php The little white boxes with the x's are just schools, don't be alarmed. The red boxes are where the folks who offend against children live; yellow and white are rapists; blues are for the sexual batterers, and green are "other offenses."

41
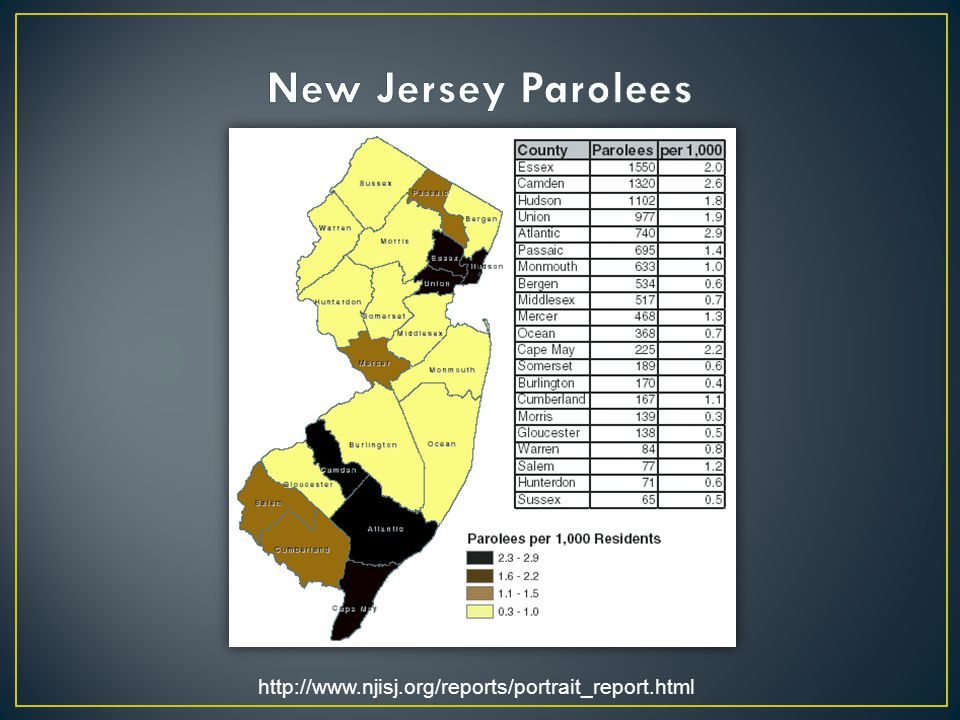
http://www.njisj.org/reports/portrait_report.html
42
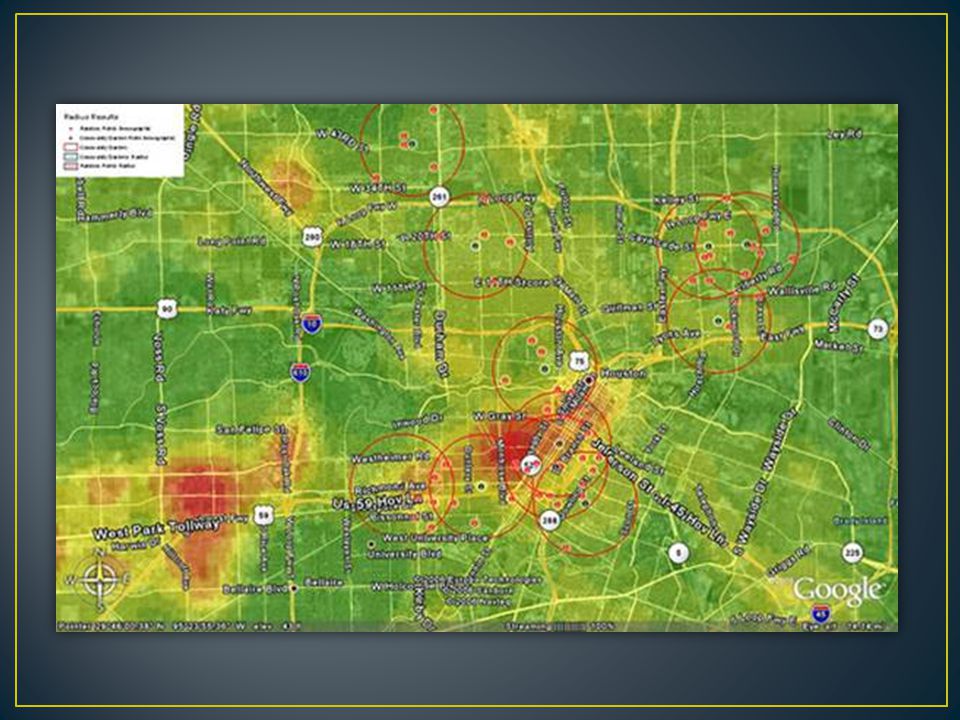
Using our geocoded crime data for Houston, a series of raster grids were created by crime type using Spatial Analyst with a ¼ mile grid size. We then symbolized the resulting grid surface in ArcGIS and exported as an image overlay (KML) using Arc2Earth. Here is an example of the resulting Google Earth format crime heat-maps. This particular map shows burglary hot spots for the City of Houston in relation to community garden locations surrounded by a 2 mile radius (circles). http://www.geospatialtraining.com/Newsletter/CrimeAnalysis/CrimeAnalysis.htm
 using Arc2Earth. Here is an example of the resulting Google Earth format crime heat-maps. This particular map shows burglary hot spots for the City of Houston in relation to community garden locations surrounded by a 2 mile radius (circles).")
44
http://www.usa-software.com/crimeview-usa.shtml
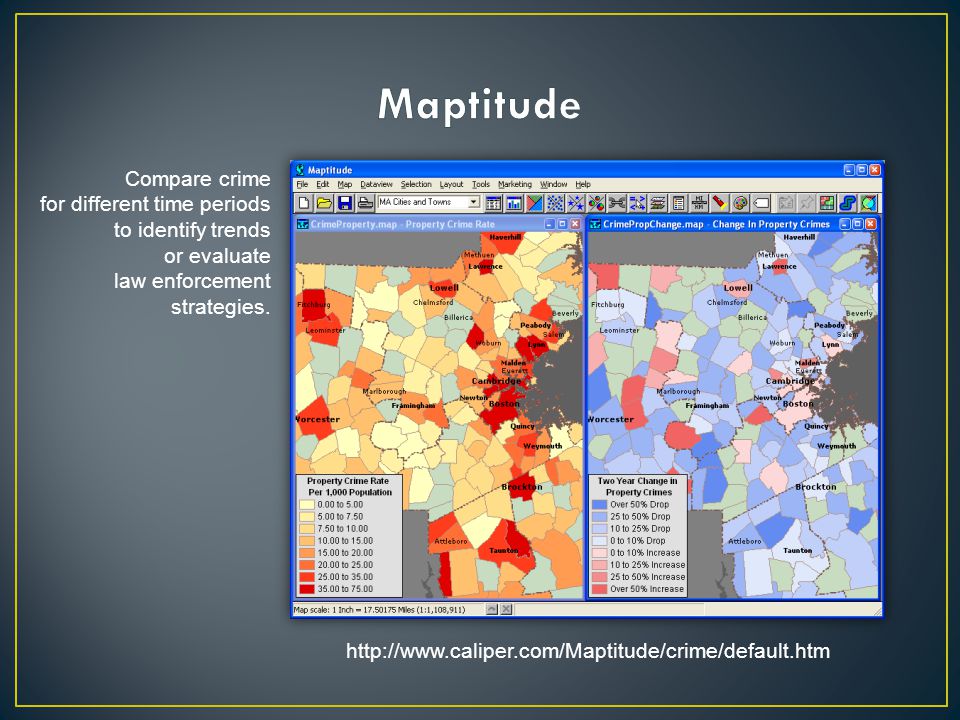
45
Compare crime for different time periods to identify trends or evaluate law enforcement strategies. http://www.caliper.com/Maptitude/crime/default.htm
46
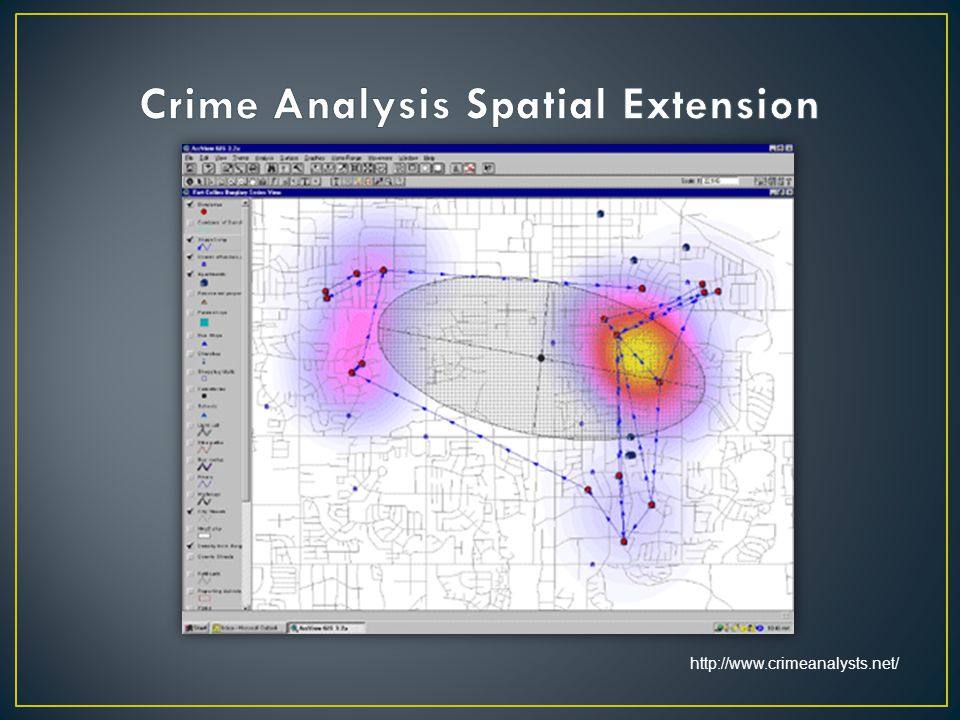
The Crime Analysis Spatial Extension (CASE) represents a continuation over the terrific utilities provided by the earlier Animal Movements Extension developed by the US Geological Survey. This first release contains the tools most often used by crime analysts; subsequent releases will offer more tools as time goes by. While the original extension was developed by biologists and had to be “adapted” for use by crime analysts, these tools have been optimized for use by crime analysts, and contain some refinements that make them easily incorporated into an analytical process. Spider Diagram; Nearest Neighbor; Study Area; Standard Deviation Ellipse; Sequencing; Minimum Convex Polygon; Point to Point Link

47
http://www.crimeanalysts.net/
48
GIS has now become integrated in all aspects of policing—from tracking serial criminals to mapping hotspots to managing Departmental resources. The use of GIS and other geospatial technologies will only increase as the world becomes ever-more geospatially-enabled.

Similar presentations


>")


