Download presentation
Presentation is loading. Please wait.

1
Forecasting & Planning

2
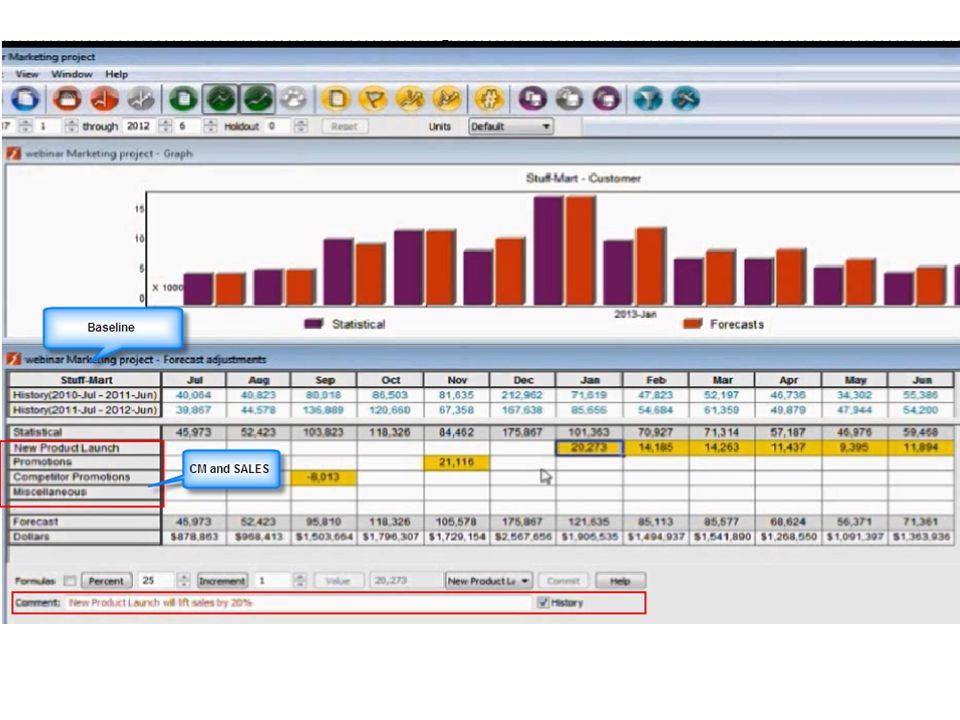
Overall Responsibilities I work within the newly acquired SciED VWR. The product line is a mix of stocked, drop ship, purchase on demand, Manufactured/ Buy Sell items. The goal is to predict inventory levels and sales from history and maintain On time delivery on SKUs Generate a statistical aggregate forecast ( with seasonality and trend, monthly ) and build on it with domain knowledge from CM and SALES, weighted measures from consensus meetings and generate the final plan Follow the APO format for Demand planning for ease of migration during GO LIVE phase. Communicate changes and chair meetings to address forecast accuracy, Changes to Aggregate plan ( Outside 90 days – S&OP), Capacity meetings, Purchasing Open PO exceptions, MFG alert meeting. Only Planner with manufactured items ( So added complexity of capacity planning, BOMS, Routings, Stable schedule, longer frozen window, Level demand plan to match supply capabilities etc )
 and build on it with domain knowledge from CM and SALES, weighted measures from consensus meetings and generate the final plan Follow the APO format for Demand planning for ease of migration during GO LIVE phase. Communicate changes and chair meetings to address forecast accuracy, Changes to Aggregate plan ( Outside 90 days – S&OP), Capacity meetings, Purchasing Open PO exceptions, MFG alert meeting. Only Planner with manufactured items ( So added complexity of capacity planning, BOMS, Routings, Stable schedule, longer frozen window, Level demand plan to match supply capabilities etc ).")
3
Process Understanding the business is key factor, knowing which new products are introduced, as well as dying products. Forecast a breadth of SKUs by portfolio and created forecasting profiles by aggregating the historic sales. The data is maintained SM30 TABLES /excel with.net front end to display dashboard in S&OP( so not fully utilizing SAP’s forecasting powers like AUTO model selection, ) Add CM and sales inputs to form the final forecast, Get management approval ( Dashboard in Dollars) From that unconstrained demand forecast we create a constrained disaggregated plan, Disaggregate using product mix predictions, Sales forecasts ( ABC and other heuristics) Matching supply to demand. Working with warehouse supervisors, procurement and the WH manager. In many cases demand outstrips supply, requiring us to either to lower their unconstrained demand forecast or to incur additional costs to increase supply. Main tools : Capacity planning tool, MFG Dashboard, Open PO, Exception report Normally, in order to increase supply on make items, expediting using traffic lights we would add manufacturing shifts or introduce subcontracting ( I do the analysis using ROUTING files tied back to Demand numbers, with variance in routing times)
 Add CM and sales inputs to form the final forecast, Get management approval ( Dashboard in Dollars) From that unconstrained demand forecast we create a constrained disaggregated plan, Disaggregate using product mix predictions, Sales forecasts ( ABC and other heuristics) Matching supply to demand. Working with warehouse supervisors, procurement and the WH manager. In many cases demand outstrips supply, requiring us to either to lower their unconstrained demand forecast or to incur additional costs to increase supply. Main tools : Capacity planning tool, MFG Dashboard, Open PO, Exception report Normally, in order to increase supply on make items, expediting using traffic lights we would add manufacturing shifts or introduce subcontracting ( I do the analysis using ROUTING files tied back to Demand numbers, with variance in routing times).")
4
Models N -Moving average,Smoothed/ Deseasonalized and run regression ( StatPRO/ Solver) for TREND. Output 12 months aggregate by Family. Lot of data scrubbing, Outlier detection in ACCESS using 1 year sales and +/- 3 stdev Protect forecast : Use rules for exception demand filter in SAP ( blocks sales orders) Liferay to consolidate all communication between Sales manager, MFG team and the executive team.
 Liferay to consolidate all communication between Sales manager, MFG team and the executive team..")
5
Error (calculated quarterly by SKU) Separate measures for LOW volume vs HIGH volume, based on ABC MAPE ( Mean percent error) to compare performance across product categories for hig movers. Target 15% Achieved 17% But it is scale sensitive, so for low volume data we use MAD/Mean ratio to assess Some products very expensive, cost of inaccuracy ( Not forecasted and maintain service level agreements with vendors and close ties to customers)
.")
7
Achieving a consensus forecast These forecasts usually start with a baseline statistical forecast, to which domain knowledge is added through manual overrides ( CM forecast, Sales rep forecast, management ) The goal is to achieve a demand plan with consensus, that is executable. (optimistic yet within constraints) Currently looking to add weighted consensus demand forecast to the tool based on each department’s forecast accuracy over time. Working with APO planning books in the test environment to get ready for APO and evaluate product groups to migrate into APO and what master data they need.
 Currently looking to add weighted consensus demand forecast to the tool based on each department’s forecast accuracy over time. Working with APO planning books in the test environment to get ready for APO and evaluate product groups to migrate into APO and what master data they need..")
8
Analytics super user QLIKVIEW for reports, LIFERAY for communication/ Collaboration, SAP to drive reports. Utilizing SQVI to make custom reports in SAP ( performs joins and pulls data together directly in SAP, just like ACCESS) Currently managing 5-10 different TnRs with global IS team ( Requirement mapping, communicate expected program changes in three main programs (Qlikview, LIFERAY and SAP)
 Currently managing 5-10 different TnRs with global IS team ( Requirement mapping, communicate expected program changes in three main programs (Qlikview, LIFERAY and SAP).")
9
Calculate static safety stocks using Come a long way from (1/2 LT rule) Quarterly analysis, Same time as lead time variance analysis and lead times are adjusted Z score : Z score is set independently based on criteria like strategic importance (ABC or new prospective business), profit margin and dollar volume and hence desired service level Safety stock = Z*σ LT *D AVG *Assumption that demand is stable during LT *Any suppliers with too much noise in the LT and variability are not counted ( plug numbers)
 Quarterly analysis, Same time as lead time variance analysis and lead times are adjusted Z score : Z score is set independently based on criteria like strategic importance (ABC or new prospective business), profit margin and dollar volume and hence desired service level Safety stock = Z*σ LT *D AVG *Assumption that demand is stable during LT *Any suppliers with too much noise in the LT and variability are not counted ( plug numbers)")
10
Production “Uniqueness” Service level on components needs to exponentially greater than finished product as components arrive independently Adding Safety lead time and safety stock to overseas items (get management approval on dollars) Conduct a BOM prevalence score (ABC Components) Trick is there is no forecast on components, Create ‘Planned order history’ file and conduct statistical safety stock on LT ( demand variable) Reduced risk of stock outs and achieved ON TIME delivery on the biggest product lines this year ( +/- 2 weeks) Investment in strategic purchase, Lowest of any year so far, won the “Innovation award for 2014” Created a repeatable process for the business
 Conduct a BOM prevalence score (ABC Components) Trick is there is no forecast on components, Create ‘Planned order history’ file and conduct statistical safety stock on LT ( demand variable) Reduced risk of stock outs and achieved ON TIME delivery on the biggest product lines this year ( +/- 2 weeks) Investment in strategic purchase, Lowest of any year so far, won the Innovation award for 2014 Created a repeatable process for the business")
11
Metrics Actual Delivery Date Vs Requested Delivery Date. (85-95%) Schedule Attainment MAPE / MAD : Quarterly Adjust Safety stocks depending on tracking signal/ MAD Goal is to make it visible that we are bringing in the right products and taking a hard look at the slow/ dying products ( Challenge is to get CM to reduce breadth here)
 Schedule Attainment MAPE / MAD : Quarterly Adjust Safety stocks depending on tracking signal/ MAD Goal is to make it visible that we are bringing in the right products and taking a hard look at the slow/ dying products ( Challenge is to get CM to reduce breadth here).")
13
Answers I provide How are the product families performing ? – Highest level aggregated in Dollars – Plan vs actual sales, MAPE error % Manufacturing Schedule and predicted shipments for big customers Backorder report (ABC items), Shipment forecast and capacity constraints. Has anything changed ? – Plan changes outside/ inside the frozen window – Forecast changes inputs – New business opportunities ? ( International orders, Turkey X dock and one time business opportunities)
, Shipment forecast and capacity constraints. Has anything changed . – Plan changes outside/ inside the frozen window – Forecast changes inputs – New business opportunities . ( International orders, Turkey X dock and one time business opportunities).")
Similar presentations


>")

 is a computer-based inventory management system designed to assist production managers in.>")


 Assistant Professor CTI Office: Room 735 CTI 7th Floor Phone: 312-362-8231 Fax:>")
>")
>")

