Download presentation
Presentation is loading. Please wait.

1
Department of Public Works Bureau of Street Services Cynthia M. Ruiz President Department of Public Works

2
PROFESSOR POTHOLE PRESENTS Everything You Always Wanted To Know About Streets, Trees and Sidewalks William A. Robertson Director Bureau of Street Services Rev. Oct 2008

3
HOW BIG IS LOS ANGELES?

4
6,500 Centerline Miles 28,000 Lane Miles CITY OF LOS ANGELES Largest municipal street system in the United States 69,507 Segments

5
THE STREET SYSTEM

6
Current Condition Assessment 6,500 miles street system 800 miles of alleys Approximately 1,000 miles of failed streets Overall system condition is a C-

7
How Did We Get In This Mess? Prior to World War II the City was comprised of approximately 2,500 miles of paved streets and the Annual Resurfacing Program (ARP) consisted of 50 miles. After World War II, and the rapid growth of the San Fernando Valley the street system grew to 6,500 miles. Up until 1986, the ARP still consisted of only 50 miles of resurfacing. From 1987 to the early 1990’s, the ARP was increased to approximately 150 miles. Fiscal Year 1994-95, the Bureau was funded for its first 200 mile ARP. This year the ARP is funded at 235 miles.
 consisted of 50 miles. After World War II, and the rapid growth of the San Fernando Valley the street system grew to 6,500 miles. Up until 1986, the ARP still consisted of only 50 miles of resurfacing. From 1987 to the early 1990’s, the ARP was increased to approximately 150 miles. Fiscal Year , the Bureau was funded for its first 200 mile ARP. This year the ARP is funded at 235 miles..")
8
HOW DO WE FIX THIS MESS?

9
10 Year Plan Maintenance –Slurry Seal –Crack Seal –Pothole Repairs Rehabilitation –Overlays –Resurfacing –Reconstruction $35 Million for Maintenance $115 Million for Rehabilitation

11
ANNUAL RESURFACING PROGRAM

12
Budget Allocation Formula Old Method Total Maintained Centerline Miles in CD Council District = x 100% AllocationTotal Maintained Centerline Miles Citywide

13
Budget Allocation Formula Current Method Three factors are contemplated in the BAF Pavement Condition: The condition factor is included to address the need for Pavement, Resurfacing or Reconstruction due to deteriorated conditions in a particular district and to take into account user comfort. Pavement Area: The area factor is considered due to the varying size of the pavement areas (or lane miles) in the different Council Districts. Bus/Truck Traffic: The bus/truck traffic factor is included to address the effects of buses/trucks traffic factor on increase pavement thickness and consequently on the cost of resurfacing or reconstruction.
 in the different Council Districts. Bus/Truck Traffic: The bus/truck traffic factor is included to address the effects of buses/trucks traffic factor on increase pavement thickness and consequently on the cost of resurfacing or reconstruction..")
14
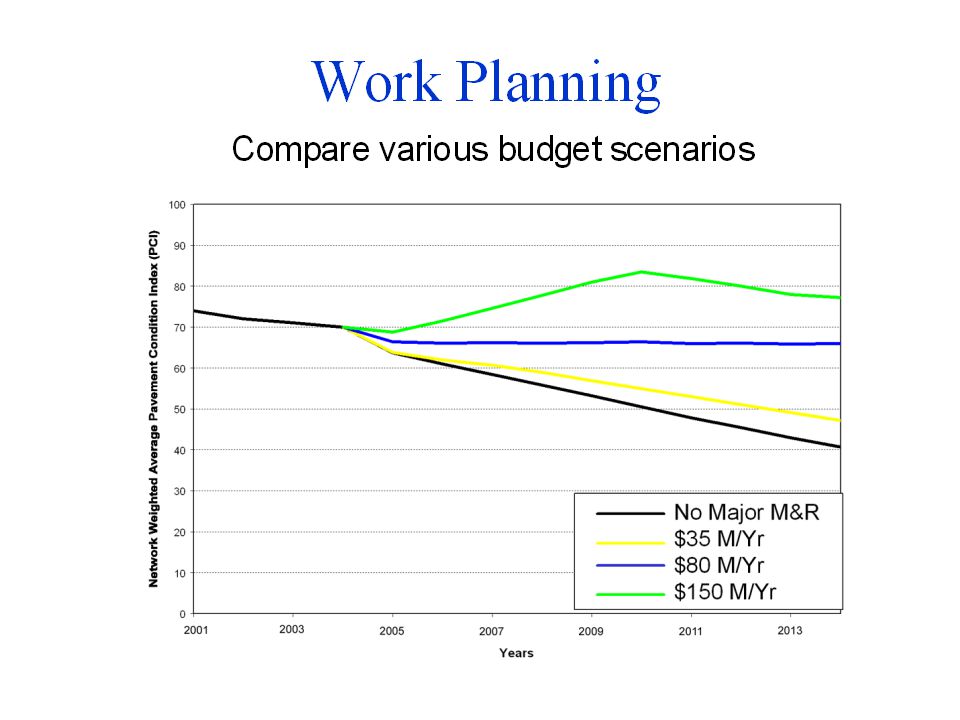
How Are Streets Selected? Street selection for the Annual Resurfacing Program is based on the Bureau’s Pavement Management System: –Defines the existing condition of streets. –Determines the most economical maintenance and rehabilitation strategy. –Predicts future condition of the street network based on different budget scenarios.

15
Funding Sources 2008-2009 Annual Resurfacing Program Gas Tax $31,225,703 Proposition C 11,089,626 General Fund 2,509,848 Surface Transportation Program Fund 11,295,606 Prop 1B 27,900,000 $84,020,783

16
Why Don’t We Fix The Worst Streets First? 80/20 Allocation Plan 80% Overlays/Resurfacing 20% Reconstruction Spending more in reconstruction or using a “worst first” strategy would greatly reduce the number of streets resurfaced and cause an acceleration in the decline of the overall condition of the street system.

17
Typically 20% of the budget is allocated towards failed streets. ExcellentGoodFairPoor Failed Slurry Overlay ACDF 20% 80% $1$2$4$7 * * of the budget allocation. B MicroPaver Budget Allocation

18
PAVEMENT MANAGEMENT PROGRAM

19
Benefits of a Modern Pavement Management System Justifies different funding level requests. Provides information to make efficient use of available resources. Produces quantified and accurate information. Tracks pavement performance. Identifies current and future maintenance & rehabilitation (M&R) needs. Selects cost-effective repair strategies. Predicts future pavement condition based on different budget scenarios.
 needs. Selects cost-effective repair strategies. Predicts future pavement condition based on different budget scenarios..")
20
Micro PAVER A Pavement Management System developed by the US Army Corps of Engineers, Champaign, IL. Adopted by: –The Federal Aviation Administration (FAA) –Federal Highway Administration (FHWA) –US Army –US Air Force –US Navy
 –Federal Highway Administration (FHWA) –US Army –US Air Force –US Navy.")
21
Condition Analysis Pavement Condition Index (PCI) Excellent Very Good Good Fair Poor Very Poor Failed 100 85 70 55 40 25 10 0 PCI Distress Severity Distress Quantity Distress Type 100 85 70 55 40 25 10 0 ASPCC
 Excellent Very Good Good Fair Poor Very Poor Failed PCI Distress Severity Distress Quantity Distress Type ASPCC")
22
Condition Prediction Modeling

23
Condition Prediction San Pedro St 18 th St to Washington Bl PCI: 51 07/12/04 Grand Av Olympic Bl to 11 th St PCI: 71 07/12/04

24
Maintenance and Rehabilitation (M&R) Work Planning Maintenance Rehabilitation Pothole Repairs Crack Sealing Slurry Sealing Overlays Resurfacing Reconstruction
 Work Planning Maintenance Rehabilitation Pothole Repairs Crack Sealing Slurry Sealing Overlays Resurfacing Reconstruction")
25
Pavements need to be managed, not simply maintained. Why Use Pavement Management?

28
PRESERVATION OF THE STREET SYSTEM

29
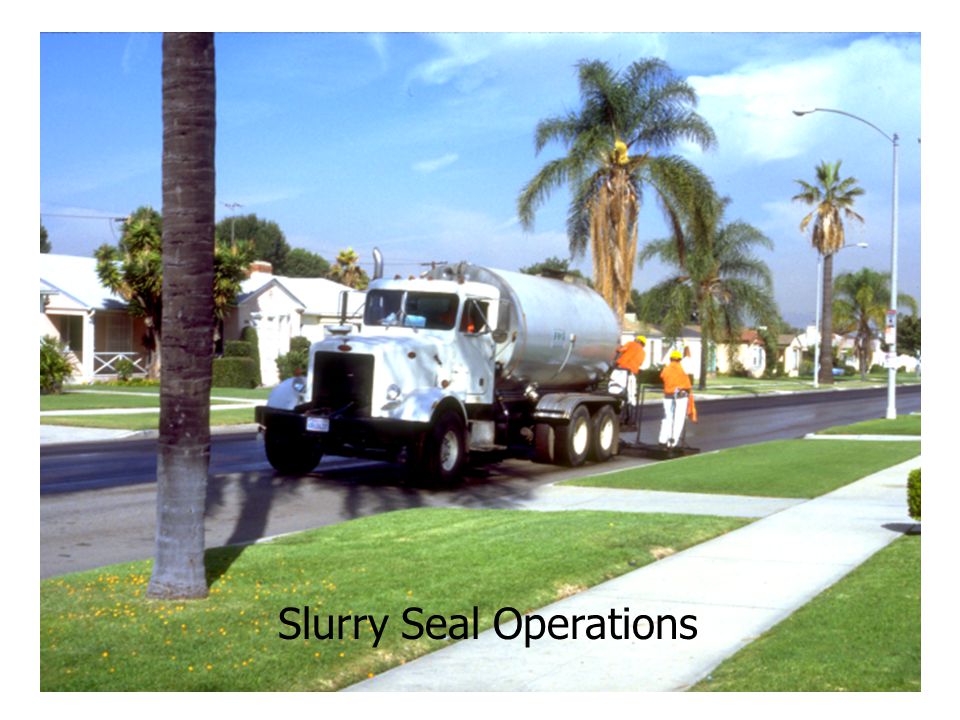
Rubberized Slurry Seal An emulsion mixture of oil, rubber, and fine sand. A preservative application (sealant) that: –Inhibits oxidation of the oils from the pavement. –Deters asphalt cracking. –Prevents water from seeping into the sub-base. –Extends the streets serviceable life, thereby reducing the need for repaving.
 that: –Inhibits oxidation of the oils from the pavement. –Deters asphalt cracking. –Prevents water from seeping into the sub-base. –Extends the streets serviceable life, thereby reducing the need for repaving..")
30
Slurry Seal Operations

32
Fresh, clean, and new appearance for neighborhoods.

33
25,935 Waste Tires are recycled for every 100 miles of streets slurry sealed. Environmental Benefits Reduction in dust and noise pollution. Eliminates noxious odors during on-site mixing of materials.

34
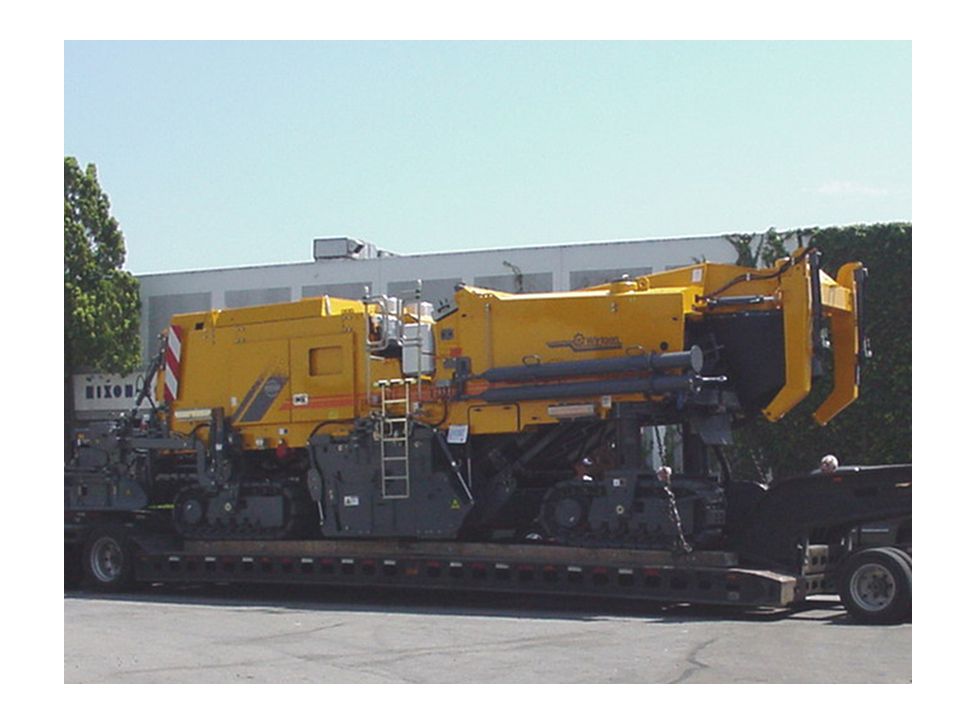
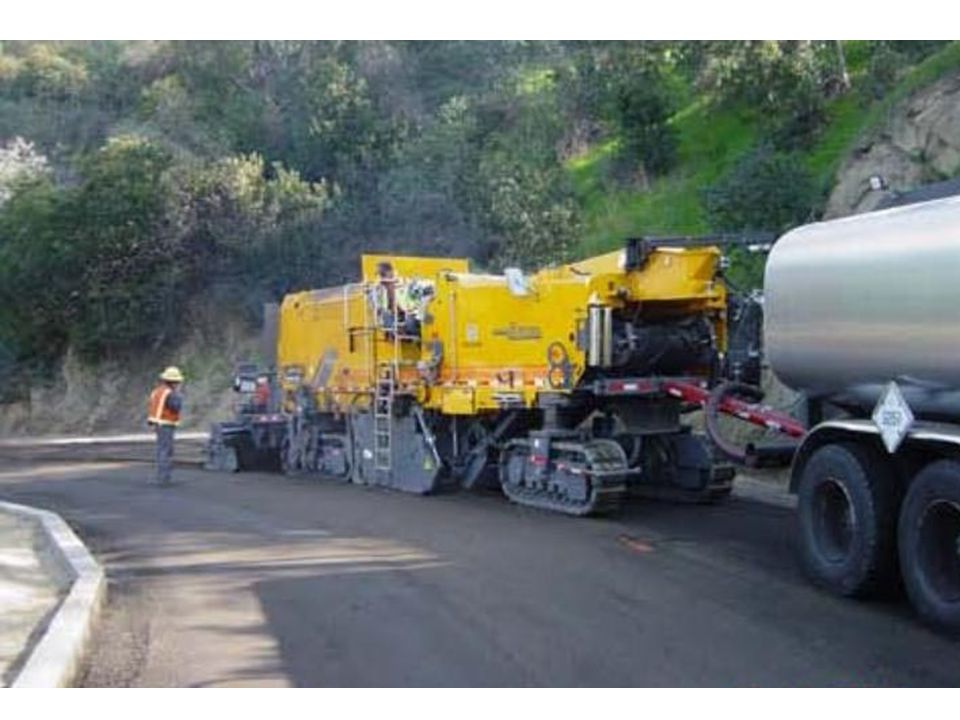
Innovations In Asphalt Technology Cold In-Place Recycling – The key to addressing failed streets in our neighborhoods. 25% to 35% more cost effective than conventional reconstruction. Less invasive to local neighborhoods.

40
Pavement Preservation What Have We Gained? Pavement Preservation Program has grown from 310 miles in 2002 to 735 miles in 2008… 137 percent increase. Ten million dollars allocated to rebuild the Metro Asphalt Plant to run a 50-50 recycled mix. For the first time since World War II the overall street system’s PCI will not decline.

41
SIDEWALK REPAIR PROGRAM

42
Historical Look At The City’s Sidewalk Policy The State of California Improvement Act of 1911 provides cities the authority to require property owners to effect repairs to sidewalks abutting their property (California Streets and Highways Code). Should the property owner fail to effect such repairs, city forces are authorized to make the repairs and the property owner is assessed for the cost. However the Los Angeles Municipal Code (Section 62.104, Ordinance No. 146,040 effective July 3, 1974) exempts homeowners from the responsibility for sidewalk repairs caused by tree root growth and places responsibility for these repairs with the City. The Bureau encourages property owners to effect voluntary repairs through the issuance of a no-fee “Class A” permit.
 exempts homeowners from the responsibility for sidewalk repairs caused by tree root growth and places responsibility for these repairs with the City. The Bureau encourages property owners to effect voluntary repairs through the issuance of a no-fee Class A permit..")
43
Historical Between 1978 to 2000, no full scale permanent sidewalk repair program existed in the City. In the interest of public safety, the Bureau made repairs with asphalt at no direct cost to the property owner. For the first time in 25 years, a budget was approved in the 2000-2001 budget for approximately $9 million to permanently repair 46 miles of the most damaged sidewalks. In 2001-2002, the Sidewalk Repair Program was again funded and increased to repair an additional 98 miles of sidewalks Fiscal Year 2002-2003, the Mayor and City Council increased the program by 20 miles to a total of 118 miles.

44
Criteria For Sidewalk Repair Areas where slip, trip and fall accidents have occurred. Where tree roots have raised the sidewalks within American with Disabilities Act “transition areas”, as determined by the Department of Disability. Where paths of travel issues exist in conjunction with access ramp construction. In low and moderate income census tract areas.

45
Sidewalk Repair Options Grind Sidewalks Meander Sidewalks Enlarged Tree Well Reduce Sidewalk Width Rubberized Pavers Pour-in-Place Rubberized Sidewalk Sidewalk Ramping

46
Sidewalk Grinding

47
Meandering Sidewalk

48
Enlarged Tree Well

49
Reduced Sidewalk

50
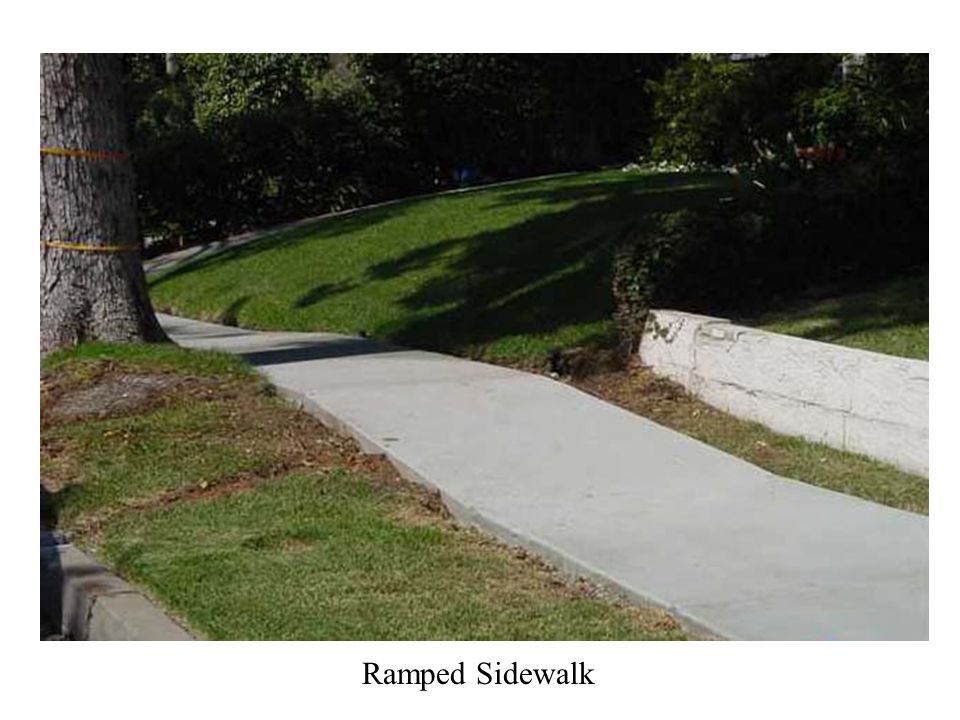
Ramped Sidewalk

52
Poured-in-Place Rubberized Sidewalk Rubberized Pavers

53
That’s my story and I’m sticking to it!

Similar presentations


 Presented to Council March 1, 2010 Ambaum Blvd SW & SW 134 th St. S 181 st btwn 4 th & 5 th Ave S SW 158.>")


