Download presentation
Presentation is loading. Please wait.

1
F INANCIAL S TATEMENTS ANALYSIS

2
Financial Statement Analysis Who analyzes financial statements? – Internal users i.e., Management, Shareholders, Internal auditors, Budget Analyst, – External users Examples? Investors, creditors, regulatory agencies & … stock market analysts, Business analysts, Financial Analyst, Investment Analyst and auditors

3
Financial Statement Analysis What do internal users use it for? Planning, evaluating and controlling company operations What do external users use it for? Assessing past performance and current financial position and making predictions about the future profitability and solvency of the company as well as evaluating the effectiveness of management

4
Financial Statement Analysis Information is available from – Published annual reports (1)Financial statements (2)Notes to financial statements (3)Letters to stockholders (4)Auditor’s report (Independent accountants) (5)Management’s discussion and analysis – Reports filed with the government Taxation Department, SECP.
Financial statements (2)Notes to financial statements (3)Letters to stockholders (4)Auditor’s report (Independent accountants) (5)Management’s discussion and analysis – Reports filed with the government Taxation Department, SECP.")
5
Financial Statement Analysis Information is available from – Other sources (1)Newspapers (e.g., The News) (2)Periodicals (e.g. The Economist, Fortune) (3)Financial information organizations (4)Other business publications
 (3)Financial information organizations (4)Other business publications.")
6
Methods of Financial Statement Analysis Horizontal Analysis Vertical Analysis Common-Size Statements Trend Percentages Ratio Analysis

7
Horizontal Analysis

8
Vertical Analysis

9
Common-Size Statements

10
Trend Percentages

11
Ratio Analysis

12
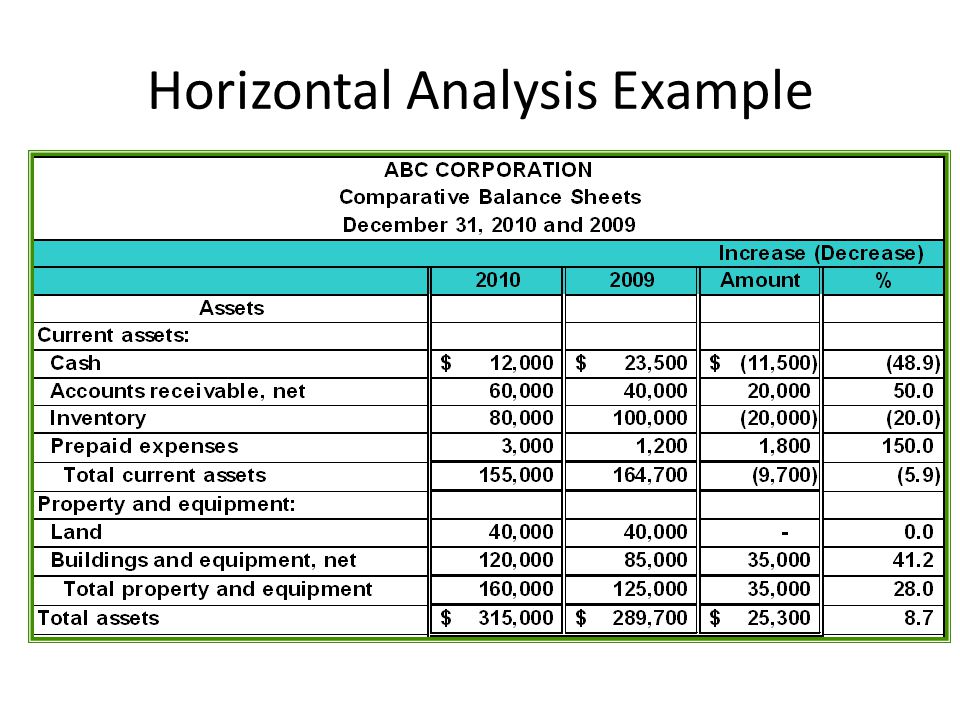
Horizontal Analysis Example horizontal analysis The management of ABC Company provides you with comparative balance sheets of the years ended December 31, 2009 and 2010. Management asks you to prepare a horizontal analysis on the information.

14
Horizontal Analysis Example Calculating Change in Dollar Amounts Since we are measuring the amount of the change between 2010 and 2009, the dollar amounts for 2009 become the “base” year figures. Dollar Change Current Year Figure Base Year Figure =–

15
Horizontal Analysis Example Calculating Change as a Percentage Percentage Change Dollar Change Base Year Figure 100% = ×

16
$12,000 – $23,500 = $(11,500) Horizontal Analysis Example
 Horizontal Analysis Example")
17
($11,500 ÷ $23,500) × 100% = 48.9% Horizontal Analysis Example
 × 100% = 48.9% Horizontal Analysis Example")
19
Let’s apply the same procedures to the liability and stockholders’ equity sections of the balance sheet. Horizontal Analysis Example

21
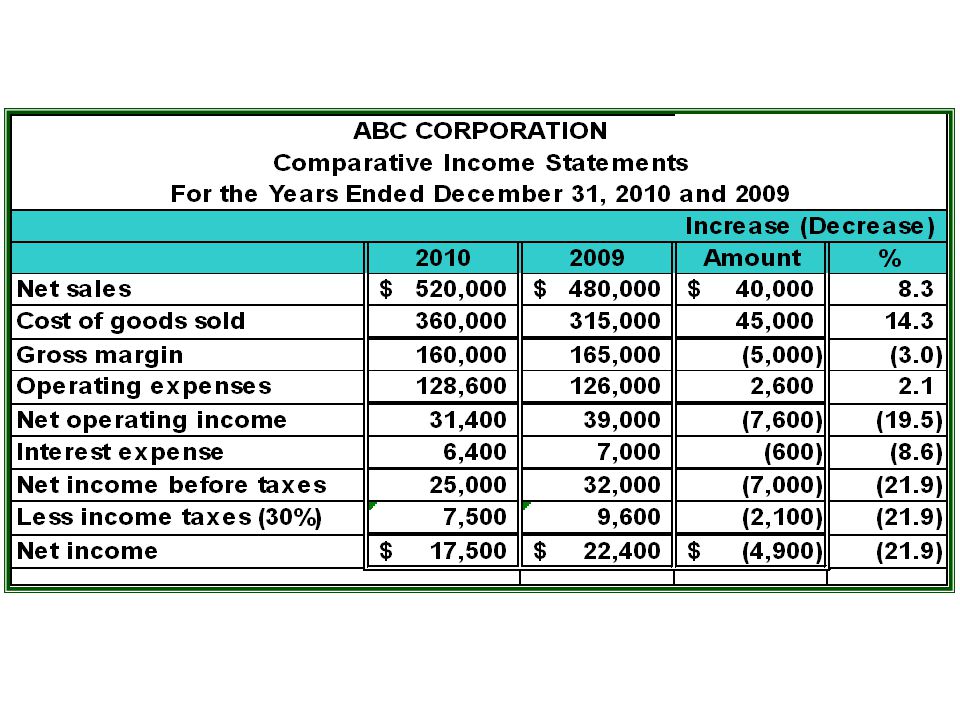
Now, let’s apply the procedures to the income statement. Horizontal Analysis Example

23
Sales increased by 8.3% while net income decreased by 21.9%.

24
There were increases in both cost of goods sold (14.3%) and operating expenses (2.1%). These increased costs more than offset the increase in sales, yielding an overall decrease in net income.

25
Vertical Analysis Example vertical analysis The management of Sample Company asks you to prepare a vertical analysis for the comparative balance sheets of the company.

26
Vertical Analysis Example

27
$82,000 ÷ $483,000 = 17% rounded $30,000 ÷ $387,000 = 8% rounded

28
Vertical Analysis Example $76,000 ÷ $483,000 = 16% rounded

29
Trend Percentages Example Wheeler, Inc. provides you with the following operating data and asks that you prepare a trend analysis.

30
Trend Percentages Example Wheeler, Inc. provides you with the following operating data and asks that you prepare a trend analysis. $1,991 - $1,820 = $171

31
Trend Percentages Example Using 1995 as the base year, we develop the following percentage relationships. $1,991 - $1,820 = $171 $171 ÷ $1,820 = 9% rounded

32
Trend line for Sales

33
Ratios Ratios can be expressed in three different ways: 1. Ratio (e.g., current ratio of 2:1) 2. % (e.g., profit margin of 2%) 3. $ (e.g., EPS of $2.25) “Using ratios and percentages without considering the underlying leads to incorrect conclusions.”
 2. % (e.g., profit margin of 2%) 3. $ (e.g., EPS of $2.25) Using ratios and percentages without considering the underlying leads to incorrect conclusions. .")
34
Categories of Ratios Liquidity Ratios Indicate a company’s short-term debt-paying ability Equity (Long-Term Solvency) Ratios Show relationship between debt and equity financing in a company Profitability Tests Relate income to other variables Market Tests Help assess relative merits of stocks in the marketplace
 Ratios Show relationship between debt and equity financing in a company Profitability Tests Relate income to other variables Market Tests Help assess relative merits of stocks in the marketplace")
35
Important Considerations Need for comparable data – Data is provided by different companies. – Must compare by industry l Influence of external factors u General business conditions u Seasonal nature of business operations l Impact of inflation

Similar presentations