Download presentation
Presentation is loading. Please wait.

2
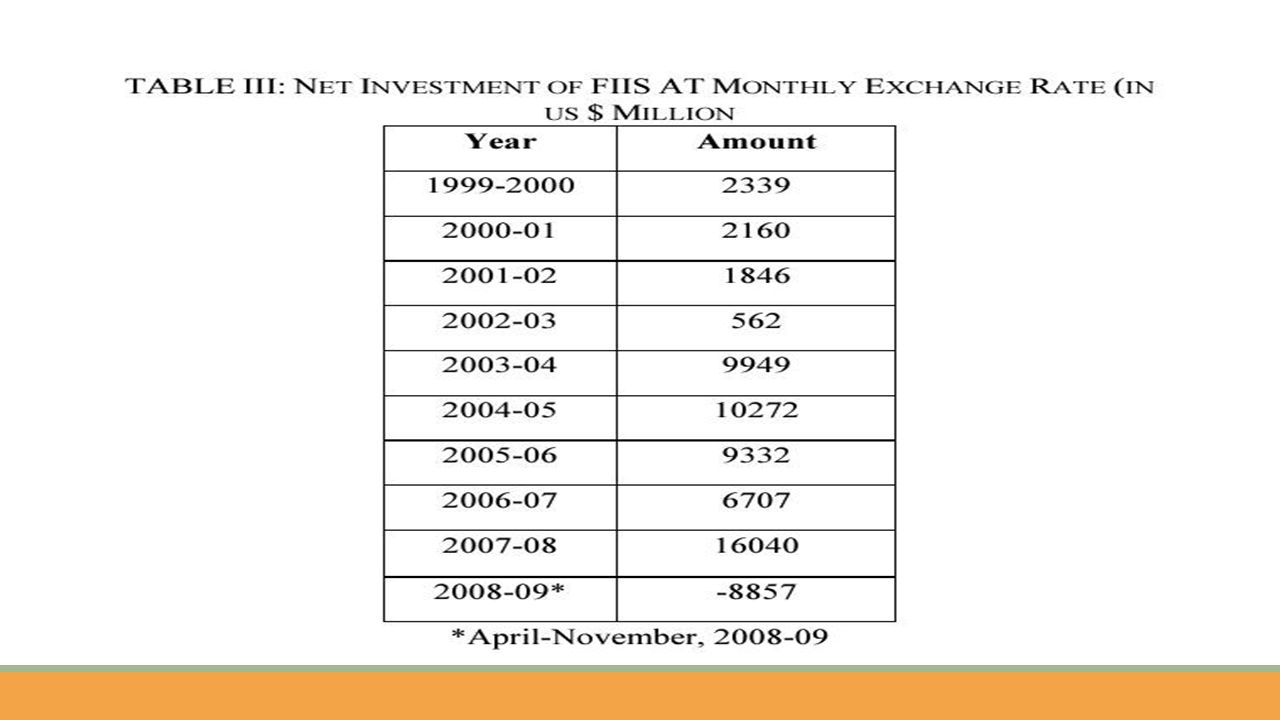
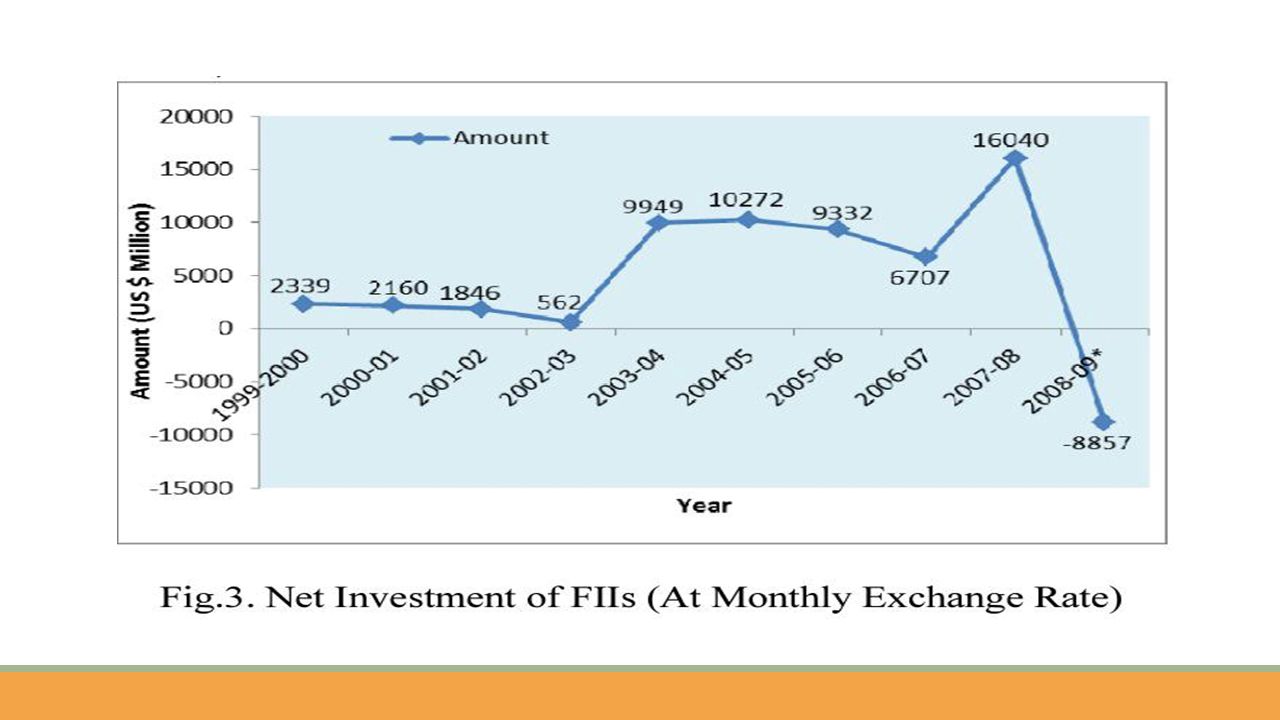
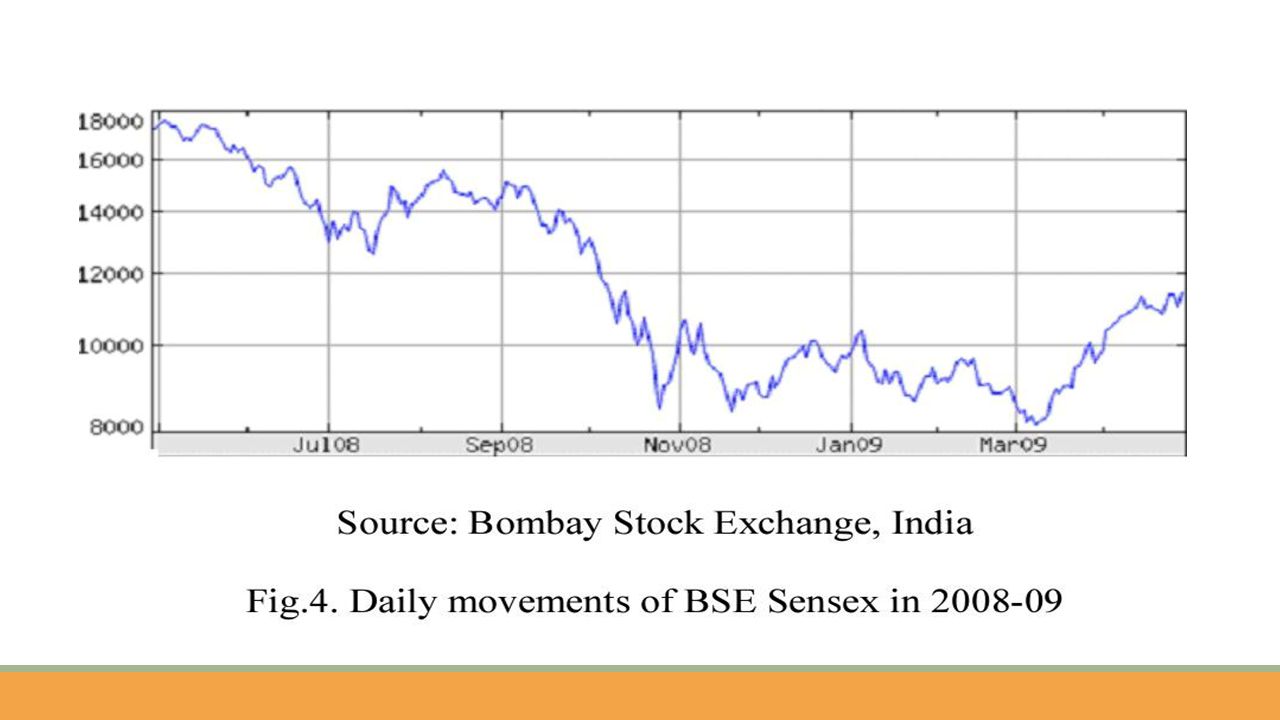
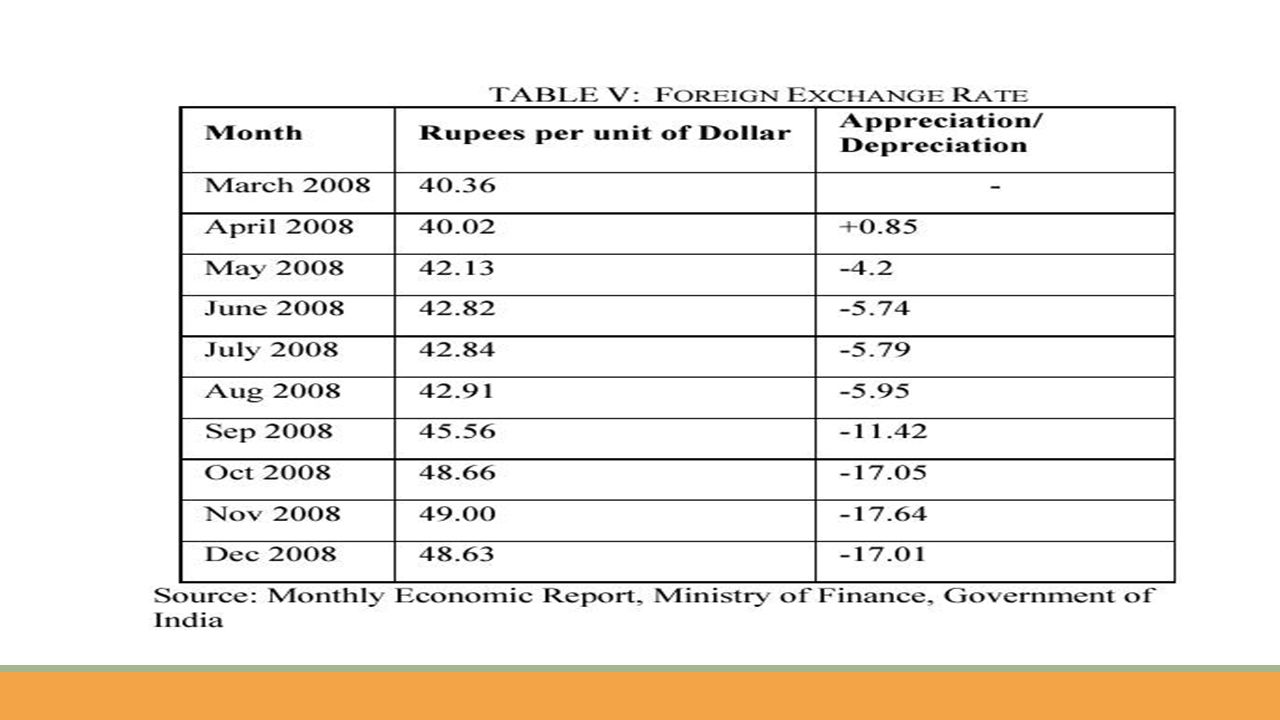
The down turn that appears to have began in the USA in September,2008 have some negative effect on Indian economy. The most immediate effect of this global financial crisis on India is an out flow of foreign institutional investment (FII) from the equity market. The impact of the global crisis has been transmitted to the Indian economy through three distinct channels, namely: the financial sector, exports and exchange rates. The other significant channel of impact is the fall of the business and consumer confidence leading to decrease in investments and consumer demand.
 from the equity market. The impact of the global crisis has been transmitted to the Indian economy through three distinct channels, namely: the financial sector, exports and exchange rates. The other significant channel of impact is the fall of the business and consumer confidence leading to decrease in investments and consumer demand..")
3
Economic liberalization of India means the process of opening up of the Indian economy to trade and investment with the rest of the world. Till 1991 India had a import protection policy wherein trade with the rest of the world was limited to exports. Foreign investment was very difficult to come into India due to a bureaucratic framework. After the start of the economic liberalization, India started getting huge capital inflows and it has emerged as the 2nd fastest growing country in the world.

4
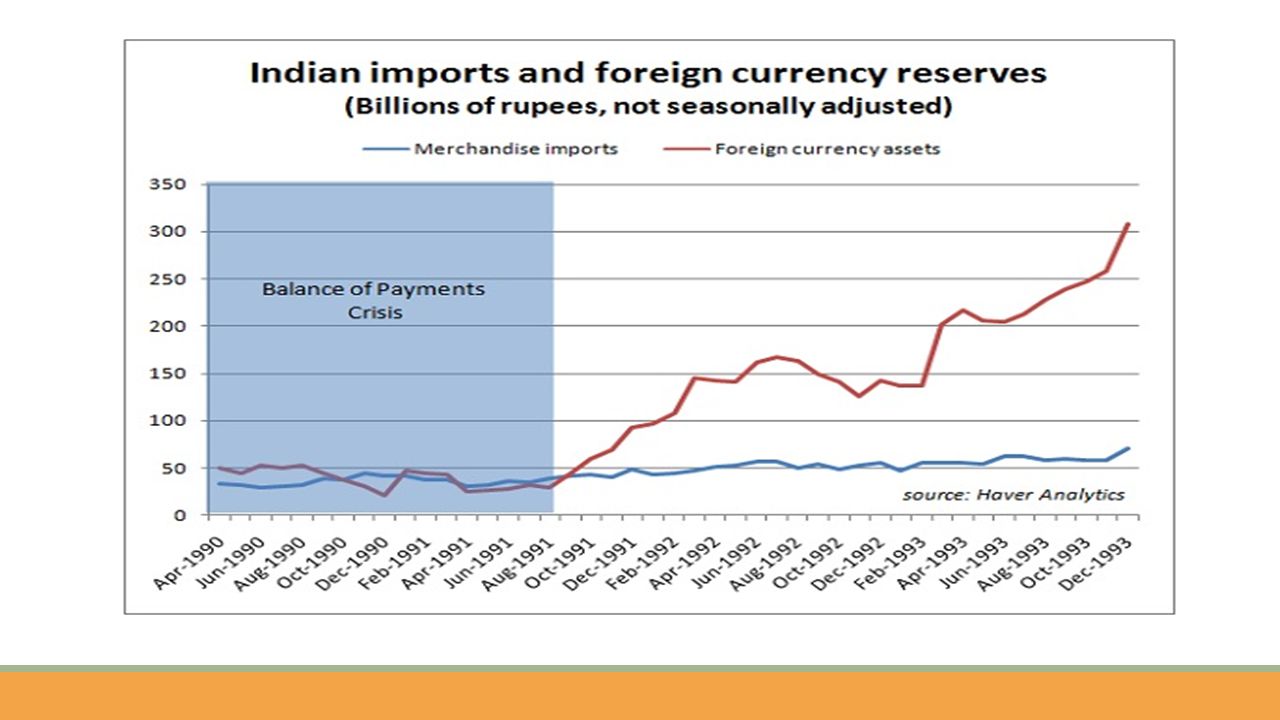
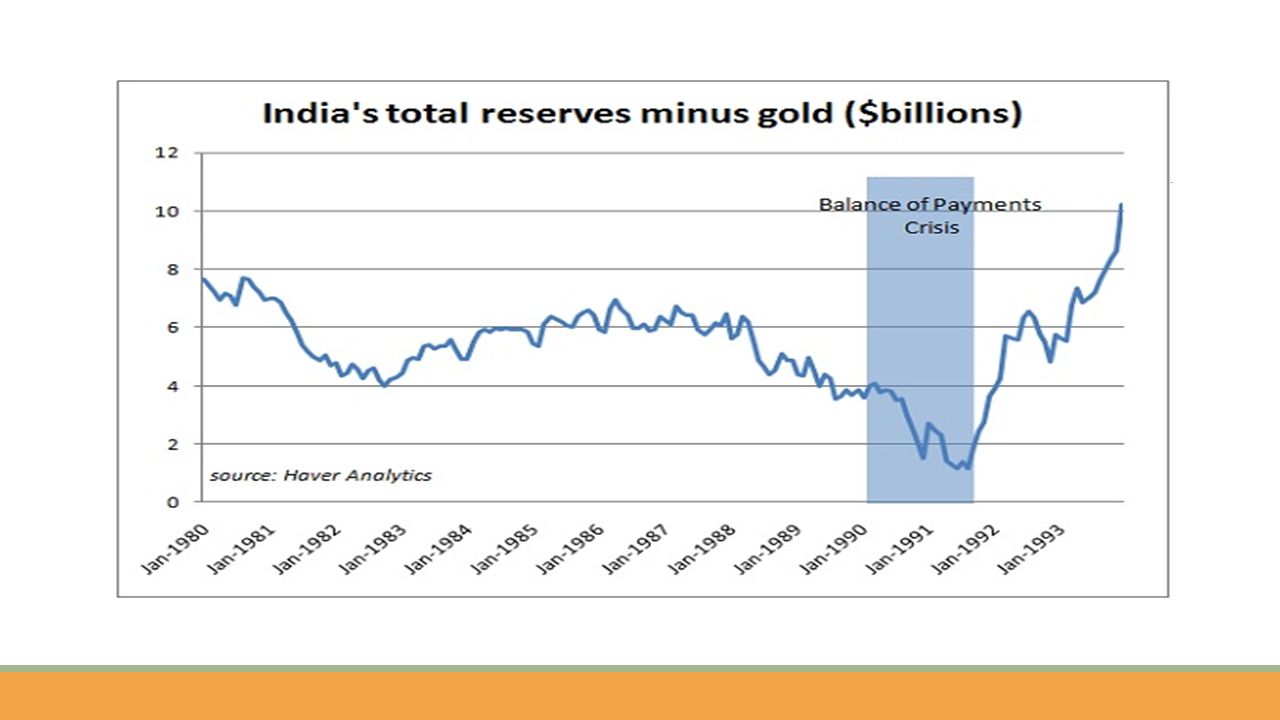
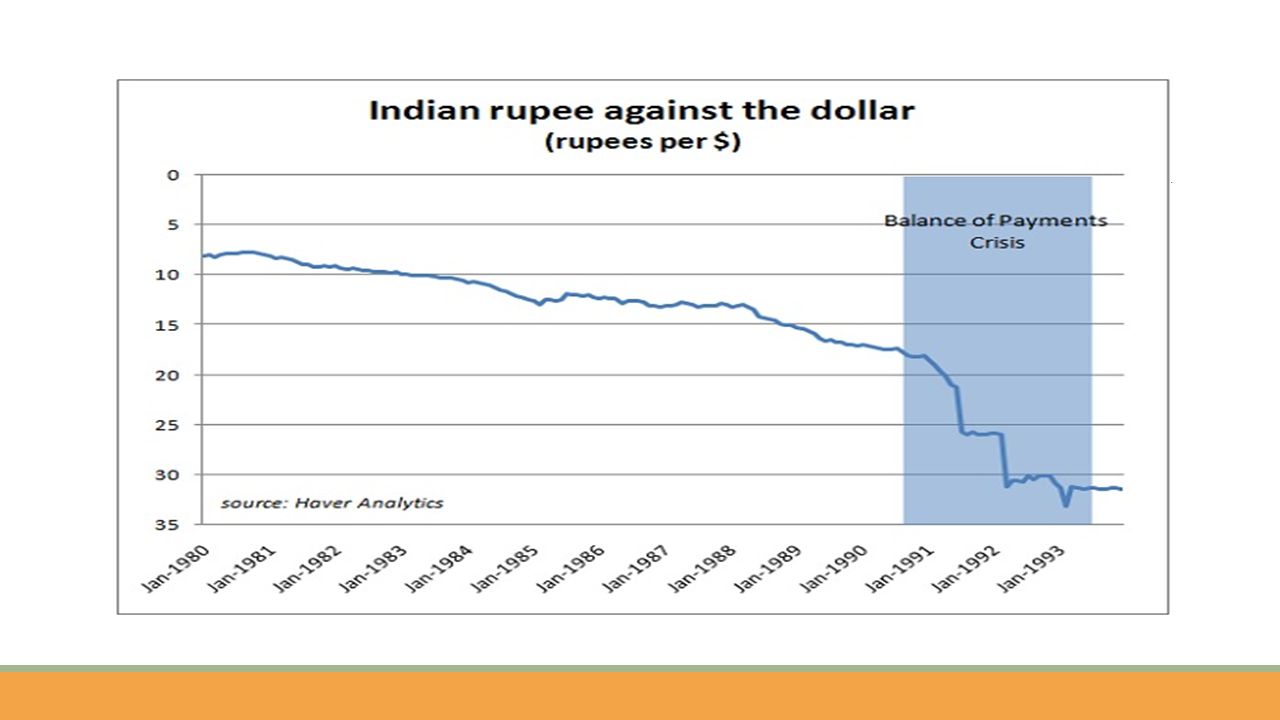
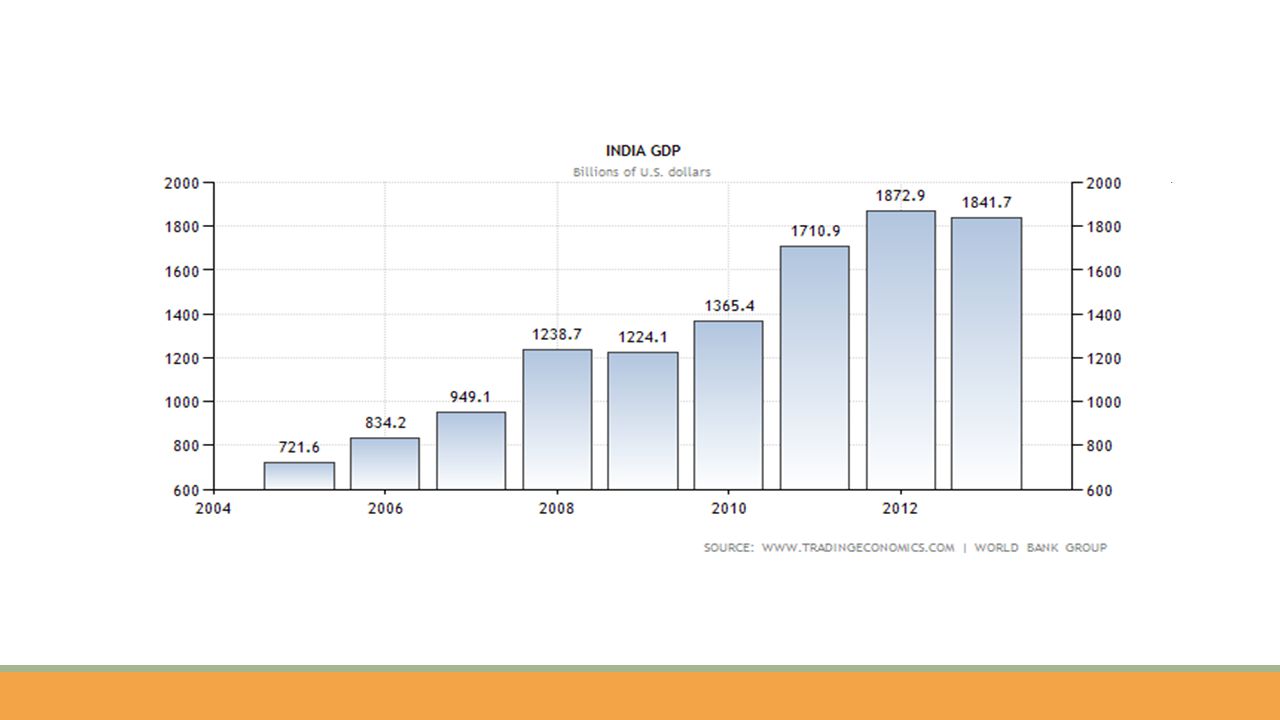
In 1991, after India faced a balance of payments crisis, investors deserted India as turbulence descended: prime minister Rajiv Gandhi was assassinated and what’s now known as the Balance of Payments Crisis gripped the country. The fruits of liberalisation reached their peak in 2007, when India recorded its highest GDP growth rate. With this, India became the second fastest growing major economy in the world, next only to China. The growth rate has slowed significantly in the first half of 2012.

6
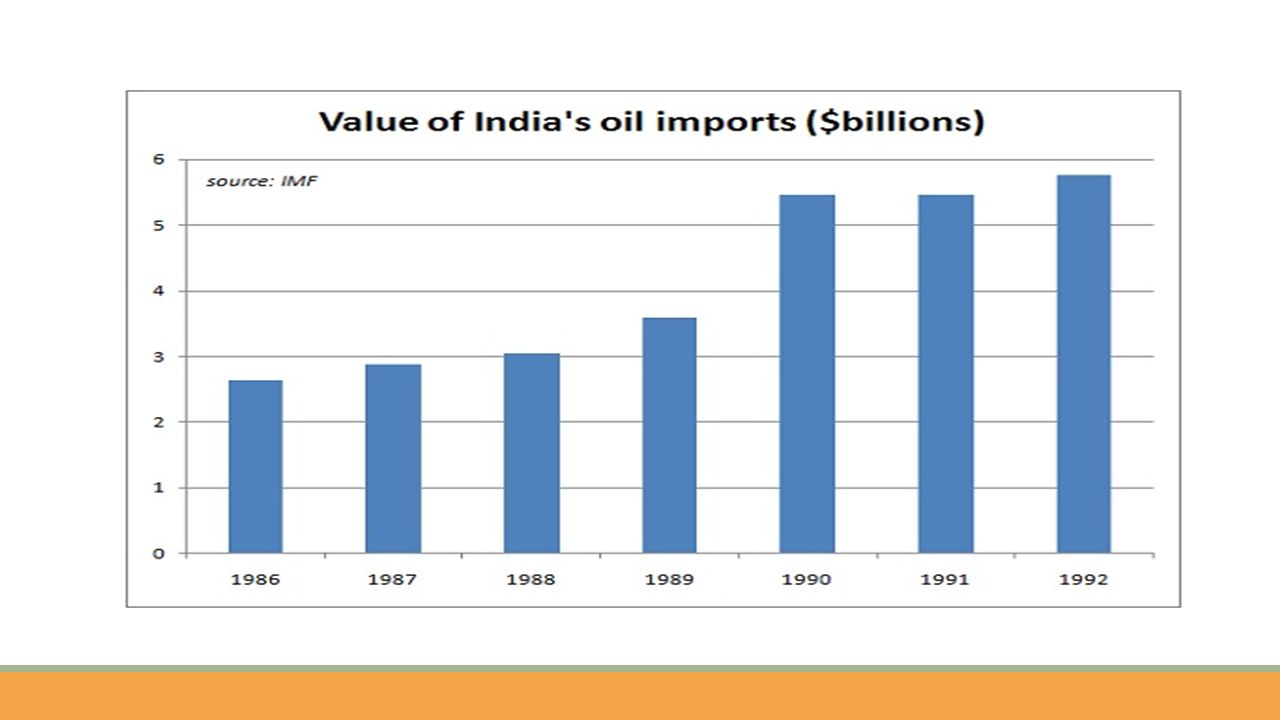
Firstly, the Gulf War. Soaring oil prices pushed up the cost of India’s imports. Investors loss of confidence to the government

12
It had to pledge 20 tones of gold to Union Bank of Switzerland and 47 tones to Bank of England as part of a bailout deal with the International Monetary Fund (IMF). IMF required India to undertake a series of structural economic reforms.

13
Trade, hotels, transport and communication; financing, insurance, real estate and business services and community, social and personal services account for more than 60 percent of GDP Agriculture, forestry and fishing constitute around 12 percent of the output, but employs more than 50 percent of the labor force. Manufacturing accounts for 15 percent of GDP, construction for another 8 percent and mining, quarrying, electricity, gas and water supply for the remaining 5 percent.

14
REAL GDP – Adjusted to inflation

15
Nominal GDP- unadjusted to inflation

16
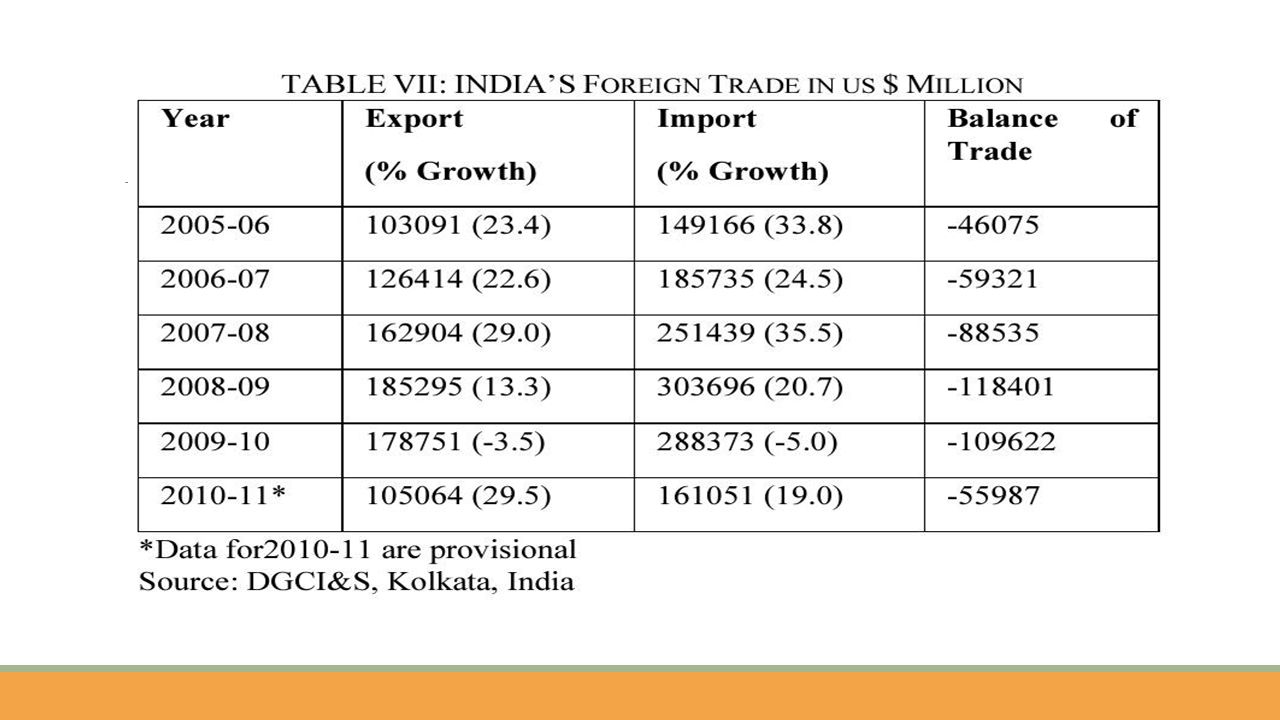
Indian Exports increased 26.8% and touched US$ 18.9 billion in November 2010 Foreign Tourist from January to November 20100 was about 4.93 million as compared to 4.46 million foreign tourists during the same period in 2009. The growth rate registered by the ministry of tourism was 20.7% Foreign exchange earnings went up to whopping US$12.88 billion during the period January to November 2010 as compared to US10.67 billion during January to December 2009. Investment industry. The mutual funds industry managed US$ 160.44 billion total assets. Telecommunication Industry. The number of wireless subscriber increased to 70.69 million. The total telephone using population increased to 62.51% Information Technology and software services generated revenues of US$ 63.7 billion

17
Factors that helped the 2010 GDP increased Agriculture industry grew 1.4% in 2012-13 against the 1.8% estimate Mining production contracted by 2.2% instead of growing 0.4% as extimate Construction 1.1% against the 5.9% estimate Financial services and Real estate grew at a faster trot of 10.9% compared to 8.6% estimate Community services (representing government expenditure) expanded just 5.3% against 6.8% estimate.
 expanded just 5.3% against 6.8% estimate.")
18
Gross Domestic savings (GDS) at current prices in 2012-13 is estimated at Rs30.4trillion as against Rs28.2trillion in 2011-12, constituting 30.1 % of GDP at market prices against 31.3% in the previous year. High Borrowing Costs and delays in securing mandatory government approvals High Inflation and slower hiring

30
YEAR % 199113.87 199211.79 19936.36 199410.21 199510.22 19968.98 19977.16 199813.23 19994.67 20004.01 20013.68 20025.40 20033.80 20043.77 20054.20 20066.20 20076.40 20088.30 200910.90 201012.00 20118.90 20129.30

31
Consumers delay replacing serviceable products and focus on achieving value for money, seeking out deals and eliminating indulgences.

33
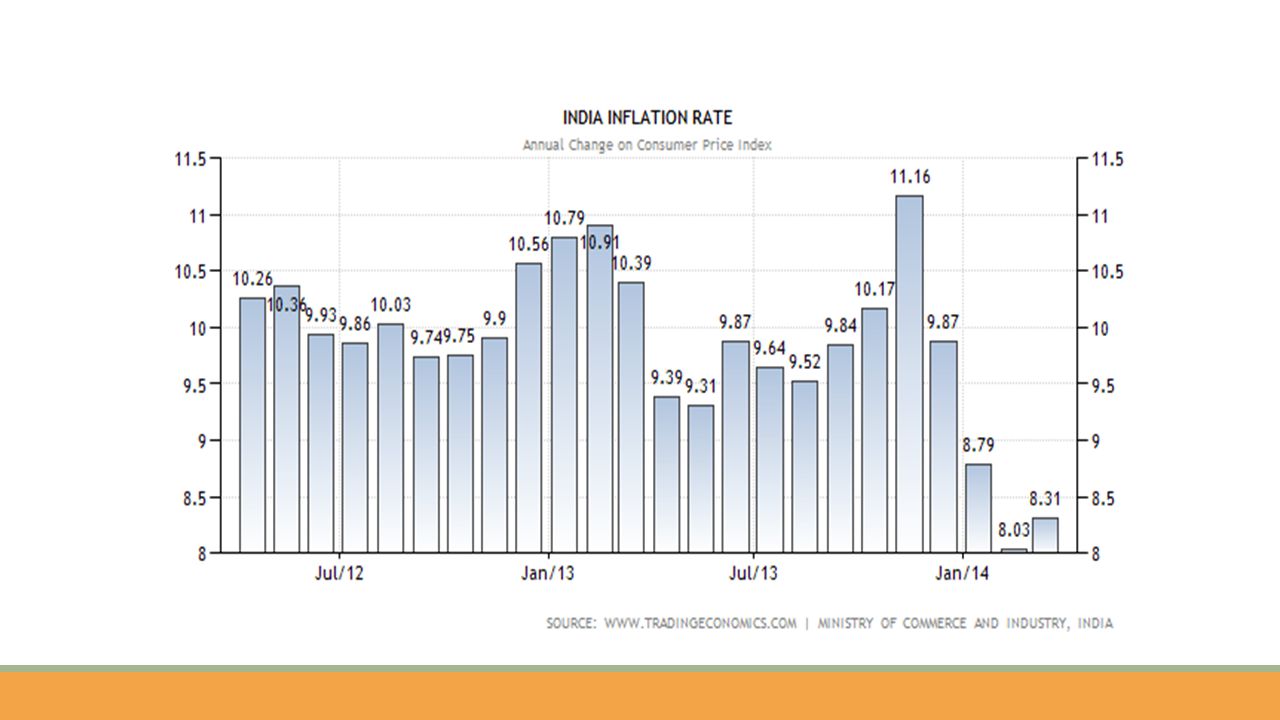
The inflation rate in India was recorded at 8.31 percent in March of 2014. Inflation Rate in India averaged 9.71% from 2012 until 2014, reaching an all time high of 11.16% in November of 2013 and a record low of 7.55% in January of 2012

35
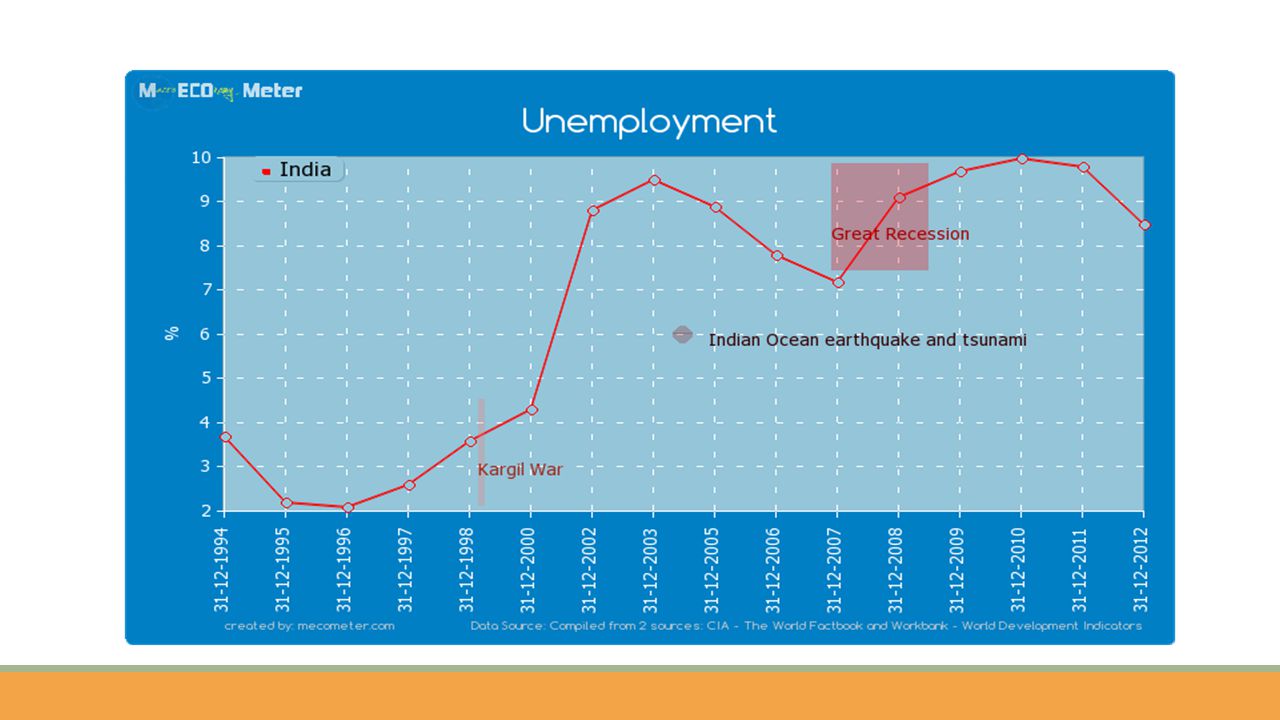
YEAR % 19943.70 19952.20 19962.10 19972.60 19983.60 20004.30 20028.80 20039.50 20058.90 20067.80 20077.20 20089.10 20099.70 201010.00 20119.80 20128.50

36
60% of India’s workforce is self-employed Nearly 30% are casual workforce (e.i. they work only when they are able to get jobs and remain unpaid for the rest of the day)
.")
37
More than 90% labour force is employed in the “unorganized sector”, (e.i. sectors which don’t provide with the social security and other benefits of employment in the “organized sector”) Unemployment increases susceptibility to malnutrition, illness, mental stress and loss of self-esteem, leading to depression results suicide, etc.
 Unemployment increases susceptibility to malnutrition, illness, mental stress and loss of self-esteem, leading to depression results suicide, etc..")
38
Slow down in US economy have made a chilling effect in the Indian IT body shops like TCS, Wipro, and Infosys. IT projects that are halfway to completion, or companies that are stuck with cash flow issues on businesses that are yet to reach break even, will run out of cash Government and other private companies are reluctant in starting new ventures and starting new projects etc.

39
Growth engine for the economy ◦Cost advantage ◦cost arbitrage ◦Quality/maturity process ◦hosts more than 55% of SEI CMM level firms ◦highest number of ISO certified companies ◦Ease of scalability ◦Technically competent labor pool

40
7% of global market 1.2% revenue (1998) to 5.8% (2009) 3.5-4.1% additional in Net value (2009) Key highlight of the Indian IT industry: ◦Export revenues USD 47.3 billion (gross 2009), 66% from IT Industry ◦Domestic market grown to 26% of INR ◦29% export on engineering services and software products ◦Direct employment reached nearly 2 million
 to 5.8% (2009) % additional in Net value (2009) Key highlight of the Indian IT industry: ◦Export revenues USD 47.3 billion (gross 2009), 66% from IT Industry ◦Domestic market grown to 26% of INR ◦29% export on engineering services and software products ◦Direct employment reached nearly 2 million")
41
43% of Western Companies are cutting back IT spending, nearly 30% are scrutinizing IT projects for better returns. 70% of firms negotiating lower rates, 60% cutting back on contractors 654000 jobs lost, Labor department released report, April 3, 2009

42
60-65% workforce 10% GDP Agricultural exports

43
Agricultural GDP ◦poor monsoons to depressed agricultural commodity prices in world market ◦-0.1% 2008-09, 5.8% 2007-08, 0.4% 2009-10, 6.6% 2010-2011

44
Decline on demand Wholesale prices of Indian Fishes imported in European Union declined

45
Attributed to off-shoring and outsourcing businesses Investments came from non-resident Indians as well as equity funds Bankruptcy of Lehman Brother and Meryll Lynch Decrease in market rates 10-30% in metropolitan and upcoming cities in India

46
As per the figures shown in the Index of Industrial Production(IIP) in the month of August 2008-09, the manufacturing sector has grown by a shockingly low 1.1%. The same sector had grown by 10.7% in 2007-08. It’s an indication that industries have been relying on existing projects only.

47
Approximately, 60% of the total garments manufactured in India are exported to foreign markets like EU, US, and Japan, generating revenue of up to US$ 52 billion. During October 2008, as economic slowdown branched out, the total output of the textile sector came down by 10%. An estimate states that during 2008, almost 8,000,000 garment and textile employees had lost their jobs, which is one of the biggest employer about 88.02 million. Some biggest apparel companies in India, which are mainly located in Ludhiana in Punjab generating employment for 4,000,000 jobs has suffered a 50% loss in sales; especially the exports during 2008. This has affected 20 to 30% of jobs.

48
Monetary and Credit Policy is essentially managed by central bank

49
Monetary Policy-Meaning Reserve Bank of India states that, o Monetary policy refers to the use of instruments under the control of the central bank to regulate the availability, cost and use of money and credit.

50
Objectives Rapid Economic Growth Price Stability Exchange Rate Stability Balance of Payments (BOP) Equilibrium Full Employment Equal Income Distribution
 Equilibrium Full Employment Equal Income Distribution")
51
Rapid Economic Growth If the RBI opts for a cheap or easy credit policy by reducing interest rates, the investment level in the economy can be encouraged. This increased investment can speed up economic growth

52
Price Stability & Exchange Rate Stability All the economics suffer from inflation and deflation. It can also be called as Price Instability. The RBI by altering the foreign exchange reserves tries to influence the demand for foreign exchange and tries to maintain the exchange rate stability.

53
Balance of Payments (BOP) Equilibrium Many developing countries like India suffers from the Disequilibrium in the BOP The BOP has two aspects i.e. the 'BOP Surplus' and the 'BOP Deficit'. The former reflects an excess money supply in the domestic economy, while the later stands for stringency of money

54
Full Employment In simple words 'Full Employment' stands for a situation in which everybody who wants jobs get jobs. However it does not mean that there is a Zero unemployment. In that senses the full employment is never full.

55
Equal Income Distribution monetary policy can make special provisions for the neglect supply such as agriculture, small-scale industries, village industries, etc. and provide them with cheaper credit for longer term

56
Some Instruments Cash Reserve Ratio -It is the ratio of a bank’s time and demand liabilities to be kept in reserve with the RBI. o Statutory Liquidity Ratio -Banks have to invest a certain percentage of its time and demand liabilities n government approved securities

57
Fiscal Policy o Means by which a government adjusts its levels of spending in order to monitor and influence a nation's economy

58
Objectives Development by effective Mobilisation of Resources Efficient allocation of Financial Resources Reduction in inequalities of Income and Wealth Price Stability and Control of Inflation Employment Generation

59
Reducing the Deficit in the Balance of Payment Capital Formation Development of Infrastructure Foreign Exchange Earnings

60
Development by effective Mobilisation of Resources The financial resources can be mobilised by : Taxation Public Savings Private Savings

61
Efficient allocation of Financial Resources should ensure that the resources are allocated for generation of goods and services which are socially desirable designed in such a manner so as to encourage production of desirable goods and discourage those goods which are socially undesirable

62
Reduction in inequalities of Income and Wealth direct taxes such as income tax are charged more on the rich people as compared to lower income groups indirect taxes are also more in the case of semi-luxury and luxury items, which are mostly consumed by the upper middle class and the upper class

63
Price Stability and Control of Inflation the government always aims to control the inflation by Reducing fiscal deficits, introducing tax savings schemes, Productive use of financial resources, etc

64
Employment Generation Lower taxes and duties on small-scale industrial (SSI) units encourage more investment and consequently generates more employment
 units encourage more investment and consequently generates more employment")
65
Reducing the Deficit in the Balance of Payment attempts to encourage more exports by way of fiscal measures like Exemption of income tax on export earnings, Exemption of central excise duties and customs, Exemption of sales tax

66
Capital Formation must be efficiently designed to encourage savings and discourage and reduce spending

67
Development of Infrastructure part of the government's revenue is invested in the infrastructure development

68
Foreign Exchange Earnings attempts to encourage more exports by way of Fiscal Measures like, exemption of income tax on export earnings, exemption of sales tax foreign exchange earned by way of exports and saved by way of import substitutes helps to solve balance of payments problem

69
consists of two main tools : changing of tax rates changing government spending

70
change in tax rates is usually implemented when inflation is Un- usually high, and there is a recession with high unemployment.

71
change in government spending has a stronger effect on the Economy than change in tax rates when the government decides to fight a recession it can spend a large amount of money on goods and services, all of which is released into the economy

72
Three Possible Positions Neutral position Expansionary position Contractionary position

Similar presentations


 sector, collective farm market and cooperative trade Consumer goods market Black market.>")


