Download presentation
Presentation is loading. Please wait.

1
Making Sense of DNA and protein sequence analysis tools (course #2) http://www.ncbi.nlm.nih.gov/Class/minicourses/ Dave Baumler Genome Center of Wisconsin, UW-Madison dbaumler@wisc.edu
 Dave Baumler Genome Center of Wisconsin, UW-Madison")
2
Todays session an overview You have been given a 5 KB piece of DNA sequence GeneScan: find any exons in the DNA sequence and generate a predicted protein sequence ScanProsite: scan the protein sequence for domains/motifs/patterns found in the prosite database BLASTP: run a BLASTP search against the Swissprot database find some of the best matches (hits) and copy each protein sequence into a word doc for the alignment MultAlin: conduct protein sequence alignments from the BLASTP search
 and copy each protein sequence into a word doc for the alignment MultAlin: conduct protein sequence alignments from the BLASTP search")
3
In this session you will try out 4 different tools, Lots of other tools exist http://bioinformatics.ca/links_directory/

4
Where are the coding regions? TCAGCGAAGATGAGATAGTTTTTAAAGGTGGGATTTCCCCACCTTTAAAAAGCGAGAAGTCCCGGTTTTAA AGAGGAGTAAAATCCTCTTTTTCTAGCCCACTCAGGTGGTTTTTTTGGTTTTCGCTCCTTGCCGCATCTTC TGTGCCTTTGATGGCGGCTGGTTGGGGTGAAAGGCTGCATATTCCAGAATTTCAGACAGTAGATTGTTTTT GAAATCTTCCGTTTTATCGTTGACGAACTTAACCATCCTGTTGAAATCATCTTCCTTTGATACACCTTCAG GAAATGCCTTAGGAACTGATGTTTGGCTATCCAAGGCATCTTGCAATATCTGCACGATCTCCGAATTCATT GATCGCCCATTGGCCTTTGCTCTGGCGGCAACTGCGTCACGCATACCGTCAGGCATCCTAACTGTAAATCT CTCAATGAAAGCTGGATCTTCTTTTTCAGTCATCATCTTAAACCATAAAAATTTATACAAAACACACTAGC ATCATATTGACATTACCCACAATGACATCATAATGGTGTCAGGCATCAAAATGATGTCATCATGACAAGGG GAAAGTAAATGCAAGATGTTCTCTATACAGGTCGTAAGAACGACAGCTTTCAGCTTCGTCTGCCTGAGCGA ATGAAAGAAGAGATCCGTCGCATGGCAGAGATGGACGGCATTTCGATTAATTCTGCAATCGTGCAGCGCCT TGCTAAAAGCTTGCGTGAGGAAAGAGTTAATGGGCAGTAAAAACAGCGAAGCCCGGAAGTGTGGGGACACT AACCGGGCTTCTAATGTCAGTTACCTAGCGGGAAACCAACAATGACCAGTATAGCAATCTTTGAAGCAGTA AACACTATCTCTCTTCCATTCCACGGACAGAAGATCATAACTGCGATGGTGGCGGGTGTGGCGTATGTGGC AATGAAGCCCATCGTGGAAAACATCGGTTTAGACTGGAAGAGCCAGTATGCCAAGCTCGTTAGTCAGCGTG AAAAGTTCGGGTGTGGTGATATCACCATACCTACCAAAGGTGGTGTTCAGCAGATGCTTTGCATCCCTTTG AAGAAACTGAATGGATGGCTCTTCAGCATTAACCCAGCAAAAGTACGTGATGCAGTTCGTGAAGGTTTAAT TCGCTATCAAGAAGAGTGTTTTACAGCTTTGCACGATTACTGGAGCAAAGGTGTTGCAACGAATCCCCGGA CACCGAAGAAACAGGAAGACAAAAAGTCACGCTATCACGTTCGCGTTATTGTCTATGACAACCTGTTTGGT GGATGCGTTGAATTTCAGGGGCGTGCGGATACGTTTCGGGGGATTGCATCGGGTGTAGCAACCGATATGGG ATTTAAGCCAACAGGATTTATCGAGCAGCCTTACGCTGTTGAAAAAATGAGGAAGGTCTACTGATTGGCGT ATTGGAAGGCGCAAAAAGAAAAGCCAGCAGATGGGCTGCTGGCATTCATTGGGTATATGAACTTTCGGAGA ACATATGAAGTCAATTATCAAGCATTTTGAGTTTAAGTCAAGTGAAGGGCATGTAGTGAGCCTTGAGGCTG CAAGCTTTAAAGGCAAGCCAGTTTTTTTAGCAATTGATTTGGCTAAGGCTCTCGGGTACTCAAATCCGTCA

5
Genemark.hmm a statistical model

6
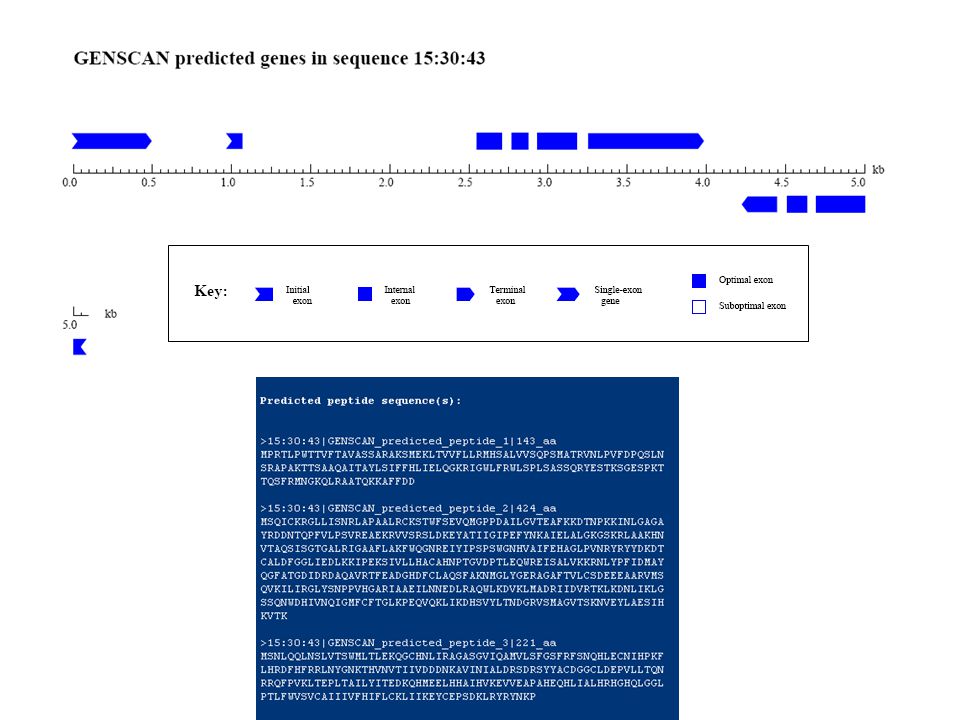
Exon prediction in Eukaryotic DNA using Genescan: Net result is a protein sequence GeneScan looks for start and stop codons, promoters, splice sites, polyA tails, provides statistics for coding potential

7
GeneScan results

10
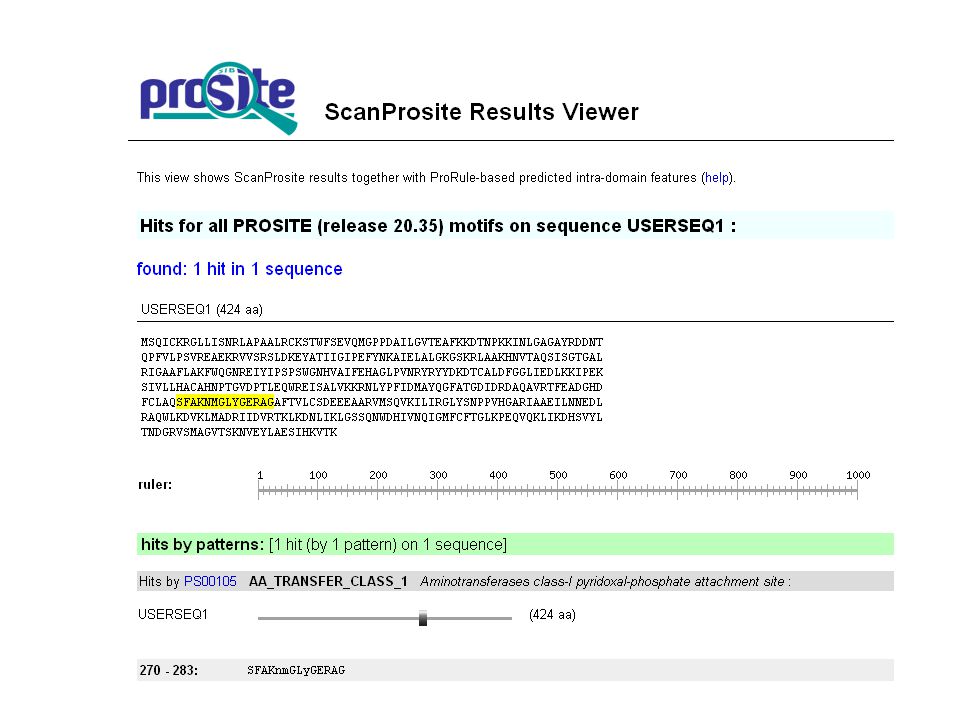
I have a protein sequence, now what? -Amos Bairoch, (creater of SWISS-PROT), created a collection of small well-conserved segments (patterns) to classify and analyze new proteins -PROSITE is the name he gave to this pattern database -PROSITE also contains profiles which describe every position of a protein family -ScanProsite is a server that compares your protein to the PROSITE database -if your protein contains a PROSITE pattern, it can give you a pretty clear indication of its function
, created a collection of small well-conserved segments (patterns) to classify and analyze new proteins -PROSITE is the name he gave to this pattern database -PROSITE also contains profiles which describe every position of a protein family -ScanProsite is a server that compares your protein to the PROSITE database -if your protein contains a PROSITE pattern, it can give you a pretty clear indication of its function.")
11
What does it look for on the protein sequence? -profiles of protein families -conserved patterns in the sequence ([RK]-x-[ST]) -cofactor binding motifs -substrate binding motifs ScanProsite: Around the world there are ~8 other major collections of domains, such as Interproscan, CD server, or Pfscan
 -cofactor binding motifs -substrate binding motifs ScanProsite: Around the world there are ~8 other major collections of domains, such as Interproscan, CD server, or Pfscan.")
13
ScanProsite results continued

14
Sequence Similarity Searches using BLAST The Basic Local Alignment Search Tool (BLAST) finds regions of local similarity between sequences. The program compares nucleotide or protein sequences to sequence databases and calculates the statistical significance of matches. BLAST can be used to infer functional and evolutionary relationships between sequences as well as help identify members of gene families. ATGGAACTGACTCCAAGAGAAAAAGACAAACTATTACTGTTTACCGCTGCACTGCTGGCAGAGCGTCGTCTGGCCCGCGGCCTGAAACTTAACTA TCCCGAATCCGTGGCCCTGATTAGCGCTTTTATAATGGAGGGCGCTCGCGACGGCAAAAGCGTCGCTGCGCTGATGGAAGAAGGACGGCATGTC CTGAGTCGCGAGCAGGTCATGGAAGGCATACCAGAAATGATCCCCGATATCCAGGTCGAAGCCACCTTTCCGGACGGCTCCAAGCTGGTTACCG TCCATAATCCGATAATCTGA -If you have a region of sequenced DNA, and you want to know what the protein encoded does -If you can find similar sequences you can say, “if something is true for that sequence, it is probably true for mine as well.” -could take years in the lab, can take only seconds to search a database for similarity This is an unknown gene sequence used in the next few slides

15
BLAST = Basic Local Alignment Search Tool “The most popular data mining tool ever” BLASTN DNA sequence vs. DNA sequence database BLASTPprotein sequence vs. protein sequence database BLASTXDNA sequence translated in 6 reading frames vs. protein sequence database tBLASTXDNA sequence translated in 6 reading frames vs. DNA sequence database translated in 6 frames The different types of BLAST

16
Steps to use Blast #1) Paste sequence here #2) Choose search set (Either nucleotide collection or Protein Data Bank) #3) select program to use #4 push blast button
 Paste sequence here #2) Choose search set (Either nucleotide collection or Protein Data Bank) #3) select program to use #4 push blast button")
17
This is the length of your query (in this case it was nucleotides) The number of sequences in the database The number of letters (base pairs) in the database Red, pink, and green are good matches Blast output #1
 The number of sequences in the database The number of letters (base pairs) in the database Red, pink, and green are good matches Blast output #1")
18
How good is your BLAST hit? The bit score: a measure of the statistical significance of the score (The higher the score the better and matches <50 are unreliable) E-value: it is the number of times that your database match may have occurred by chance. The lower (closest to zero) the better, matches above 0.001 are close to the “twilight zone” Click here next to get to this genbank entry
 E-value: it is the number of times that your database match may have occurred by chance. The lower (closest to zero) the better, matches above are close to the twilight zone Click here next to get to this genbank entry.")
19
A GenBank file Name of the gene (ureC) Product Function Organism from which the sequence was characterized List of annotated features Structural annotation
 Product Function Organism from which the sequence was characterized List of annotated features Structural annotation")
20
Once you find some protein sequences with BLAST, copy and paste in word or a text editor Note: each one will need a FASTA header with the organism name following as the first line

21
MultAlin: conduct protein sequence alignments from the BLASTP search B Asx Aspartic acid or Asparagine Z Glx Glutamine or Glutamic acid

22
Its your turn http://www.ncbi.nlm.nih.gov/Class/minicourses/ Choose Course #2: Making sense of DNA and protein sequences Questions to consider as they work through these exercises: #1) What aspects of the tools/resources are confusing or problematic? What questions do you think your students would have? #2) How can we design similar exercises for our classes that are more compelling? How can we make the students more engaged, invested and motivated to learn? #3 Group compilation of additional resources/websites that might be even better or more intuitive than the NCBI tools?
 How can we design similar exercises for our classes that are more compelling. How can we make the students more engaged, invested and motivated to learn. #3 Group compilation of additional resources/websites that might be even better or more intuitive than the NCBI tools .")
Similar presentations


 & Degradation (Pseudogenes)>")


>")


>")