Download presentation
Presentation is loading. Please wait.

1
Ice Formation and Ice Cover Hydraulics 2004 Cold Regions Workshop
Steven F Daly ERDC/CRREL US Army Corps of Engineers ® Engineer Research and Development Center

2
Outline Ice formation Evolution of river ice Formation of ice covers
River Ice Hydraulics Steven F Daly (603)
")
3
Cold Problem Solvers for the Nation
CRREL Cold Problem Solvers for the Nation

4
Two contrasting cases:
Ice Formation Two contrasting cases: Turbulent parcel of water. Ideal case of ice formation in rivers. Quiescent parcel of water. Ideal case of ice formation in lakes, ponds, slow-moving rivers.

5
Here the heat loss rate from the water is less than the latent heat released by growing ice.
Water cools with no ice Here the heat loss rate from the water is greater than the latent heat released by growing ice. Here the heat loss rate from the water is equal to the latent heat released by growing ice.

6
Where does the ice come from?
Nucleation?: Spontaneous Appearance Homogeneous nucleation: Pure water Heterogeneous nucleation: due to the action of catalysts (nucleating agents) such as silver iodide, organic particles, bacterial
 such as silver iodide, organic particles, bacterial.")
7
Secondary Nucleation Seed crystals introduced from outside the waterbody. Sources: bubble bursting, wave breaking; snow; ice; etc. Secondary nucleation is the formation of new crystals due to the presence of ice crystals. We think it is through the removal of nuclei through collisions with other crystals and hard boundaries.

11
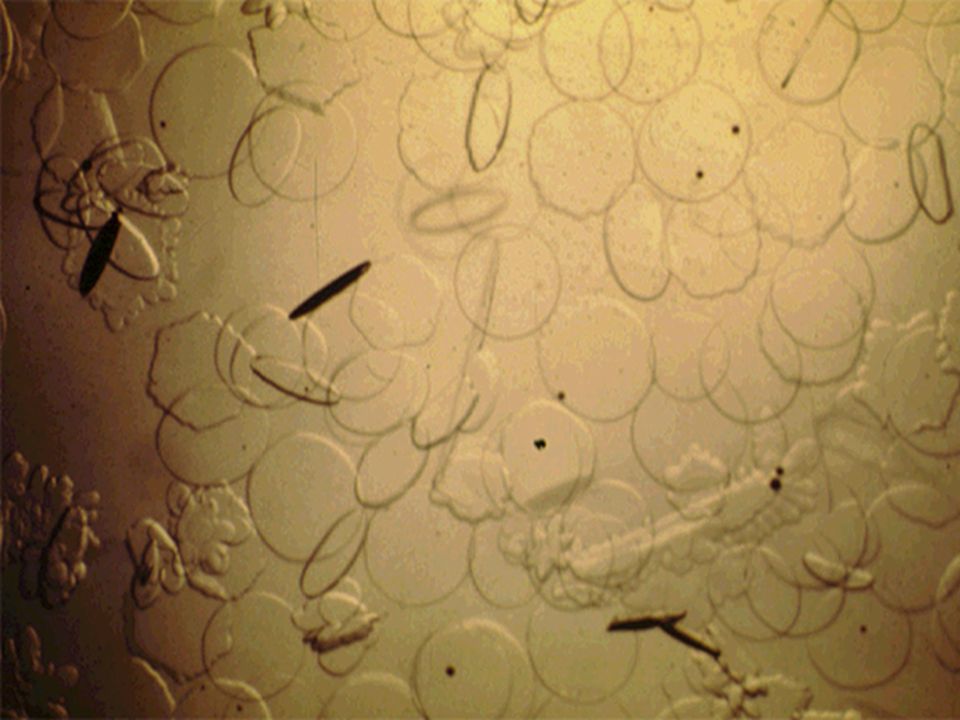
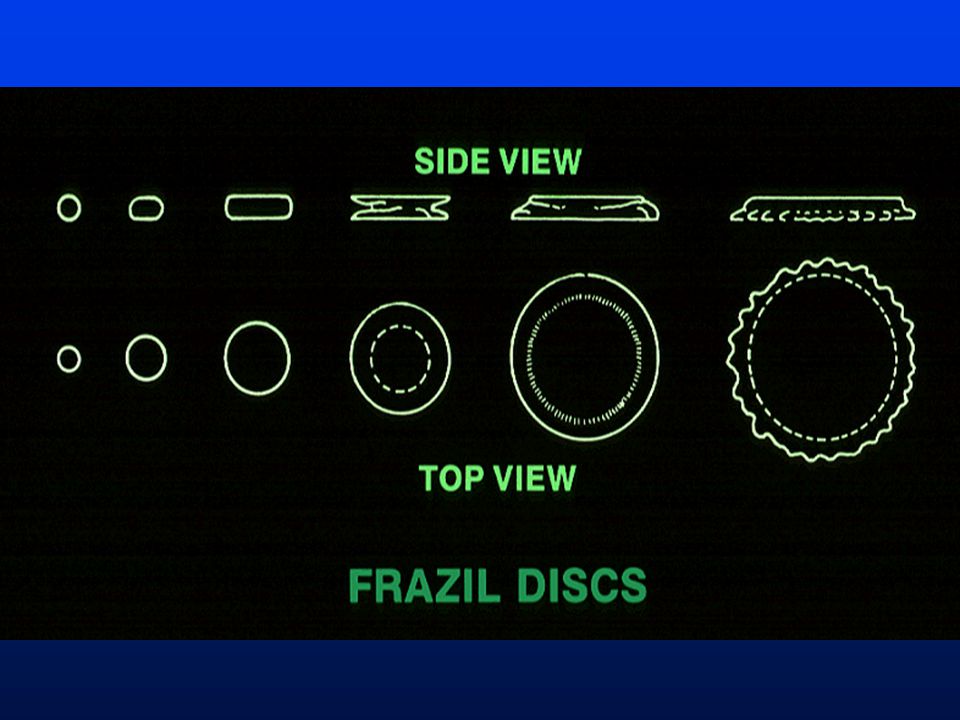
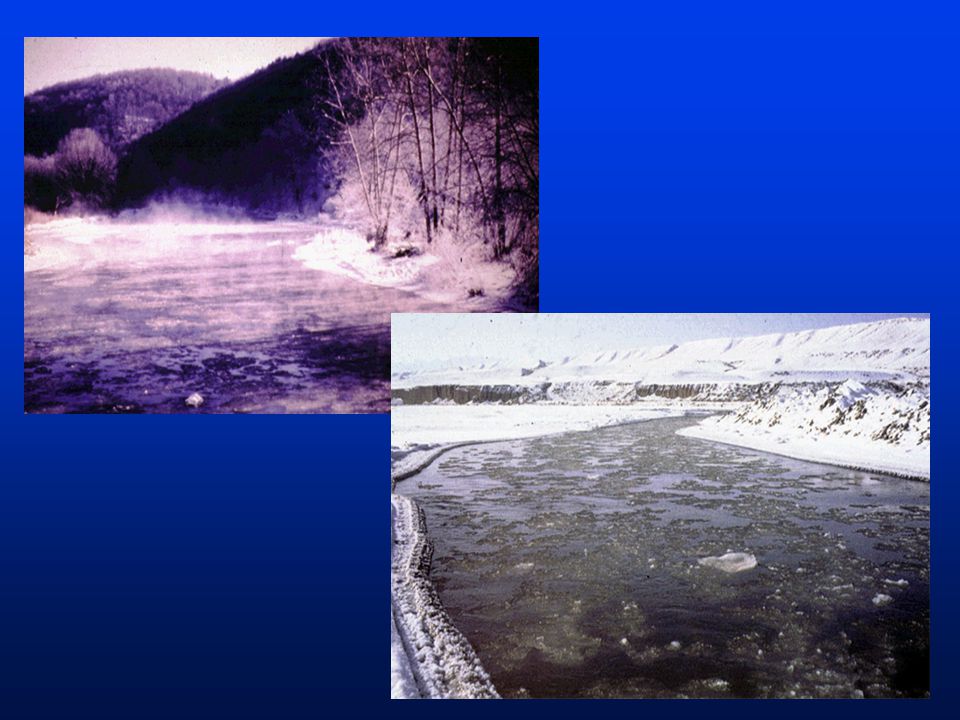
Frazil Ice Formation Formed only in areas of open water
Formed in turbulent water Flow velocity Wind mixing Formed in supercooled water -.01°C to -.02°C

12
Formation of Ice in Quiescent Water
Start with an (ideal) quiescent parcel of water losing heat to the air Heat loss stratifies water due to temperature dependence of water density. Remember that water is most dense at 39F (4C) Substantial gradients of temperature can exist with coldest water at the surface. Maximum temperature at depth: 4C
 quiescent parcel of water losing heat to the air. Heat loss stratifies water due to temperature dependence of water density. Remember that water is most dense at 39F (4C) Substantial gradients of temperature can exist with coldest water at the surface. Maximum temperature at depth: 4C.")
13
Ice Cover Formation Static Ice Cover Formation
Typical of ponds, small lakes, and slow flowing rivers Dominated by thermal growth Air Heat transfer Ice Ice Growth Water Interface temperature always at the ice/water equilibrium temperature: 0C for freshwater.

14
Ice Cover Growth To model ice cover growth:
Various heat transfer modes Solar penetration of ice cover Insulating effects of snow cover Heat transfer from underlying waterbody Temperature profile within ice

15
Ice Cover Growth -Stefan Eq
To estimate ice cover growth Assume heat transfer linear function of difference between air and melting temperature Ignore solar penetration of ice cover Account for Insulating effects of snow cover through calibration Ignore heat transfer from underlying waterbody Assume linear temperature profile

16
Ice Cover Growth- Stefan equation:
Accumulated Freezing Degree Days

17
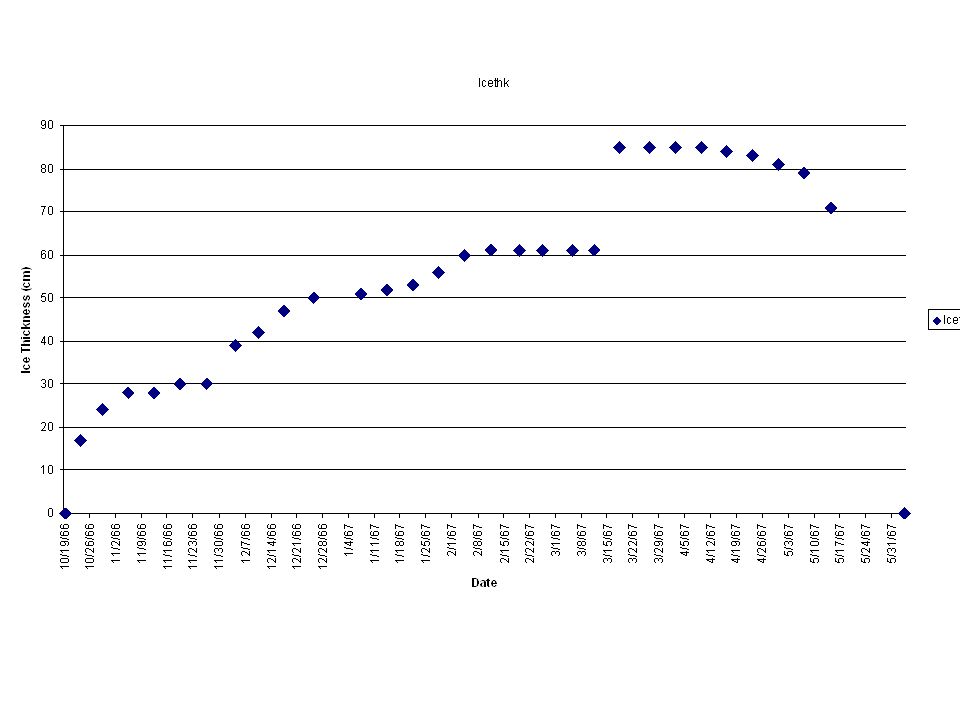
Ice Cover Growth AFDD: Accumulated Freezing Degree Days. The FDD for a single day is found by subtracting the mean temperature for the day from 0C (32F). The AFDD are found by summing the FDD for all days from the onset of freezing. FDD can be positive, if the mean temperature is below freezing, or negative (if the mean temp is above) Generally, the melting process is much more complicated than freezing. Table Ice Cover Condition * † Windy lake w/no snow Average lake with snow Average river with snow Sheltered small river * AFDD calculated using degrees Celsius. The ice thickness is in centimeters. † AFDD calculated using degrees Fahrenheit. The ice thickness is in inches.
. The AFDD are found. by summing the FDD for all days from the onset of freezing. FDD can be positive, if. the mean temperature is below freezing, or negative (if the mean temp is above) Generally, the melting process is much more complicated than freezing. Table. Ice Cover Condition * † Windy lake w/no snow Average lake with snow Average river with snow Sheltered small river * AFDD calculated using degrees Celsius. The ice thickness is in centimeters. † AFDD calculated using degrees Fahrenheit. The ice thickness is in inches.")
21
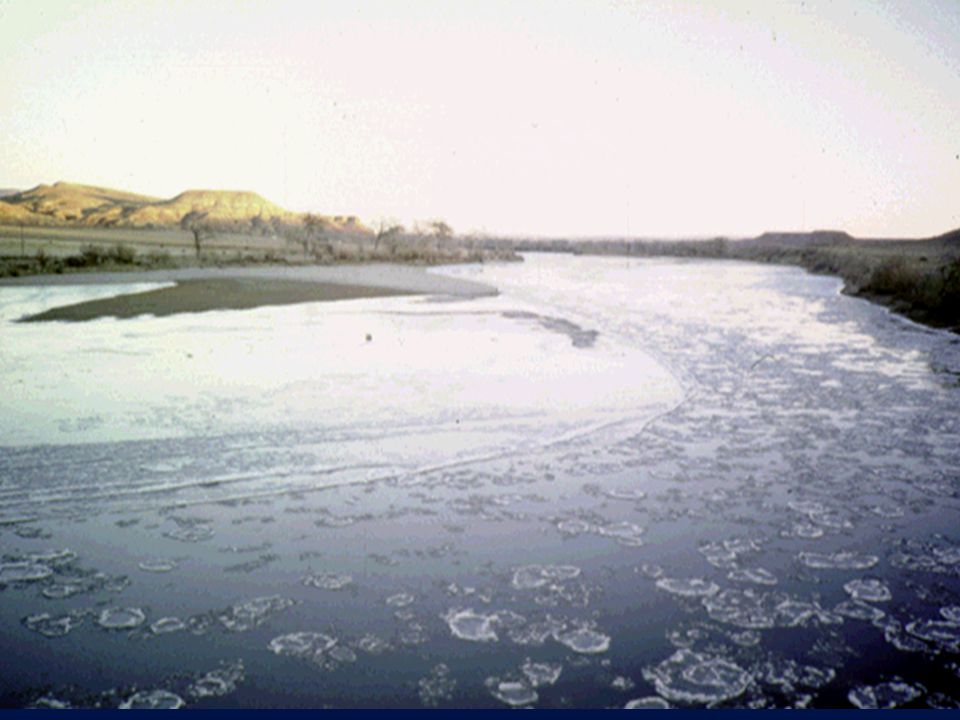
Grand Forks, ND

22
Problems with the ideal cases
Turbulent Gravity: Particles rise to the surface Flocculation: Particles bond together Deposition: Anchor ice Flow conditions change as ice is transported Quiescent Wind mixing Heat transfer from water Snow loading and flooding of the ice cover Quasi-steady assumption not appropriate

23
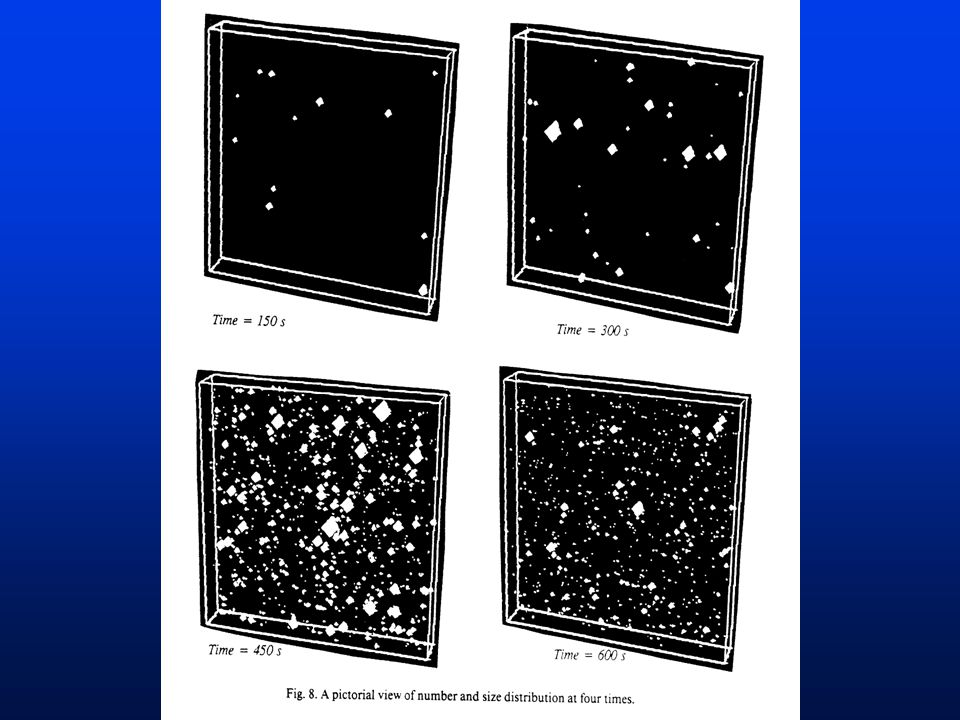
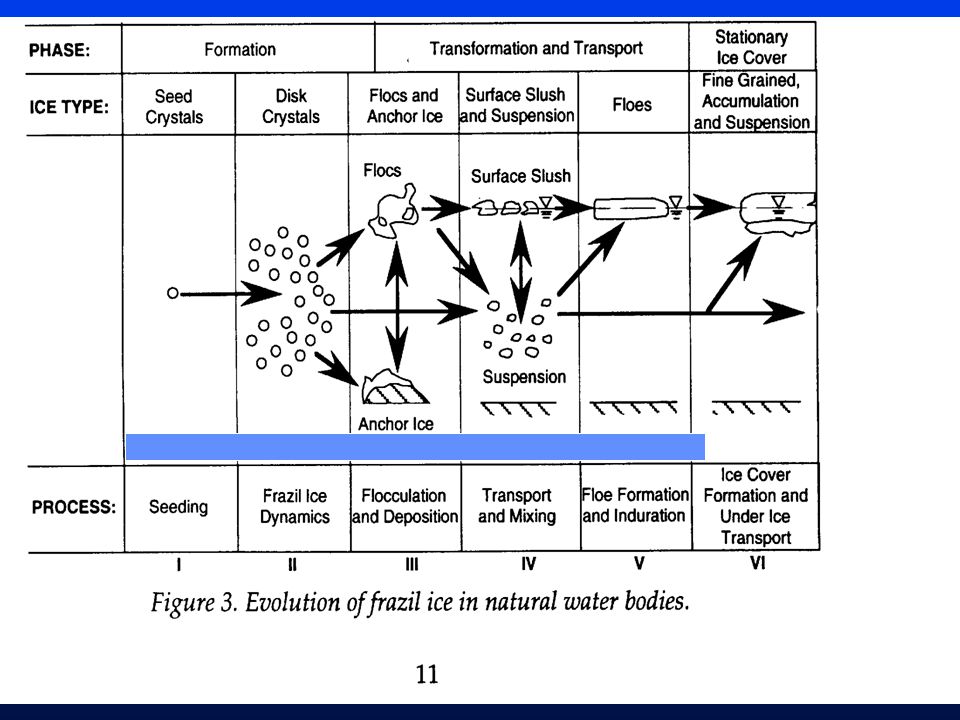
Evolution of frazil ice
Formation 1. Seeding. 2. Frazil ice dynamics. 3. Flocculation and Deposition. 4. Transport and Mixing 5. Floe formation and induration 6. Ice cover formation and under ice cover transport. Supercooled water, turbulence, the creation of disk crystals through secondary nucleation Transformation and transport Water at equilibrium. Frazil in the form of flocs, slush, floes, and anchor ice. Largely moving Stationary ice covers Fine grained ice. Can be quite large.

25
Ice Crystals Nucleated
FRAZIL ICE IN RIVERS Entrainment Seed Crystals Supercooled Water Surface Growth and Surface Flocculation Stable Ice Cover Deposited Slush Disks Buoyant Anchor Ice Transported Frazil Ice Crystals Nucleated in Cold Air

28
Frazil Slush

30
Anchor Ice Stationary Ice Covers Frazil Disks Frazil Slush Ice Pans
(Pancake ice) Large Floes ~width of channel Stationary Ice Covers Intermediate Form Final Form
 Large Floes. ~width of channel. Stationary Ice. Covers. Intermediate Form. Final Form.")
31
Anchor Ice

32
Anchor Ice

33
Anchor Ice Dominated by deposition of crystals
Thermal growth can occur but produces only small volumes Can be highly transitory - often breaks free of substrate at dawn Most stable in shallow, fast flowing streams Most observations suggest that it does not penetrate gravel very deeply Form of anchor ice is influenced by flow velocity Anchor ice dams

34
frazil ice blockage of water intake trash racks

35
If supercooled water is entering trash rack, frazil will adhere to
trash rack bars. Blockage will occur when ice can bridge between bars. Head loss with time

37
Frazil Evolution: Ice Floes
Frazil Slush Large Floes Frazil Slush Pancake Ice “Low Energy” “High Energy” Steep Rivers Large Waves Rivers with Mild Slopes Mountain Streams

41
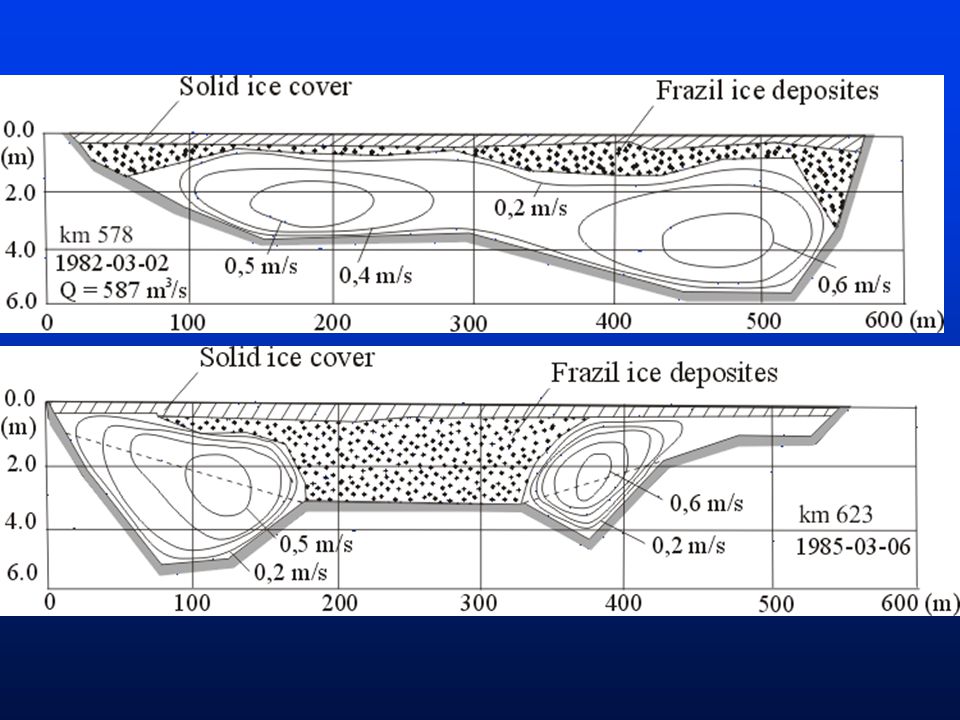
Border ice growth along river edge

43
Ice Cover Formation Dynamic Ice Cover Formation
Dominated largely by the interaction between ice floes and the flowing water An ice cover may initially form dynamically and later thicken due to thermal growth

44
Dynamic Ice Cover Formation
Froude Number Bridging Juxtaposition of Floes Underturning of floes Shoving of ice cover Under-ice transport No ice-cover progression Increasing flow Velocity Increasing flow depth

45
Juxtaposition of floes
Static analysis: The ice floe will underturn when the underturning moment produced by the water exceeds the maximum righting moment the block can produce

46
River Ice Covers Wide covers always float at hydrostatic equilibrium except under rare occasions Hydraulically river ice: Blocks flow area Reduces hydraulic radius (area/wetted perimeter) Modifies effective channel roughness (Manning’s n value) Additionally, river ice can Inter-act with “short” period waves
 Modifies effective channel roughness (Manning’s n value) Additionally, river ice can. Inter-act with short period waves.")
47
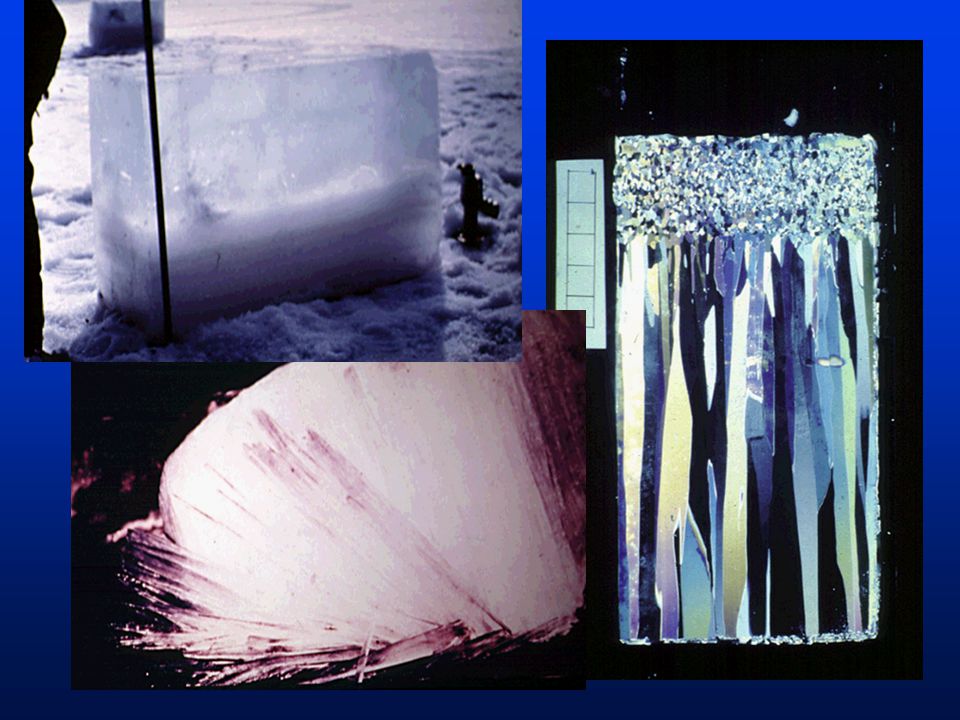
Ice Cover Crystal Structures
Fine grained ice Frazil or snow “White” ice Resists solar penetration Columnar ice Thermally grown “Black” ice Transparent, allows solar penetration,”candle ice”

49
Summary Ice formation Evolution of river ice Formation of ice covers

50
River Ice Hydraulics Additional stationary boundary
Modifies vertical flow profile Changes flow conditions Flow Area Hydraulic Radius Hydraulic Roughness Ice cover has mass and stiffness Resists bending and vertical motion Potential impact on wave propagation

54
Changes in vertical profile
Modifies discharge calculations Modifies vertical transport Temperature Trace materials sediment Shear stress distribution around boundaries

55
Ice cover has mass and stiffness
The mass and stiffness of an ice cover impacts only relative short waves Order of the characteristic length of the ice cover Period of a few seconds We usually don’t measure such waves In flow calculations we can ignore the mass & stiffness and assume the ice is always floating. NO PRESSURIZED FLOW

56
Wave Velocity Ice Covered vs. Open
Relatively short ~ characteristic length (2/L)
")
57
Manning’s Equation with Ice
B d In practice: River ice covers are always floating at hydrostatic equilibrium. Or more exactly Non-hydrostatic pressure will always be temporary and relatively short lived and for practical applications can be ignored.

58
Manning’s Equation Substituting the expression for Manning’s n we arrive at the Manning equation for steady flow, expressed for the flow velocity or the total discharge, Q

59
Manning’s Equation with Ice: Area and Hydraulic Radius
B d Adjust the terms of the Manning’s equation to account for the presence of ice Recall that for open water R ~ d

60
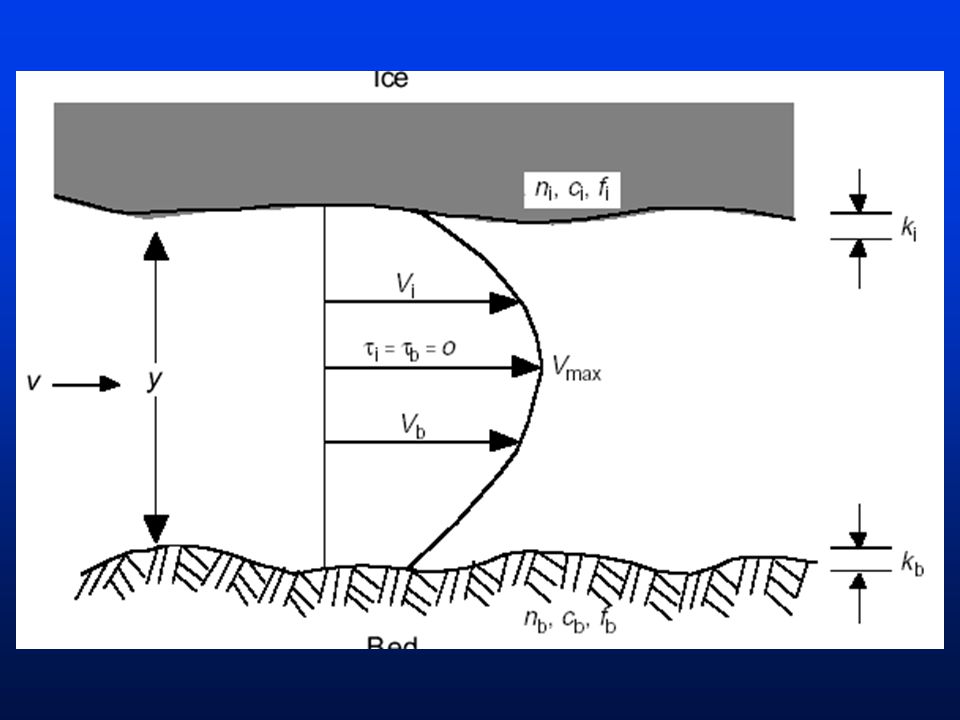
Composite Roughness value
Ice region Bed region Max velocity Velocity Profile under steady flow conditions If we assume that the average flow velocity in the ice region and the bed region are equal; And we assume Manning’s equation applies to each; And we assume the energy grade line is the same in both; ni nb Sabaneev Formula

61
Type of Ice Condition Manning’s n value
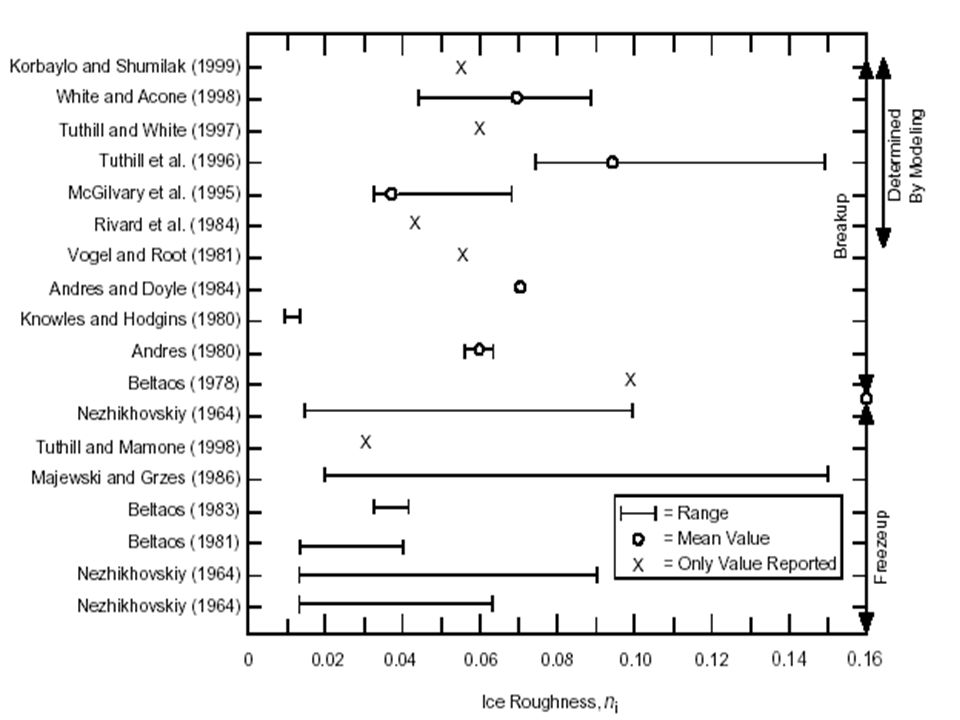
Suggested Range of Manning’s n Values for Ice Covered Rivers The suggested range of Manning’s n values for a single layer of ice Type of Ice Condition Manning’s n value Sheet ice Smooth to 0.012 Rippled ice to 0.03 Fragmented single layer to 0.025 Frazil ice New 1 to 3 ft thick to 0.03 3 to 5 ft thick to 0.06 Aged to 0.02

62
The suggested range of Manning’s n values for ice jams
Thickness Manning’s n value ft Loose frazil Frozen frazil Sheet ice The suggested range of Manning’s n values for ice jams

64
Manning’s Equation with Ice for Rectangular Channels
Same form as open water. Modify Roughness coefficient Flow area Hydraulic Radius

65
Manning’s Equation with Ice for Rectangular Channels
Open water Ice Covered Potential 32% increase in total depth due to ice cover at uniform flow

66
Partially Covered Rivers

67
Practical Implications of River Ice Hydraulics
Open water rating curve is not accurate Relationship between discharge and stage can change continuously as ice cover evolves Stage Up Stage Down Anchor ice Examples from Stuart Hamilton, Environment Canada

68
Stage-up A good place to study stage-up processes is on the Fraser river, as shown on the map. Flows from high elevation continental climate to coastal climate. Flows north before it heads south Fraser at Red Pass is ice-free year round, groundwater fed South Fort George is below the confluence with the Nechako Upper fraser timing of stage-up is typical upstream migration from Shelley Lower Fraser sequence is in reverse – downstream freezes last Valid open water downstream data to validate and quantify magnitude and duration of discharge depressions Dan Moore and Taha are now working with this data to answer a variety of questions

69
Stage-down Everybody knows about stage-up discharge depressions, but how many of you have seen evidence in support of a stage-down discharge enhancement. It follows that all of the water lost to storage at stage-up must be found again in the spring, but the signal is usually lost in noisy data at break-up.

70
Stage-down Another example of a stage-down discharge enhancement

71
Anchor Ice

72
Hanging frazil dams Hanging frazil dams can be quite transient, accumulating and then disappearing. Often they can disappear before the first winter measurement so there is no record of them for some streams, however, they add a lot of uncertainty to the interpretation of stage data for the purpose of discharge estimation.

73
Summary Ice formation Evolution of river ice Formation of ice covers
River Ice Hydraulics

Similar presentations


 Chapter 9: FLOWS IN PIPE>")


