Download presentation
Presentation is loading. Please wait.

1
Lecture 1 INTRODUCTION TO INSTRUMENTAL ANALYSIS Copyright ©The McGraw-Hill Companies, Inc. Permission required for reproduction or display.

2
INTRODUCTION OUTLINE: CLASSIFICATION OF ANALYTICAL METHODS TYPES OF INSTRUMENTAL METHODS INSTRUMENTS FOR ANALYSIS SELECTING AN ANALYTICAL METHOD CALIBRATION OF AN INSTRUMENTAL METHODS

3
Problem set: 1-4, 1-9, 1-10, 1-11

4
CLASSIFICATION OF ANALYTICAL METHODS Classical vs Instrumental Qualitative instrumental analysis is that measured property that indicates presence of analyte in matrix Quantitative instrumental analysis is that magnitude of measured property that is proportional to concentration of analyte in matrix Species of interest All constituents including analyte. Often need pretreatment - chemical extraction, distillation, separation, precipitation

5
INTRODUCTION CLASSICAL: Qualitative - identification by color, indicators, boiling points,odors Quantitative - mass or volume (e.g. gravimetric, volumetric) INSTRUMENTAL: Qualitative - chromatography, electrophoresis and identification by measuring physical property (e.g. spectroscopy, electrode potential) Quantitative - measuring property and determining relationship to concentration (e.g. spectrophotometry, mass spectrometry). Often, same instrumental method used for qualitative and quantitative analysis.
 INSTRUMENTAL: Qualitative - chromatography, electrophoresis and identification by measuring physical property (e.g. spectroscopy, electrode potential) Quantitative - measuring property and determining relationship to concentration (e.g. spectrophotometry, mass spectrometry). Often, same instrumental method used for qualitative and quantitative analysis..")
6
TYPES OF INSTRUMENTAL METHODS PROPERTYEXAMPLE METHOD Radiation EmissionEmission spectroscopy - fluorescence, phosphorescence, luminescence Radiation AbsorptionAbsorption spectroscopy - spectrophotometry, photometry, nuclear magnetic resonance, electron spin resonance Radiation ScaterringTurbidity, Raman Radiation RefractionRefractometry, interferometry Radiation DiffractionX-ray, electron Radiation RotationPolarimetry, circular dichroism

7
TYPES OF INSTRUMENTAL METHODS PROPERTYEXAMPLE METHOD Electrical PotentialPotentiometry Electrical ChargeCoulometry Electric CurrentVoltammetry - amperometry, polarography Electrical ResistanceConductometry MassGravimetry Mass-to-charge RatioMass spectrometry Rate of ReactionStopped flow, flow injection analysis Thermal CharacteristicsThermal gravimetry, calorimetry RadioactivityActivation, isotope dilution Often combined with chromatographic or electrophoretic methods

8
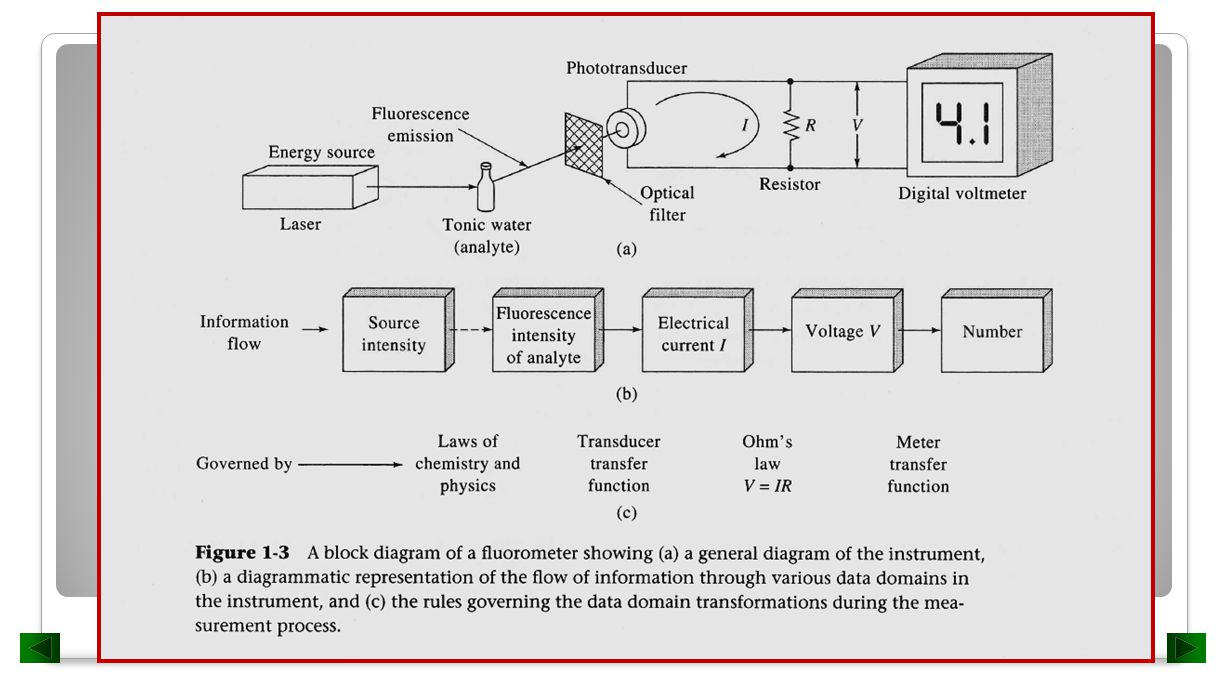
INSTRUMENTS FOR ANALYSIS Example:spectrophotometry Instrument: spectrophotometer Stimulus: monochromatic light energy Analytical response: light absorption Transducer: photocell Data: electrical current Data processor: current meter Readout: meter scale Block diagram for the overall process of instrumental measurement.

9
INSTRUMENTS FOR ANALYSIS DATA DOMAINS: way of encoding analytical response in electrical or non-electrical signals. Interdomain conversions transform information from one domain to another. Detector : device that indicates change in environment Transducer : device that converts non-electrical to electrical data Sensor : device that converts chemical to electrical data

10
INSTRUMENTS FOR ANALYSIS: DOMAINS NON-ELECTRICAL DOMAINSELECTRICAL DOMAINS Physical (light intensity, color)Current (Analog) Chemical (pH)Voltage (Analog) Scale Position (length)Charge (Analog) Number (objects)Frequecy (Time) Pulse width (Time) Phase (Time) Count (Digital) Serial (Digital) Parallel (Digital) Time: vary with time (frequency, phase, pulse width) Analog: continuously variable magnitude (current, voltage, charge) Digital: discrete values (count, serial, parallel, number*)
Current (Analog) Chemical (pH)Voltage (Analog) Scale Position (length)Charge (Analog) Number (objects)Frequecy (Time) Pulse width (Time) Phase (Time) Count (Digital) Serial (Digital) Parallel (Digital) Time: vary with time (frequency, phase, pulse width) Analog: continuously variable magnitude (current, voltage, charge) Digital: discrete values (count, serial, parallel, number*)")
12
Advantages: (1) easy to store (2) not susceptible to noise DIGITAL BINARY DATA
 easy to store (2) not susceptible to noise DIGITAL BINARY DATA")
13
What accuracy is required? How much sample is available? What is the concentration range of the analyte? What components of the sample will cause interference? What are the physical and chemical properties of the sample matrix? How many samples are to be analyzed? DEFINING THE PROBLEM

14
Performance Characteristics: Figures of Merit How to choose an analytical method? How good is measurement? How reproducible? - Precision How close to true value? - Accuracy/Bias How small a difference can be measured? - Sensitivity What range of amounts? - Dynamic Range How much interference? - Selectivity SELECTING AN ANALYTICAL METHOD

15
INDETERMINATE OR RANDOM ERRORS FIGURES OF MERIT: PRECISION

16
FIGURES OF MERIT: ACCURACY DETERMINATE ERRORS (operator, method, instrumental)
")
17
FIGURES OF MERIT: SENSITIVITY (larger slope of calibration curve m, more sensitive measurement)
")
18
Signal must be bigger than random noise of blank FIGURES OF MERIT: DETECTION LIMIT

19
At detection limit we can say confidently analyte is present but cannot perform reliable quantitation Level of quantitation (LOQ): k=10 Limit of linearity (LOL): when signal is no longer proportional to concentration FIGURES OF MERIT: DYNAMIC RANGE
: k=10 Limit of linearity (LOL): when signal is no longer proportional to concentration FIGURES OF MERIT: DYNAMIC RANGE")
20
No analytical method is completely free from interference by concomitants. Best method is more sensitive to analyte than interfering species (interferent). k's vary between 0 (no selectivity) and large number (very selective). FIGURES OF MERIT: SELECTIVITY
. k s vary between 0 (no selectivity) and large number (very selective). FIGURES OF MERIT: SELECTIVITY.")
21
Basis of quantitative analysis is magnitude of measured property is proportional to concentration of analyte CALIBRATION METHODS

22
CALIBRATION CURVES (WORKING or ANALYTICAL)
")
23
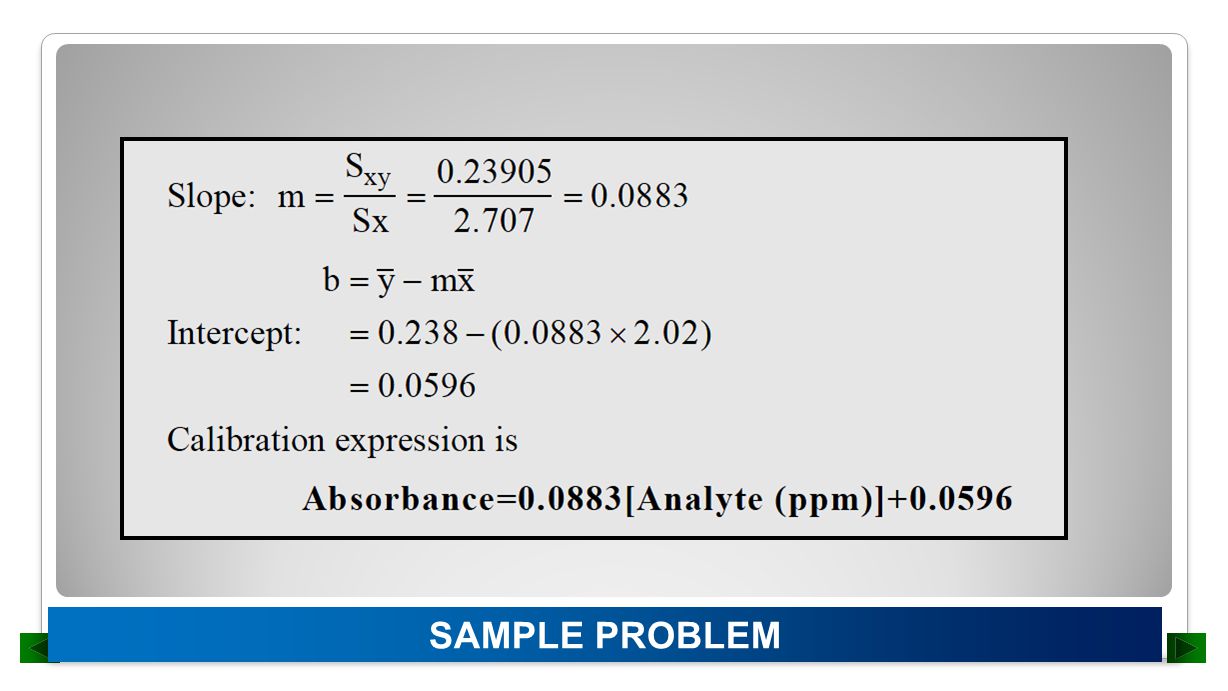
SAMPLE PROBLEM:

24
SAMPLE PROBLEM

26
Calibration Curves: several standards containing exactly known concentrations of the analytes are introduced into the instrument and the response is recorded. CALIBRATION OF INSTRUMENTAL METHODS

27
STANDARD ADDITION METHOD

28
An internal standard is added in constant amount to samples, blanks, and calibration. The analyte to internal standard signal as a function of the analyte concentration is determined. The ratio for the samples is then used to obtain their analyte concentrations from a working curve. INTERNAL STANDARD METHOD

29
TRANSFORMATION OF ALKENES AND ALKYNES

Similar presentations


>")


 What accuracy and precision are required? How much sample do I have available,>")


 Last time we discussed what spectroscopy was, and how we could use the interaction of light with atoms and molecules to measure.>")


