Download presentation
Presentation is loading. Please wait.

2
SAARF and defining & measuring audiences

3
Why SAARF does this: Seeks relationships between: – Who people are – What they consume – What media they follow. Not interested in uses & grats; ethnography; qualttive qtns.

4
Basic assumptions 1. Samples are representative. BUT: taken over what period? Now over 1 year: – AMPS & RAMS have 30 474 – TAMS has 3549. Averages out seasonal change.

5
Nguni/Sotho Adult: Any TV Viewing Old Universe up to Week 42 - New incl. DSTV for Weeks 43 - 13 COMRADES OLYMPIC GAMES SOCCER CHARITYCUP +3 COMBINATION SOCCER & MARTIAL ARTS WORLD CUP QUALIFIER SA vs MALAWI

6
Basic assumptions 2. Reading, viewing, etc. can be averaged out to mean the same thing: OTS (opp 2 see) All OR part of edition/programme. 3. Stim->resp (effects model) 4. Passive, fragmented audience.
 All OR part of edition/programme. 3. Stim->resp (effects model) 4. Passive, fragmented audience..")
7
Used for predicting 5. Assumption is that patterns and trends of the past can help predict the future. 6. Assumption that demographics = behaviour 7. Assumption ignores aspirations and new markets

8
How SAARF surveys: Methods Not the NY sewers Not the Poynter eyetrack Not the Media Effects lab (PSU) Interview questionnaire: –Prompt card (Comp Ass Pers Intv) –Self-completed section:155 FMCG
 Interview questionnaire: –Prompt card (Comp Ass Pers Intv) –Self-completed section:155 FMCG")
9
More methods A diary for extra info on radio listening habits over 7 days. Electronic meters for extra info on TV viewing habits. Works via remote cntrl. (24 hrs) No focus groups or ethnographic study
 No focus groups or ethnographic study.")
10
TAMS Top TV stations: –sabc 1: 48.5% –sabc 2: 18.2% –etv: 14.2% –sabc 3: 9.4% –mnet: 6.1% –dstv: 2.8%

11
Amps Rating (AR) Proportion of viewers watching a show, multiplied by total numbers watching TV at that point in time. Excludes less than 20 secs viewing, and deferred (videotaped viewing).
..")
12
TAMS sampling 3549 individuals between 30 July & 5 Aug Represents 11 445 000 adults. Demographics = SA gender. Disproportions: race; age; income.

13
ADULTS Current Male 44,1% Female 55,9 English 14,2 Afrikaans 29,1 Nguni 32,3 Sotho 24,5 16-24 24,2 25-34 20,4 35-4926,3 Sample Current Reporting Profile

14
ADULTS Current 50+29,1 Income H33,1 Income M42,5 Income L24,5 LSM 1-4,7 (BUT 56% of SA) LSM 515,6 LSM 640,6 LSM 724,0 LSM 819,0 Current Reporting Profile
 LSM 515,6 LSM 640,6 LSM 724,0 LSM 819,0 Current Reporting Profile")
15
TAMS difficulties: Eurometer has facility to change TV channels, to mimic procedures in households not having a RCU The meter RCU is then used to log in & out only [..but remember VCR tuning with RCU - in that case we install meter tuning with RCU]
![TAMS difficulties: Eurometer has facility to change TV channels, to mimic procedures in households not having a RCU The meter RCU is then used to log in & out only [..but remember VCR tuning with RCU - in that case we install meter tuning with RCU]](http://images.slideplayer.com/20/6012279/slides/slide_15.jpg "TAMS difficulties: Eurometer has facility to change TV channels, to mimic procedures in households not having a RCU The meter RCU is then used to log in & out only [..but remember VCR tuning with RCU - in that case we install meter tuning with RCU]")
16
QUOTE: It became clear during February that our technicians were not up to task Deficiencies apparent in : Call back/response rate to handle problems was too low. Centralised technician centres in J’Burg, Cape Town & Durban were not suited to a 1500 household panel. Problem of satellite reception analysis.

17
AMPs Difficulties Interviews: need to check back (31%) Selective & faulty memories. Self-completed: fall off. Frankness, honesty, hype - who of you admits to reading “You” magazine?

18
Rams difficulties 30 474 diary keepers in past year - but how representative, given the radio proliferation? 15 499 are metropolitan, but which adult controls the station in the household?

19
How Saarf defines profiles LSMs: living stds measure. Market research tool: “currency” Segments people in terms of a cluster of 25 qtn variables & 4 observation ones.

20
Example LSM 1 Black females, over 50, rural. Low schooling, live in hut No financial services Minimal consumption or shopping.

21
LSMs in society

23
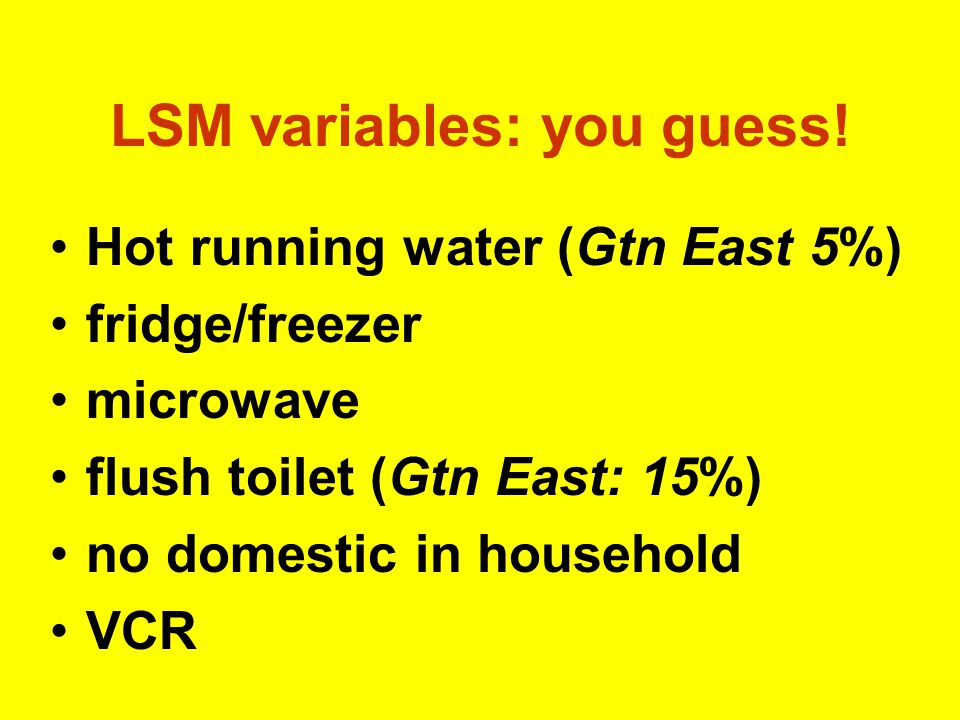
LSM variables: you guess! Hot running water (Gtn East 5%) fridge/freezer microwave flush toilet (Gtn East: 15%) no domestic in household VCR
 fridge/freezer microwave flush toilet (Gtn East: 15%) no domestic in household VCR.")
24
LSM variables cntd Vacuum cleaner No cellphone Traditional hut Washing machine PC in home

25
LSM variables cntd Electric stove TV set Tumble dryer Home phone less than 2 radio sets

26
LSM variables cntd Hi-fi, music centre Rural outside Gautng, W. Cape Built in kitchen sink Deep freeze Water in home/on plot Mnet/DSTV subscription

27
LSM variables cntd Dishwasher electricity sewing machine Gauteng Western Cape Motor vehicle Home security service

28
MAGAZINES BY LSM - 1

29
ACCESS TO SERVICES + : Significant increase * : Significant decrease

30
DURABLES IN HOME + : Significant increase * : Significant decrease

31
CELLPHONE MARKET

32
INTERNET USAGE 4 Weeks

33
ACTIVITIES - STARTING OUT SINGLES

34
ACTIVITIES - NEW PARENTS

35
ACTIVITIES - GOLDEN NESTS

36
BOUGHT LOTTERY TICKETS - 1 Gender Age 13 255 000 adults (45.7%) purchased lottery tickets in 4 weeks
 purchased lottery tickets in 4 weeks")
37
BOUGHT LOTTERY TICKETS - 2 Population Group LSM Group 13 255 000 adults (45.7%) purchased lottery tickets in 4 weeks
 purchased lottery tickets in 4 weeks")
38
There’s loads of info about audiences in AMPS …

39
But there is also much more to audiences than AMPS!

40
Be aware of their assumptions and rationale and limitations.

Similar presentations