Download presentation
Presentation is loading. Please wait.

2
The Nature of Geographic Data Based in part on Longley et al. Ch. 3 and Ch. 4 up to 4.4 (Ch. 4 up to 4.6 to be covered in Lab 8) Library Reserve #VR 100
 Library Reserve #VR 100.")
3
Data Models: fields and objects are no more than conceptualizations, or ways in which we think about geographic phenomena. They are NOT always designed to deal with the limitations of computers. Field & Object Data Models Data Structures: methods of representing the data model in digital form w/in the computer Raster and Vector Data Structures Data Models and Data Structures

4
Bears are easily conceived as discrete objects, maintaining their identity as objects through time and surrounded by empty space. (Hal Gage/Alaskastock/Photolibrary Group Limited)
.")
5
Example of representation of geographic information as a table. The locations and attributes are for each of four grizzly bears in the Kenai Peninsula of Alaska. Locations, in degrees of longitude and latitude, have been obtained from radio collars. Only one location is shown for each bear, at noon on July 31, 2000. The discrete object view leads to a powerful way of representing geographic information about objects

6
An Object Model uses a Vector (Arc/Node) Data Structure Object data model evolved into the arc/node variation in the 1960s. Points in sequence build lines. Lines have a direction - nodes or ordering of the points. Lines in sequence build polygons.

7
Vectors (Arcs) and Topology Vectors without topology are “spaghetti” structures. Points, lines, and areas stored in their own files, with links between them. stored w/ topology (i.e. the connecting arcs and left and right polygons). Relationships are computed and stored
. Relationships are computed and stored.")
8
2, -7, 5, 6 Connectedness, Adjacency, Contiguity, Geo-Relational

9
Topology Science and mathematics of geometric relationships Simple features + topological rules Connectivity Adjacency Shared nodes / edges Topology needed by Data validation Spatial analysis (e.g., network tracing, polygon adjacency)
")
10
Why Topology Matters Topological data structures very important in GIS software. Allows automated error detection and elimination. “Tolerances” important - features can move or disappear “snapping”, elimination, merging, etc. Makes map overlay feasible. Makes other kinds of spatial analysis possible.

11
Nodes that are close together are snapped.

12
An area (solid line) and its approximation by a polygon (dashed line)
 and its approximation by a polygon (dashed line)")
13
Raster representation: Bathymetry

14
Each color represents a different value of an integer variable denoting land cover class Raster representation

15
Object/Vector Feature Types

16
Example of a BOUNDARY PROBLEM: Lakes are difficult to conceptualize as discrete objects because it is often difficult to tell where a lake begins and ends, or to distinguish a wide river from a lake. (Oliviero Olivieri/Getty Images, Inc.)
.")
18
Effect of a raster representation using: “Boundary Problem” Handled by Mixed Pixels (A) the largest share rule (B) the central point rule
 the largest share rule (B) the central point rule")
19
Rasters and Vectors Vector-based line 4753456 623412 4753436 623424 4753462 623478 4753432 623482 4753405 623429 4753401 623508 4753462 623555 4753398 623634 Flat File Raster-based line 0000000000000000 0001100000100000 1010100001010000 1100100001010000 0000100010001000 0000100010000100 0001000100000010 0010000100000001 0111001000000001 0000111000000000 0000000000000000 Flat File Now YOU!

20
Issues w/ Raster & Vector

21
“Rasters are faster, but vectors are correcter” What about a compromise? a TIN can be used to represent surfaces.

22
TIN: Triangulated Irregular Network Based on the Delaunay triangulation model of a set of irregularly distributed points. Way to handle raster data with the vector data structure. Common in most GISs. More efficient than a grid.

23
triangulation Courtesy www.ian-ko.com/resources/triangulated_irregular_network.htm TIN surface pseudo 3D

24
Spatial Autocorrelation Arrangements of dark and light colored cells exhibiting negative, zero, and positive spatial autocorrelation. Tobler’s 1st Law of Geography: everything is related to everything else, but near things are more related than distant things S. autocorrelation: formal property that measures the degree to which near and distant things are related. Close in space Dissimilar in attributes Attributes independent of location Close in space Similar in attributes

25
(A) coarse scale (B) finer scale In general, measures of spatial and temporal autocorrelation are scale dependent A Sierpinski carpet at two levels of resolution Spatial Autocorrelation and Scale
 coarse scale (B) finer scale In general, measures of spatial and temporal autocorrelation are scale dependent A Sierpinski carpet at two levels of resolution Spatial Autocorrelation and Scale")
26
Individual rocks may resemble the forms of larger structures, such as rock outcrops or eroded coastlines (© PauloFerreira/iStockphoto)
")
27
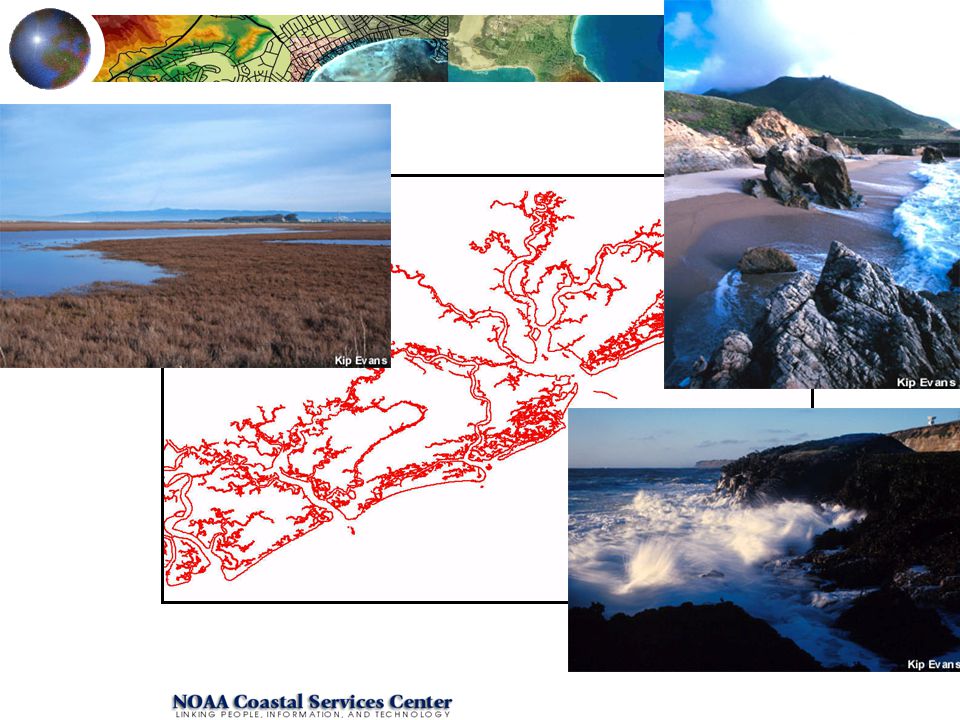
The coastline of Maine, at three levels of recursion… (A) the base curve of the coastline (B) approximation using 100-km steps (C) 50-km step approximation (D) 25-km step approximation.
 the base curve of the coastline (B) approximation using 100-km steps (C) 50-km step approximation (D) 25-km step approximation.")
28
Sampling: The Quest to Represent the Real World a spatially random sample a spatially systematic (stratified) sample a stratified random sample a sampling scheme with periodic random changes in the grid width of a spatially systematic sample Field - selecting discrete objects from a continuous surface Object - selecting some discrete objects, discarding others Spatially systematic sampling presumes that each observation is of equal importance in building a representation.
 sample a stratified random sample a sampling scheme with periodic random changes in the grid width of a spatially systematic sample Field - selecting discrete objects from a continuous surface Object - selecting some discrete objects, discarding others Spatially systematic sampling presumes that each observation is of equal importance in building a representation.")
29
Spatial Interpolation: “Intelligent Guesswork” the process of filling in the gaps between sample observations. Tobler’s law - nearer things are key, in a smooth, continuous fashion Pollution from an oil spill Noise from an airport, etc Effect of distance between sample observations

30
(Artificial) Smooth & Continuous Variation: contours equally spaced, along points of equal elevation
 Smooth & Continuous Variation: contours equally spaced, along points of equal elevation")
31
Is Variation in Nature Always Smooth and Continuous? Graduate Student’s Corollary to Tobler’s 1st Law of Geography “The real world is infinitely complex, so why bother?” IDW - nearer points given more importance Sampling still important!!! Many other interpolation methods and functions

32
An Example from ArcGIS

33
Examine Attributes of Points

34
Choose Interpolation Parameters

35
IDW Interpolation

36
Hillshade ( hypothetical illumination ) to Better Visualize
 to Better Visualize")
37
Another set of sample points

38
Examine Attributes

39
Same Interpolation Parameters

40
Same IDW Interpolation ( but higher elevations skewed to right )
")
41
Hillshade

42
Comparison

Similar presentations


 John Wiley and Sons Ltd 9. Geographic Data Modeling.>")

 John Wiley and Sons Ltd 7. Generalization, Abstraction,>")


? A GIS is a particular form of Information System applied to geographical.>")
 September 5, 2006 SGO1910 & SGO4030 Fall 2006 Karen O’Brien Harriet Holters Hus, Room 215>")


 Overview Map as Numbers… an Abstraction of Space Database Management System for Attributes.>")

