Download presentation
Presentation is loading. Please wait.

1
Akrati Johari, Steven Kahan, Prashant Tiwari, and Yana Zalukina Presented, December 8, 2009

2
Industry Analysis Mosaic (MOS) belongs to Agricultural Chemical Manufacturing industry In the U.S. – about 700 companies with combined annual revenue of $30 billion Highly concentrated industry: ◦ 8 largest phosphate fertilizer producers generate 90% of revenues in the segment Demand for agri-chemicals depends mainly on demand for various crops, and thus crop prices. http://www.hoovers.com/c hemical-manufacturing--- agricultural-/--ID__161-- /freeuk-ind-fr-profile- basic.xhtml

3
Company Overview Headquarters: Plymouth, MN Industry: Agricultural Chemicals World's largest phosphate producer: makes agricultural fertilizer out of potash and phosphate 13% share of global phosphate and potash production and 58% & 40% share of American production, respectively http://finance.yahoo.com/q/ pr?s=MOS

4
Business Segments Three segments: Phosphates, Potash, and Offshore. ◦ Phosphates Produces and sells phosphate crop nutrients for use in crop nutrients and feed phosphate for animal feed ingredients ◦ Potash Produces and sells potash for use as fertilizers and animal feed ingredients, as well as in industrial applications Potash is also used for de-icing and as a water softener regenerant ◦ Offshore Mosaic used to produce nitrogen fertilizer until selling its interest in Saskferco Products ULC at a $673.4 million gain in fiscal 2009. This was always a relatively small part of the company’s business. http://www.wikinvest.com/st ock/Mosaic_Company_(MOS)
.")
5
Mosaic's temporary decline in phosphate profitability was due to unfavorable pricing of sulfur and ammonia, which should be viewed as an abnormal occurrence. http://www.wikinvest.com/i mage/MOS_opincbreakdown. gif (accessed Dec. 7, 2009).
..")
6
SWOT Analysis STRENGTHSWEAKNESSES Foreign operations Economies of scale MOS & POT – duopolies in fertilizer market – price control High barriers to entry and industry is capital-intensive Subject to financial assurance requirements as part of the routine business operations -> increases costs & liquidity requirements. Crop nutrient business is seasonal -results in carrying significant amounts of inventory & NWC Inability to predict future seasonal crop nutrient demand accurately Location of international assets in countries with volatile conditions OPPORTUNITIESTHREATS Increase in demand for biofuels (require corn fertilizers) Increased demand for food but low farm acreage leads to increase in demand for fertilizers Moderate drought conditions will increase demand for Mosaic’s products Lower relative value of the US dollar Lower gas prices Competitors announced plans to expand capacity of phosphate production over next few years SEC investigation for breaching Antitrust Legislation Under investigation by the Environmental Protection Agency and the Department of Justice for its role in unlawful pollution in Florida
 Increased demand for food but low farm acreage leads to increase in demand for fertilizers Moderate drought conditions will increase demand for Mosaic’s products Lower relative value of the US dollar Lower gas prices Competitors announced plans to expand capacity of phosphate production over next few years SEC investigation for breaching Antitrust Legislation Under investigation by the Environmental Protection Agency and the Department of Justice for its role in unlawful pollution in Florida.")
7
Management Assessment Mosaic acquired Esterhazy, Saskatchewan potash mine in late 2006 "This successful expansion, both in terms of the cost and additional capacity, underscores our strong commitment to cost-effectively grow our Potash business” Jim Prokopanko, CEO Mosaic plans to add approximately 200,000 metric tonnes of incremental capacity at its Colonsay, Saskatchewan mine by 2010.

8
Mosaic has few competitors since the fertilizer industry has significant barriers to entry and economies of scale. It would cost from $1.6-$2.5B for a new company to enter the industry. A company would need five to seven years of development time to build mines and factories, build rail and gas lines, and purchase rail cars and storage before it could even begin making a profit from Potash or Phosphates. Mosaic primarily competes: ◦ Potash Corporation of Saskatchewan (POT) ◦ Agrium (AGU) http://www.wikinvest.com/ (Accessed December 5, 2009
 ◦ Agrium (AGU) (Accessed December 5,")
9
http://www.wikinvest.com/ (Accessed December 5, 2009

10
Leading Fertilizer Producers 2008 Financial Comparison CompanyRevenue Net Income Profit Margin Operating Margin Potash Corporation of Saskatchewan (POT) $9.4 B$3.5 B37.00%49.07% Mosaic Company$9.8 B$2.1 B21.232%28.60% Agrium (AGU)$10.3 B$1.3 B12.87%19.34% http://www.wikinvest.com/ (Accessed December 5
 $9.4 B$3.5 B37.00%49.07% Mosaic Company$9.8 B$2.1 B21.232%28.60% Agrium (AGU)$10.3 B$1.3 B12.87%19.34% (Accessed December 5")
11
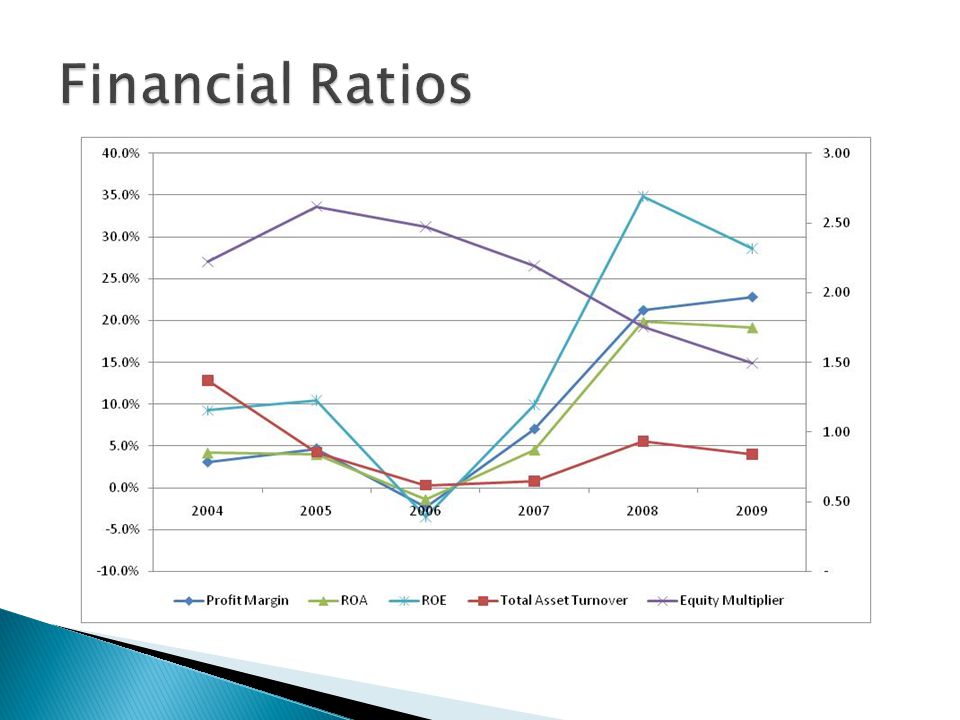
CompanyROEProfit Margin Asset Turnover Financial leverage Mosaic Co. (MOS)15.58%17.03%0.841.16 Potash Corporation of Saskatchewan (POT)27.43%34.48%0.941.38 Agrium (AGU)10.49%4.78%1.281.39 http://finance.yahoo.com/ (Accessed December 5
15.58%17.03% Potash Corporation of Saskatchewan (POT)27.43%34.48% Agrium (AGU)10.49%4.78% (Accessed December 5.")
12
http://finance.yahoo.com/ (Accessed December 5, 2009

16
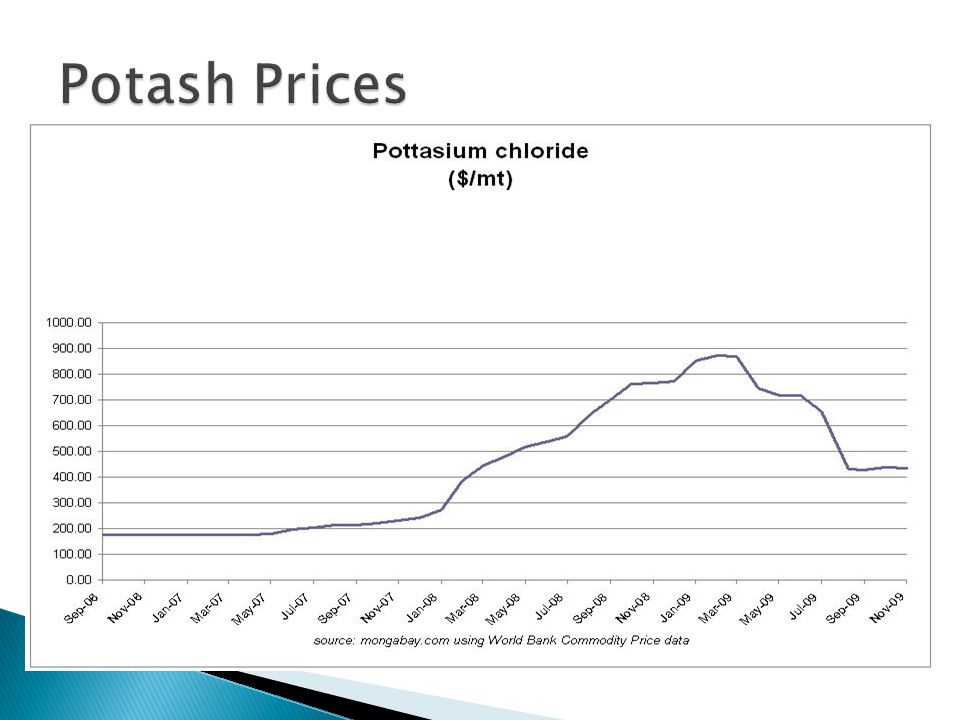
Data for 2008 are actual and data for 2009-2020 are price forecasts Forecasts prepared on June 3, 2009 by World Bank. (http://web.worldbank.org) 200820092010201120152020 DAP, $/mt 967.2350.0300.0310.0360.0400.0 Potash, $/mt 570.1750.0400.0300.0255.0220.0

17
yield to maturity5.975% due 12/15/2011 2-year T-Note0.84% 10-year T-Note3.48% spread2.64% cost of debt8.62%

18
weight of equity88.62% weight of debt11.38% tax rate23.43% CAPM WACC10.40% ROE WACC47.89% Goalpost WACC14.15%

19
Company Ticker Share Price @ 11/26/09 Market Cap Trailing P/E Price/ Sales Price/ Book Mosaic Co.MOS55.9824.91B19.733.242.8 Agrium Inc.AGU56.718.90B19.410.891.89 Potash Corp of SaskatchewanPOT114.1833.78B22.727.465.67 Trailing P/EPrice/SalesPrice/Book Low 19.410.891.89 Average 21.074.183.78 High 22.727.465.67 http://finance.yahoo.com/ (Accessed November 26, 2009)
")
20
Mosaic Company Multiples Valuation (Continued) Earning per share2.84 Revenue per share16.724 Book value per share19.306 Diluted shares444.94m Current Share Price: $58.29 http://finance.yahoo.com/ (Accessed November 26, 2009) Stock Price Calculation Trailing P/EPrice/SalesPrice/BookDCF Min55.1214.8836.4955.52 Average59.8269.8272.9861.69 Max64.52124.76109.4767.86
 Earning per share2.84 Revenue per share Book value per share Diluted shares444.94m Current Share Price: $ (Accessed November 26, 2009) Stock Price Calculation Trailing P/EPrice/SalesPrice/BookDCF Min Average Max")
21
Football Chart

22
Triangulation Valuation MethodsStock PriceWeights DCF61.6970.00% Trailing P/E59.8210.00% Price/Sales69.8210.00% Price/Book72.9810.00% Triangulation Value$63.45

23
Correlation Mosaic American Eagle0.0699 Diamond Offshore0.4916 First Industrial0.0229 Jack Henry0.1338 Kimberly-Clark0.0925 McDonalds0.2752 Walgreens0.0438 MEMC Electronics0.4625 Low correlation with current holdings

24
Closing Price: $59.94 (12/7/09) DCF Value: $61.69 Triangulation Value: $63.45 Buy 200 shares at a limit price of $55 good through 12/31/09 Recommendation
 DCF Value: $61.69 Triangulation Value: $63.45 Buy 200 shares at a limit price of $55 good through 12/31/09 Recommendation")
Similar presentations


 NOVEMBER 7, 2013 Dan Ballantine, Zige He, and Zuowei Xu.>")
: $36.53 Sector Head: James Carlstedt Michael Metz Thomas Chadwick Cal- Maine Foods, Inc. (CALM:NASDAQ)>")
>")
 - Extremely high barriers.>")


. Industry Overview 2 Gold mining is capital intensive Capital is very expensive for small exploration and production.>")

>")
 Victor Murthi Vignesh Murali Wei Yan Date Presented: April 27 2010.>")

>")


 Presented by: Akrati Johari, Phil Nguyen, Iordanis Thomaidis, Charles Gambino and Michael Bellisario Date: 18 th March, 2010.>")
