Download presentation
Presentation is loading. Please wait.

1
Demographic and Spatial Analysis of North Carolina's Nuclear Plants Mike Team Raleigh, NC GIS Masters Candidate Advisor – Frank Hardisty, Ph.D.

2
Overview Background and study goals Demographic Analysis Spatial Analysis methods and results Benefit Cost Analysis

3
Study Goals

4
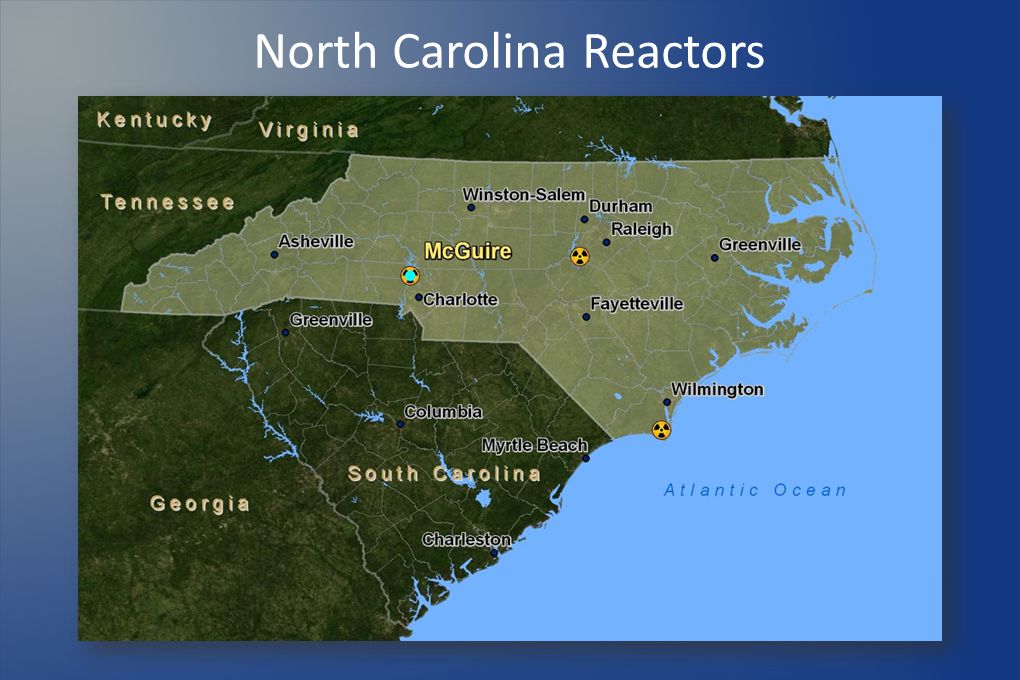
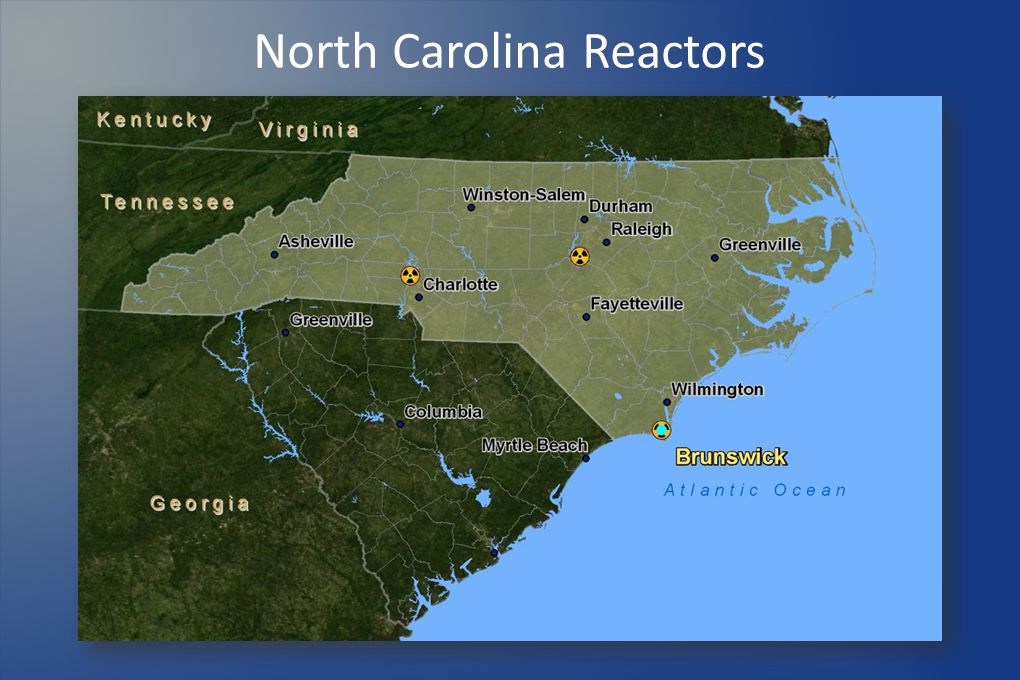
Show map of regional reactor sites North Carolina Reactors

8
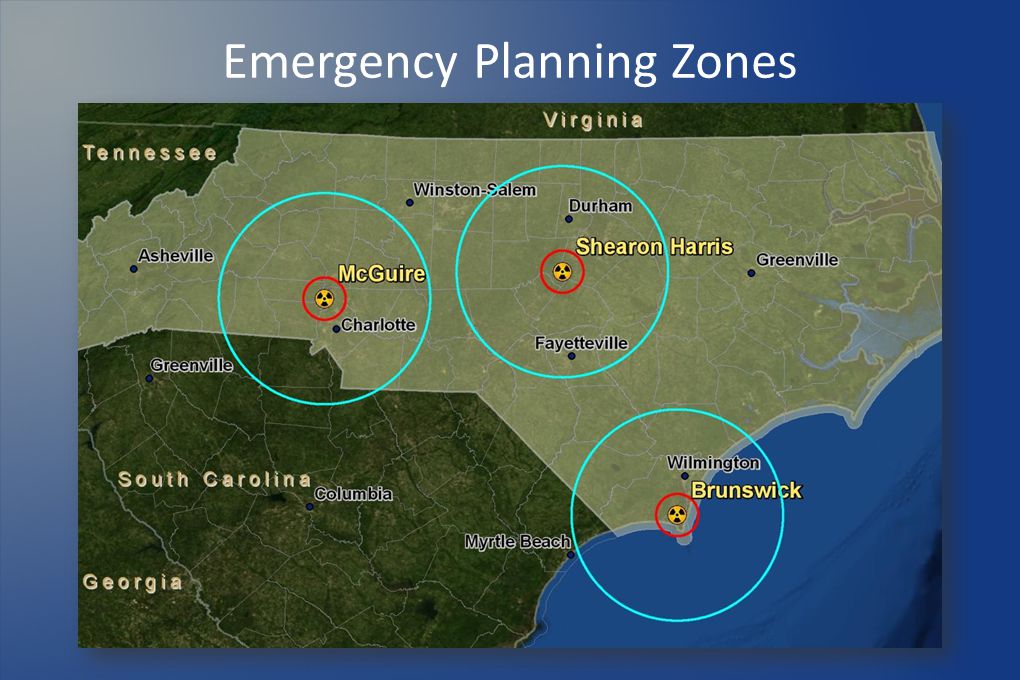
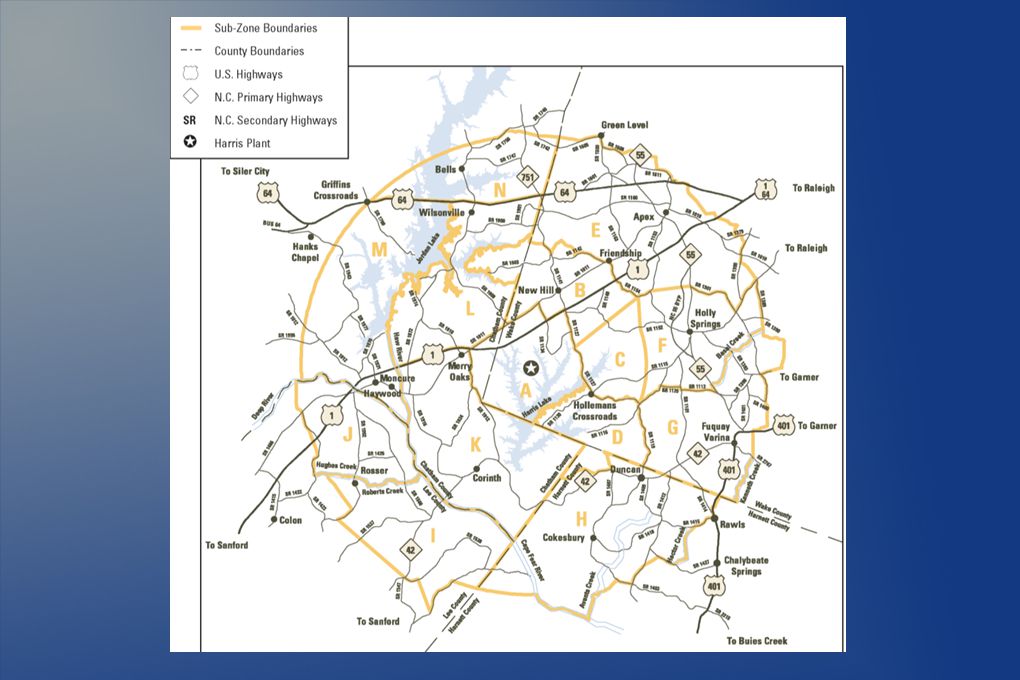
Emergency Planning Zones

11
Population Data Sets US Census – 2000 Best "count" of US Population Available free to the public 10 year old data set

12
Population Data Sets Estimated Population Data – 2008 Estimate of US Population - based on 2000 census US Gov't provides estimates to county level Private data available for a fee

13
Population Data Sets LandScan Ambient Data – 2008 Compiled by Oak Ridge (TN) National Labs Raster data – 30" x 30" (.0083 Decimal Degrees) Free with approved registration
 National Labs Raster data – 30 x 30 (.0083 Decimal Degrees) Free with approved registration")
14
LandScan Ambient Population Data

17
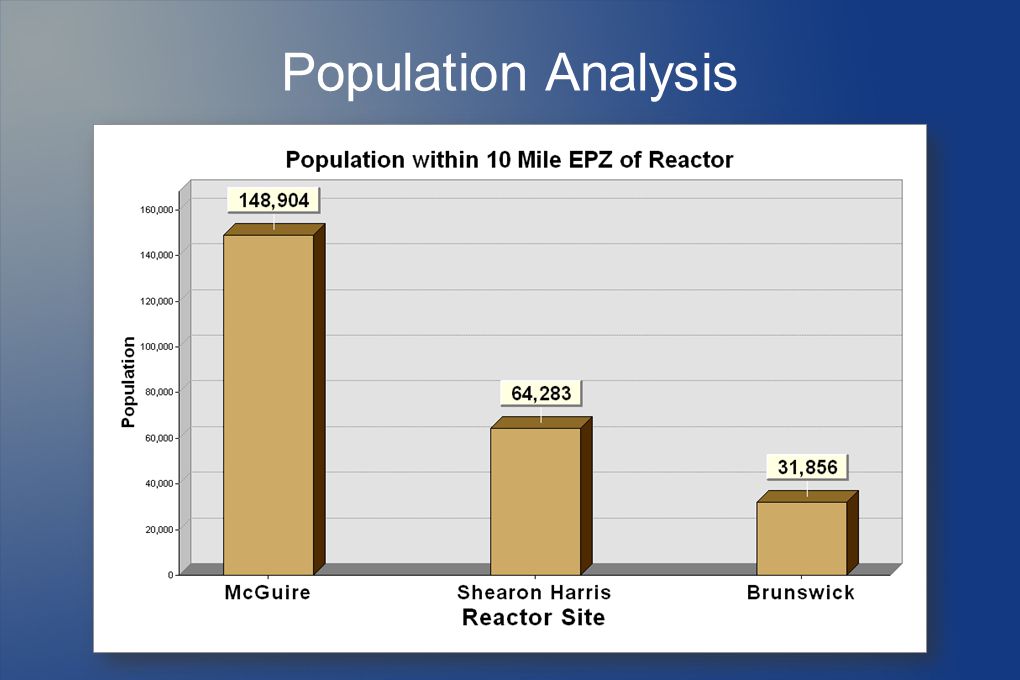
Population Analysis

21
Counties Within 10 Mile EPZ

23
Counties Within 50 Mile EPZ

25
Population Change – 2000 to 2008 County 2000 Census Count 2008 Census Estimate % Change Brunswick73,143103,16041.04 Catawba141,685157,07910.86 Chatham49,32963,07727.87 Gaston190,365206,6798.57 Harnett91,025112,03023.08 Iredell122,660155,35926.66 Lee49,04059,09120.50 Lincoln63,78074,74617.19 Mecklenburg695,454890,51528.05 New Hanover160,307192,53820.11 Wake627,846866,41038.00 Totals2,264,6342,880,68421.36

26
Reception Centers

27
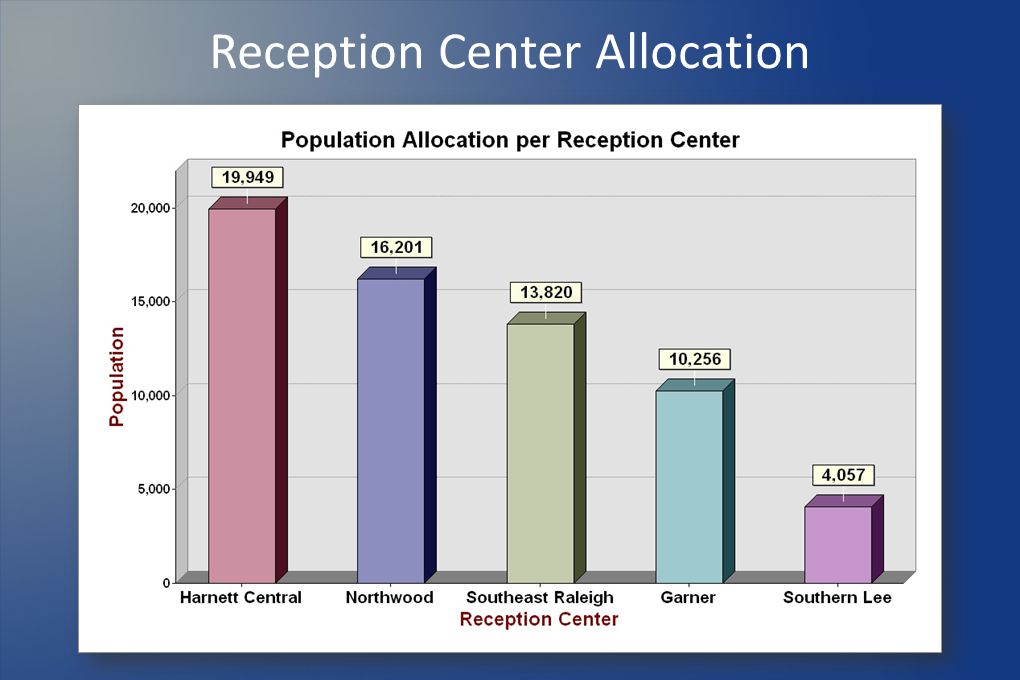
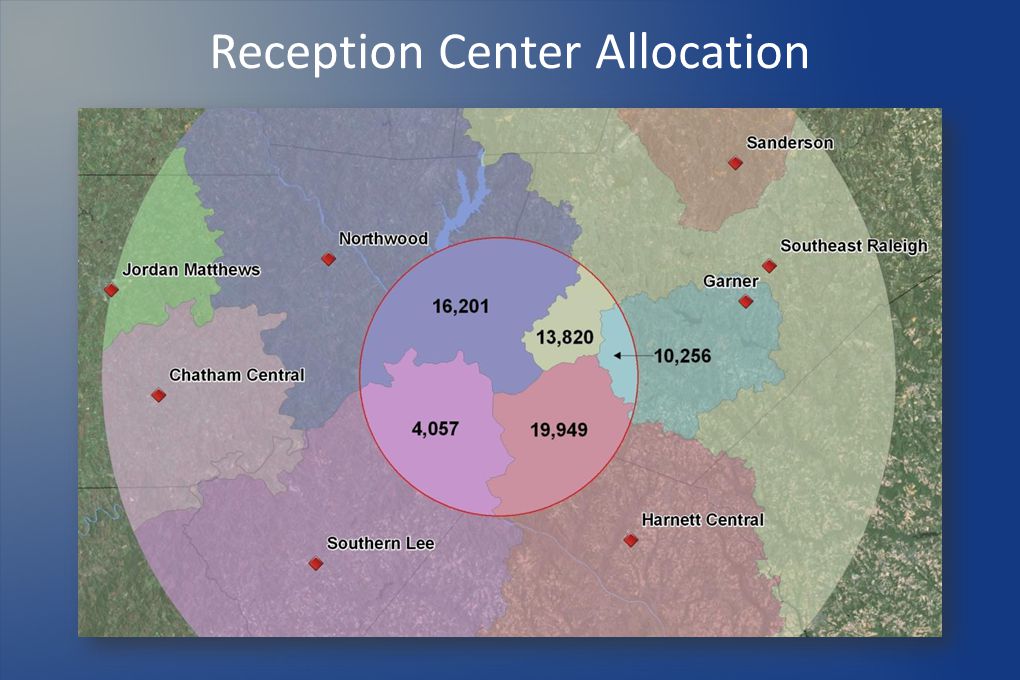
Reception Center Allocation

28
Cost Weighted Distance Raster calculation Calculates best path based on 'travel cost' Weights assigned subjectively

29
Reception Center Allocation Cost Weighted Distance

30
Reception Center Allocation Cost Weighted Distance

31
Reception Center Allocation

34
Benefit Cost Analysis Comparing Energy Output with Population

35
Benefit Cost Analysis Comparing Population with Energy Output

36
Benefit Cost Analysis Comparing Population with Energy Output

37
Conclusion Population Data Set Options Demographic Analysis Data Reception Center Allocation Benefit Cost Assessment

38
Conclusion Population Data Set Options Demographic Analysis Data Reception Center Allocation Benefit Cost Assessment

39
Thank you

40
Demographic and Spatial Analysis of North Carolina's Nuclear Plants Mike Team Raleigh, NC GIS Masters Candidate Advisor – Frank Hardisty, Ph.D.

Similar presentations


 Increase.>")


