Download presentation
Presentation is loading. Please wait.

1
Congressional Elections
Held every 2 years 1/3 Senate (continuous body) and all of the House of Rep. Midterm & Presidential Election years
 and all of the House of Rep. Midterm & Presidential. Election years.")
2
Congressional Elections
Differ from presidential elections: Congressional candidates tend to labor in obscurity Vast majority of candidates are little-known state legislators Name recognition is often the most important battle of the campaign Generally they receive little media coverage

3
Incumbency Advantage Incumbents have:
Taxpayer funds that can enhance their profiles and prospects Money to run an office Franking privilege - free mass mailings Constituency service - helping constituents unravel red tape

4
Highly visible in the district
Easy access to local media Speak frequently at events and meetings Reelection rates for incumbents in the House are above 90%.

5
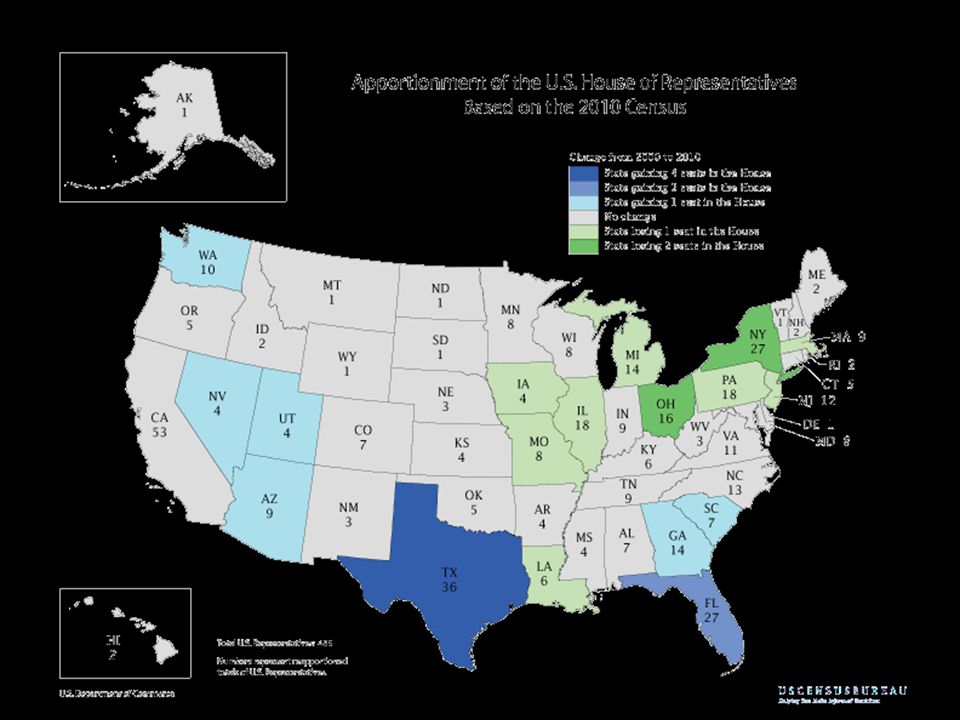
Redistricting, Scandals and Coattails
Most likely reasons for losing reelection After every census, the representation is reapportioned or redistributed Number set at The Reapportionment Act of 1929 2010 Census resulted in Pa loosing one district - 18 The US grows – number of people each representative speaks for grows.

6
PA district map has to be redrawn from 19 voting districts to 18.
Party that controls the state legislature tries to gain political advantage in the redistricting process Gerrymandering - districts drawn with unusual shapes Elbridge Gerry MA, looks like a salamander.

10
Coattails Incumbents can lose if a successful presidential candidate pulls his party along Seems to be weakening in modern times Local issues become more important than the status of Pres. or national issues

11
Midterm Elections Two to Six Year Itch
Can be used as indicator of Pres performance Results of critical importance to incumbent president Bush: victory resulted in weak mandate for his programs 1st months troubled

12
2002 Midterm Elections Held after 9/11
Rallying around Pres. caused drift toward Republicans in Congress Congress did not want to be seen putting obstacles in the way of the Commander-in Chief

13
2004 Presidential Election
Republicans controlled House & Senate Congress and President worked together No guarantee Congress would be a rubber stamp

14
2006 Midterm Elections Democrats retake Congress Senate:
House of Representatives:

15
Pennsylvania No Coattail for Republicans Exit Polls indicated voters looking for a new direction Diplomatic solution to Iraq

16
2008 Presidential Election
Democrats control House and Senate Congress and President vow to work together No guarantee Congress will be a rubber stamp Health Care War in Afghanistan

17
2010 Midterm Election Issues
Wars Health care Economy / Jobs Anger and anxiety propelled Republicans to sweeping takeover of House - new power structure No Coattail effect

18
2012?? Issues not changed much Strength of Republican candidate
Voter perception of Republican takeover in House and states - successful or not More of the same ?

19
Unusual Situations 1998: Clinton had popular mandate as president
Republicans controlled the Congress 1956: Eisenhower Republican had popular mandate as president Congress Democratic Same for 1968 and 1972 Presidents had to work with a Congress that had a majority from the opposing party

20
Common for Pres. Party to lose out in Mid-Term Elections
Local issues tend to gather more importance in mid-term elections General elections are more nationally focused Normal Disillusionment with the party in power Voters vote against pres party, check and balance

21
Pres. In Difficult Position
Support Congressmen in his party May be associated with their failure Has to work with the Congressional member who defeated his candidate Doesn’t support Morale of party may suffer

22
Midterm Election - 1998 Logic says Clinton should do poorly
Monica Lewinsky Starr Inquiry re: Real Estate kickbacks Opposite occurred Public condemnation of private actions did not extend into his political domain Rating level 63%

23
Congressional Elections: Voting
Popular Pres. May influence the turnout of voters in midterm elections Little effect on the way people vote Local issues become more important than the status of Pres. or national issues

24
Six Year Itch Quiz Test your historical knowledge.
Scroll down to “More News and Features”

25
Voting Behavior Political Participation that develops through political socialization Seven Amendments to the Constitution regarding voting

26
Voter Turnout Declining until 2008
Highest since % participation Approx. 40% eligible voters (71% registered) Increase of ~ 5 million voters since 2004 Eligible voter population increased ~ 9 million Problem for democracy 25% of adult population votes “occasionally” 35% rarely or never vote
 Increase of ~ 5 million voters since Eligible voter population increased ~ 9 million. Problem for democracy. 25% of adult population votes occasionally 35% rarely or never vote.")
27
Power Given to the States
Criteria for voting: age 18, citizen, registration Some states make voting burdensome Registration requirements, residency requirements Jesse Ventura’s election partially due to same day registration

28
Factors Influencing Voting Behavior
Education - #1 More education, more likely to vote ~ 80% Civic duty, understand the process, greater sense of control over own destiny Income Levels Socio-economic status Higher levels - higher turnout rates Professional occupations more likely to turnout Opinions are respected due to status

29
Age Young tend not to vote (under 30) Seniors ~ 72%
49% registered voters voted in 2008 Seniors ~ 72% participation decreased 1970-present participation has increased due to AARP People living longer Very active over the last few decades Social Security, Healthcare

30
Race and Ethnicity Whites vote more regularly than African-Am.
2004: 60% / 55%; 2008: 64% / 65% Income and education levels differ South made voting difficult for African-Am resulting in low turnout rates p. 494, 13.5 15th Amendment not enforced - Voting Rights Act of 1965 banned all obstacles

31
Hispanic Americans large community
Voter turnout lower than African-Am. % / 38%; 2008: 50% / 65% Education, income levels and understanding of the system Don’t trust the government Don’t have control of what govt. does Not going to benefit from election

32
Low Voter Turnout Too Busy #1 reason for not voting
Difficulty in Registering to vote Not automatic - Individual effort Residency requirements Different from State to State Not well advertised where to register and where to vote Frequency of elections: US holds more than any other nation - every November

33
Voter Attitudes Not required to vote so why do so?
Satisfaction with status quo Believe can not make a difference Too much effort to keep up with issues or too difficult to understand them Turned off by the quality of campaigns Weak political parties or no difference is seen between the candidates

34
The Analysis of Voter Turnout
Voting Patterns The Analysis of Voter Turnout

35
Voting Patterns in America
1996 general election- 49% Lowest since 1924 Despite a record of 13 million new voters registering to vote in 1992 1960’s 63% turnout Considered the “Kennedy Factor”

36
19th Amendment of 1920 26th Amendment 1968 Women’s right to vote
Impact on elections took years before it was felt 26th Amendment 1968 Lowered age to 18 Less than 50% turned out for the general election

37
1993 Motor Voter Act was passed
Voter apathy leaves decision making to the educated, white, middle/upper class voter. 1993 Motor Voter Act was passed Effort to make procedure to register easier Register to vote when applying for a driving license - not required -

38
An extra 5 million people registered to vote for the 1996 general election
Only about 50% of registered voters voted Increase in African-Am. voters

39
Study on Voting Patterns
1984 election 92.6 million voted, 84 million did not Finding of study: 20% Americans move each year and need to reregister in new location Groups that traditionally helped with registration drives have decreased in influence - unions Media: diluted grass-roots face-to-face politics and removed the “human touch”

40
1972, 1984, 1996 - Seen as forgone conclusions - why vote?
2000 election seen as most open in decades - turnout 50% Voting patterns for 2004 and 2008?

42
Voting Turnout Questions
How can the US improve voter turnout? Does low voter turnout matter? Does the process need reform? WHO IS VOTING?

Similar presentations