Download presentation
Presentation is loading. Please wait.

1
Genuine Progress Index for Atlantic Canada Indice de progrès véritable - Atlantique Health Measures in the Genuine Progress Index NZ Ministry of Health Wellington, 22 April, 2008

2
About GPI Atlantic Non-profit, fully independent, research and education organization founded April, 1997. Based in Halifax; Web site: www.gpiatlantic.org Committed to development of Genuine Progress Index (GPI): Measuring wellbeing & sustainable development accurately and comprehensively Towards full-cost accounting: human, social, natural, and produced capital accounts NS focus ->National and international activities
: Measuring wellbeing & sustainable development accurately and comprehensively Towards full-cost accounting: human, social, natural, and produced capital accounts NS focus ->National and international activities.")
3
Origins 1st GPI 1995 – Redefining Progress, California Emerged from critique of shortcomings of GDP- based measures of progress (Kuznets warning) Distinguished from quality of life indicator systems by adding economic valuation 1995 GPI – single $ number; Statcan critique = starting point for NS GPI (1996) as pilot for Canada. 12 years developmental work.

4
Basic question: How are we doing? What kind of NZ are we leaving our children...?

5
Current way of answering that question: GDP-based measures of progress inadequate and can be dangerously misleading. E.g: Natural resource depletion as gain No distinction re what is growing (e.g. pollution, crime [US stats], sickness, cigarettes) Vital social, environmental assets + value of unpaid work, free time, health, education, equity ignored
 Vital social, environmental assets + value of unpaid work, free time, health, education, equity ignored.")
6
Why We Need New Indicators - Policy Reasons: More energy use, greenhouse gas emissions, consumption, drug use make economy grow = not the signals we may want to communicate Preventive initiatives to conserve and use energy and resources sustainably, to reduce sickness, crime, poverty, greenhouse gas emissions, may be blunted, or inadequately funded

7
Indicators are Powerful What we measure: reflect what we value as a society; determines what makes it onto the policy agenda; influences behaviour (e.g. students) Logic not refuted: From wilderness to mainstream: OECD, EU, SNA, CIW
 Logic not refuted: From wilderness to mainstream: OECD, EU, SNA, CIW.")
8
Natural environment Society Economy

9
That framework addresses question: Are we living sustainably? Source: Hoggan, James. Globe Presentation: Communicating Sustainability, 2006

10
Measuring Wellbeing: Health, free time, unpaid work (voluntary and household), and education have value Sickness, crime, disasters, pollution are costs Natural resources (e.g. forests) are capital assets Reductions in greenhouse gas, crime, poverty, ecological footprint are progress Growing equity signals progress In the GPI…
 are capital assets Reductions in greenhouse gas, crime, poverty, ecological footprint are progress Growing equity signals progress In the GPI….")
11
Beyond indicators and towards accounting and policy shift… E.g. Ideal world: Neither indicators nor economic valuation is required: Social, economic, environmental impacts would be taken into account in all decisions. BUT GDP is accounting system, not indicator system. While economic growth statistics dominate, economic valuation currently has most impact on policy – strategy not end Economic valuations = add-on based on physical indicators (report division)
.")
12
Examples of policy impacts: E.g. NS voluntary work worth $1.9 bill/year Preventable chronic disease costs NS $500m in excess health care costs –> DHPP; costs tobacco, obesity, inactivity –> e.g. HRM planning process; smoke-free legislation Full CBAs – e.g. Solid Waste; Halifax Harbour cleanup; HRM transportation …. Etc. Impact on policy can be indirect (e.g. forests)
.")
13
The Genuine Progress Index - 85 detailed reports to date: Time Use Economic Value of Unpaid Childcare and Housework √ Economic Value of Civic and Voluntary Work √ Value of Leisure Time √ Working Time and Employment √

14
Human Impact on the Environment Greenhouse Gas Emissions √ Sustainable Transportation √ Ecological Footprint Analysis √ Solid Waste √ Natural Capital Soils and Agriculture (3 = √; 2 = …) Forests √ Marine Environment/Fisheries √ Water Resources / Water Quality √ Energy √ Air Quality √ Nova Scotia Genuine Progress Index: Components
 Forests √ Marine Environment/Fisheries √ Water Resources / Water Quality √ Energy √ Air Quality √ Nova Scotia Genuine Progress Index: Components")
15
Social and Human Capital Population Health √ Educational Attainment √ Costs of Crime √ Living Standards Income Distribution √ Debt and Assets …. Economic Security …. Nova Scotia Genuine Progress Index: Components

16
Next Steps: - (A) Complete detailed, separate components Released ’08: Education, HRM transportation + Complete last 3 components by June ‘08 90+ detailed reports = Most complete data set available to any jurisdiction in North America to measure wellbeing and sustainable dev’t Statcan advice – bottom up, methodological, data integrity. Withstand expert scrutiny. Transparency, references.

17
Next steps – (B) Integration Now -> policy utility, integration, update: 1.Headline indicators – community (May 08) 2.Database – easily updatable, replicable (Jul.08) 3.Headline indicators – provincial (Sept. 08) Oct. 08: Major release – Formal presentation to Premier, Government, and People of NS = Landmark moment in evolution of GPI
 Oct. 08: Major release – Formal presentation to Premier, Government, and People of NS = Landmark moment in evolution of GPI.")
18
Therefore communication: Must speak effectively to 3 audiences: Experts (credibility as basis) Policy audience General public (use of media) -Infiltration over time vs one big release: Water against a rock (others including govt. cite GPI #s as own; radio talk shows)
.")
19
Politics and Uptake: Measuring progress is normative But GPI based on consensus values Economic and livelihood security Health, free time Educational attainment Strong and safe communities Clean environment, healthy natural resources

20
Political implications Non-partisan; Evidence-based decision making Good news (e.g. waste, air quality, seniors, employment); Bad news (e.g. GHGs, old forests); Improvements (e.g. income dist.) Consensus on goals, vision. Politics is about how to get there. E.g. GHG reductions, poverty reduction – goal vs strategy Comparisons: NS, Canada, Provinces, Int’l
; Bad news (e.g. GHGs, old forests); Improvements (e.g. income dist.) Consensus on goals, vision. Politics is about how to get there. E.g. GHG reductions, poverty reduction – goal vs strategy Comparisons: NS, Canada, Provinces, Int’l.")
21
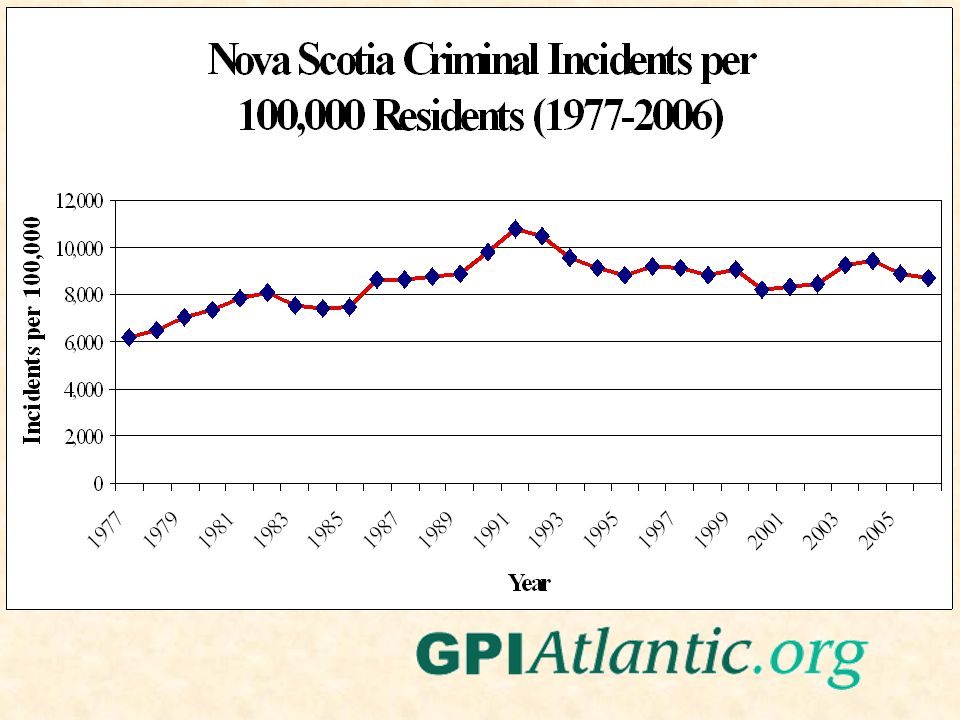
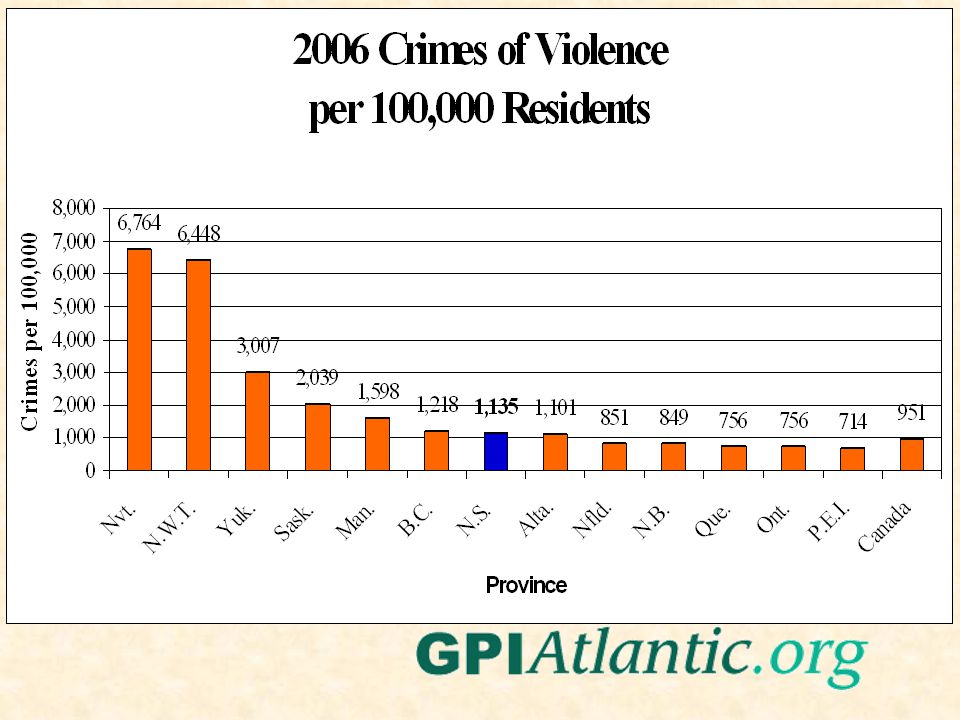
Examples of results: The good, the bad, and the ugly…

29
Volunteerism: Atlantic Provinces lead (formal rate)
")
33
GPI Health Component Population health framework, indicators Socio-economic, behavioural and environmental determinants of health Costs of chronic disease Preventable portion – cost-effectiveness of intervention

34
3 burning health policy issues 1) How to treat the sick - supply side 2) How to prevent disease and improve the health of New Zealanders 3) How to check spiralling health care costs - demand side Conventionally, government focus on (1); now shift to (2) in part because of (3)
 How to treat the sick - supply side 2) How to prevent disease and improve the health of New Zealanders 3) How to check spiralling health care costs - demand side Conventionally, government focus on (1); now shift to (2) in part because of (3)")
35
Valuing a Healthy Population – the importance of indicators GPI population health reports include: Costs of chronic disease in Canada and NS Women’s health in Canada + Atlantic Canada Income, Equity and Health in Canada/Atl Can. Costs of tobacco, obesity, physical inactivity, HIV Economic Impact of Smoke-Free Workplaces

36
Economic Language: - Chronic Disease as Cost, - Prevention = Investment Costs of chronic disease are very high Indirect costs, particularly, are huge Large proportion of costs preventable Disease prevention (esp. dealing with root causes) is cost-effective
 is cost-effective.")
37
1) Costs of Chronic Disease NS: Four types of chronic disease account for about 3/4 of all deaths (cf 1900) Cardiovascular - 36%; Cancer - 30% COPD - 5%; Diabetes - 3%+ Chronic diseases account for 60% medical costs; 3/4 of productivity losses due to disability and premature death; 70% total burden of illness = 13% GDP
 Costs of Chronic Disease NS: Four types of chronic disease account for about 3/4 of all deaths (cf 1900) Cardiovascular - 36%; Cancer - 30% COPD - 5%; Diabetes - 3%+ Chronic diseases account for 60% medical costs; 3/4 of productivity losses due to disability and premature death; 70% total burden of illness = 13% GDP")
38
E.g.: Cost of Chronic Illness in Nova Scotia (2001$ million)
")
39
2) What portion is preventable? Excess risk factors account for: 40% chronic disease incidence 50% chronic disease premature mortality Small number of risk factors account for 25% medical care costs 38% total burden of disease (includes direct and indirect costs)
.")
40
A few risk factors cause many types of chronic disease Tobacco - heart disease, cancers, respiratory disease Obesity - hypertension, diabetes 2, heart disease, stroke, some cancers Physical inactivity - heart disease, stroke, hypertension, colon and breast cancer, diabetes 2, osteoporosis Diet/fat - heart disease, cancer, stroke, diabetes

41
Design cost-effective prevention strategy knowing costs of key risk factors (e.g. Nova Scotia (2001 $ millions)
.")
42
Disease Prevention is Cost-Effective Investment E.g. Workplace = 2:1 WIC = 3:1 (mostly avoided LBW) “Smoke-Free for Life” = 15:1 Pre-natal counselling = 10:1 Brief physician, nutrition, diet counselling – highly effective and cost-effective
 Smoke-Free for Life = 15:1 Pre-natal counselling = 10:1 Brief physician, nutrition, diet counselling – highly effective and cost-effective.")
43
3a) Socio-economic Determinants of Healthy Living Education, income, employment, stress, social networks are key health determinants. These too are modifiable Lifestyle interventions effective for higher income/education groups, not lower - can widen inequity, health gap (e.g. St Henri) WHO: lifestyle related to socioeconomic and environmental conditions. Lifestyle factors explain only 25-30% of premature death (Adler)
 WHO: lifestyle related to socioeconomic and environmental conditions. Lifestyle factors explain only 25-30% of premature death (Adler).")
44
Health Costs of Poverty Most reliable predictor of poor health, premature death, disability: 4x more likely report fair or poor health = costly e.g. Increased hospitalization (Canada): Men 15-39 = +46%; 40-64 = +57% Women 15-39 = +62%; 40-64 = +92% Low income = use 43% more physician services than higher income groups
: Men = +46%; = +57% Women = +62%; = +92% Low income = use 43% more physician services than higher income groups.")
45
E.g. Excess physician use in NS (=small fraction total costs) Educational inequality = $42.2 million = 17.4% of total Income inequality = $27.5 million = 11.3% = costs avoided if all Nova Scotians were as healthy as higher income / university
 Educational inequality = $42.2 million = 17.4% of total Income inequality = $27.5 million = 11.3% = costs avoided if all Nova Scotians were as healthy as higher income / university.")
46
Heart Health Costs of Poverty Low income groups have higher risk of smoking, obesity, physical inactivity, cardiovascular risk = costly Canada could avoid 6,400 deaths, $4 billion/year if all Canadians were as heart healthy as higher income groups

47
Health costs of child poverty 31 indicators - as family income falls, children have more health problems, (NLSCY, NPHS, Statistics Canada) Child poverty -> higher rates of respiratory illness, obesity, high blood lead, iron deficiency, FAS, LBW, SIDS, delayed vocabulary development, injury+….
 Child poverty -> higher rates of respiratory illness, obesity, high blood lead, iron deficiency, FAS, LBW, SIDS, delayed vocabulary development, injury+….")
48
Health costs of unemployment Unemployed – high stress, smoke and drink more, less physically active, eat poorly Higher rates of wide range of physical and mental illnesses (sick 2x as often); more disabilities; lower self-rated health; visit physicians more often than those with jobs NS cost of u.e. = $4 billion (lost output and taxes + direct payments) + $250-$400 mill. in excess disease, crime, divorce costs Job creation = good for health
 + $250-$400 mill. in excess disease, crime, divorce costs Job creation = good for health.")
49
A/c Roy Romanow……: “If you’re at the bottom of the income ladder, odds are you’re going to find yourself at the bottom of the health ladder.” “So, if we’re serious about making Canadians the healthiest people in the world, then we have to be serious about closing the gap between rich and poor.”

50
Therefore, identify and target highest risk groups Single mothers & their children Unemployed Blacks and other minorities, native Americans, migrants, disabled.... = Clustered disadvantages (poverty, illiteracy, unemployment, ill-health): “Social exclusion”
: Social exclusion .")
51
Inequities within provinces: Averages misleading Intra-provincial disparities: – largest cities closer to national pattern than to own “hinterlands.” E.g. Halifax unemployment less than national average and comparable health profile (cf Cape Breton) Low income areas with highest unemployment and lowest socioeconomic status have worse patterns of chronic disease, disability, and premature death
 Low income areas with highest unemployment and lowest socioeconomic status have worse patterns of chronic disease, disability, and premature death.")
52
Labrador: high Aboriginal population: unique profile Infant mortality = 17.2/1,000 live births (St. John’s = 5.6) Low birth weight = 6.8% - highest in Atlantic.Can Suicide = 19.2/100,000 (Nfld=7.3=lowest in Can) Injury deaths = 40/100,000 (St. John’s = 16) Lung cancer deaths = 73/100,000 (Nfld-50) Respiratory deaths 50% higher than Cdn. rate Life expectancy = 74.9 (Can=78.3) - lowest Atl.Can PYLL=7,432/100,000 (St. John’s = 5,205)
 Low birth weight = 6.8% - highest in Atlantic.Can Suicide = 19.2/100,000 (Nfld=7.3=lowest in Can) Injury deaths = 40/100,000 (St. John’s = 16) Lung cancer deaths = 73/100,000 (Nfld-50) Respiratory deaths 50% higher than Cdn. rate Life expectancy = 74.9 (Can=78.3) - lowest Atl.Can PYLL=7,432/100,000 (St. John’s = 5,205).")
53
Labrador: 36% men, 30% women are daily smokers

54
Pathways to health - material and social/psych E.g. Nfld, PEI – lower incomes, wealth, BUT Lowest crime rates Lowest stress, depression levels Strongest voluntary sector Highest mental health, self-rated health, functional health

55
Social supports provide buffer in Atlantic Canada Social networks may play as important a role in protecting health, buffering against disease, and aiding recovery from illness as behavioural and lifestyle choices such as quitting smoking, losing weight, and exercising. – See: Mustard, J.F., & Frank, J. (1991).The Determinants of Health. (CIAR Publ. No. 5)
.The Determinants of Health. (CIAR Publ. No. 5).")
56
BUT... Doesn’t a successful preventive strategy just defer costs to older ages? NS 65+:2001 = 14%; 2036 = 28% e.g. Philip Morris’ Czech Republic study prevention hard to sell: –Successful prevention = nothing happens –Costs won’t be diverted from health care

57
Prevention saves $ “Compression of aging:” delays costs, preserves independence into old age: –5-year delay in onset cardiovascular disease could save US $100 billion / yr –5-year delay in hip fracture could save $7.3 billion / yr –Physically active - lower lifetime illness –Nutritional intervention - reduces hospital use 25%-45% among elderly

58
“Compression of Morbidity” Fries: “The amount of disability can decrease as morbidity is compressed into the shorter span between the increasing age at onset of disability and the fixed occurrence of death.” (= about 85: analysis of 1900s data) “Successful aging” can preserve independence into old age
 Successful aging can preserve independence into old age")
59
3b) Environmental Determinants of Health Air and water quality directly affect health (e.g. OMA study on excess mortality and morbidity due to smog, poor air quality; Walkerton) Climate change & resource depletion have health consequences Chemicals, toxins in the environment – incl. 2nd hand smoke (NL – 12% exposed in home) New categories of illness – multiple chemical sensitivities, environmental illness
 Climate change & resource depletion have health consequences Chemicals, toxins in the environment – incl. 2nd hand smoke (NL – 12% exposed in home) New categories of illness – multiple chemical sensitivities, environmental illness.")
60
NL: 2nd-hand smoke exposure on most days in the last month, regions, 2001

61
New population health strategies can: address root causes rather than individual behaviours alone support more equitable distribution of public and private resources emphasize costs: reducing poverty and inequality can cut health costs include all levels and sectors of government – including outside the "traditional" health domain

62
In sum: Tracking health includes socio-economic and environmental measures – low-income & unemployment rates, literacy, stress, crime, social supports, air and water quality, etc… These directly affect health status/outcomes E.g.: Measuring healthy living – e.g. healthy weights + costs of obesity and cost- effectiveness of interventions

63
4) Healthy Living Trends, NL, 05 2 nd handSmokersActiveInactiveFr-veg 5+ Canada8.721.326.546.741.2 NL11.922.621.253.223.0 East11.421.220.852.9NA Central11.124.020.355.8NA West14.424.023.949.8NA Labrad12.627.421.056.7NA
 Healthy Living Trends, NL, 05 2 nd handSmokersActiveInactiveFr-veg 5+ Canada NL East NA Central NA West NA Labrad NA")
64
Obesity (BMI = 30+) – NL (2005) Canada15.7% NL24.6% Eastern24.6% Central29% Western20% Labrador23.4%
 – NL (2005) Canada15.7% NL24.6% Eastern24.6% Central29% Western20% Labrador23.4%")
65
Is obesity a “cost”, or is it good for the economy? Americans spend more than $100 billion a year on fast food = 44% of all food service sales Fast food, candy, sugared cereals = 1/2 of $30 billion annual food industry advertising in U.S. (Kelloggs spends $40 million /year to promote Frosted Flakes alone)
.")
66
Overeating contributes to economy many times over Excess foods grown, processed, advertised, transported, warehoused, sold Diet drug and weight loss industries then add $35 billion to US economy Liposuction = leading form of cosmetic surgery in US = 400,000 operations / year = up 62% in 2 years = a growth industry

67
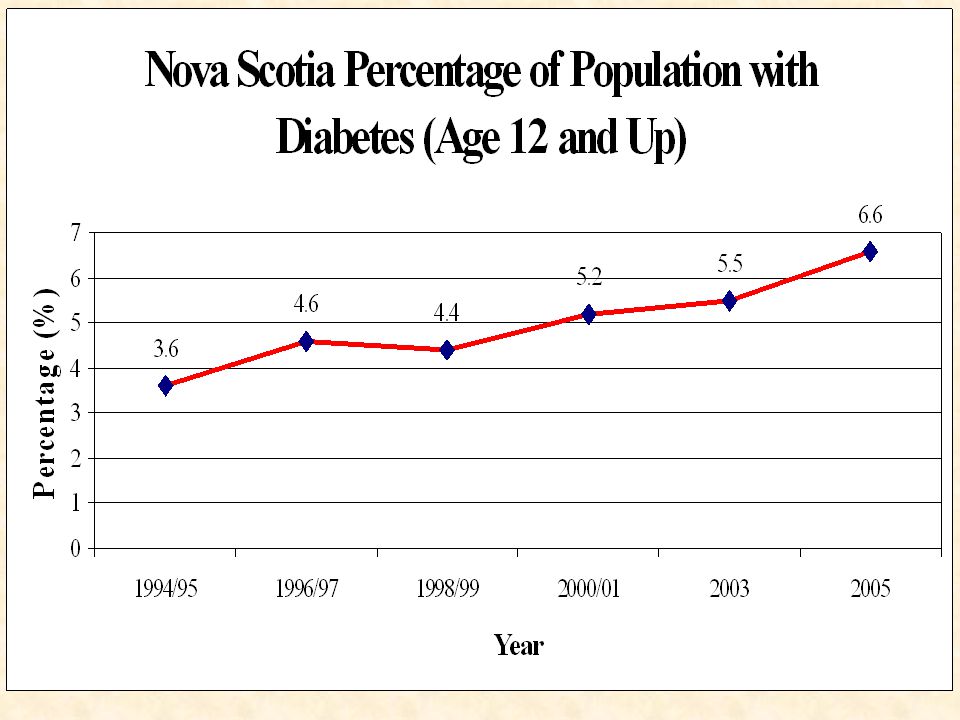
Obesity-related illness Costs U.S. $118 billion / year (Colditz) - now exceeds smoking; but doctor, drug, hospital costs make economy grow More than 50% diabetes 2 due to obesity Type 2 diabetes grown 5-fold globally since 1985 from 30 to 150 million (17 million in US). WHO predicts 300 million by 2025
 - now exceeds smoking; but doctor, drug, hospital costs make economy grow More than 50% diabetes 2 due to obesity Type 2 diabetes grown 5-fold globally since 1985 from 30 to 150 million (17 million in US). WHO predicts 300 million by")
68
In the words of the pharmaceutical industry: “The type 2 diabetes market will double to $17.2 billion in 2011, reflecting sustained, robust annual growth of 7% from 2001 through 2011” Consumption of oral diabetic drugs will grow five-fold from 2001 to 2011

69
Eli Lilly - $119 bill. firm Announced construction of world’s largest factories devoted to single drug (insulin) = $1/2 bill. plants in Virg. and PR (11% of PR population has diabetes) Lilly global insulin sales up 16% in 2001 Humalog (Virg, PR) up 79%; Actos up 61% from 2000 (2001 sales = $901 mill) James Kappel (Lilly): “You’ve got to be in diabetes.”
 = $1/2 bill. plants in Virg. and PR (11% of PR population has diabetes) Lilly global insulin sales up 16% in 2001 Humalog (Virg, PR) up 79%; Actos up 61% from 2000 (2001 sales = $901 mill) James Kappel (Lilly): You’ve got to be in diabetes. .")
70
Counting it wrong – why the context matters So long as we count growth in fast food and diabetes industries as good news for the economy, the health policy agenda will be difficult to shift So long as we use economic growth statistics as the primary measure of social wellbeing, we won’t give population health and prevention (including good nutrition) the attention they deserve
 the attention they deserve")
71
Counting it right: Obesity as serious cost Obese (BMI >30) = 50-100% increased risk of death (all causes) cf healthy weight Overweight = higher premature death rate even if no smoking, otherwise healthy (American Cancer Society - 1 million subjects) Second-leading preventable cause of death in US (Joann Manson - Harvard) and now most expensive (Rand)
 = % increased risk of death (all causes) cf healthy weight Overweight = higher premature death rate even if no smoking, otherwise healthy (American Cancer Society - 1 million subjects) Second-leading preventable cause of death in US (Joann Manson - Harvard) and now most expensive (Rand)")
72
Health Impacts BMI >30 = 4x diabetes; 3.3x high blood pressure; 56% more likely have heart disease; 2.6 times urinary incontinence; 50% less likely rate health positively (Statcan) Association with some cancers, gallbladder disease, stroke, asthma, arthritis, thyroid problems, back problems, sleep disorders, impaired immunity, depression, etc.
 Association with some cancers, gallbladder disease, stroke, asthma, arthritis, thyroid problems, back problems, sleep disorders, impaired immunity, depression, etc.")
73
A “Global Epidemic” (WHO) Obesity increased 400% in the western world in the last 50 years. Underfed and Overfed: The Global Epidemic of Malnutrition: “ for the first time in human history the number of overweight people in the world now equals the number of underfed people, with 1.1 billion each.” March, 2000, Worldwatch Institute, Washington D.C.

74
Unequal distribution not food scarcity is the problem 80% of world’s hungry children live in countries with food surpluses; 36% Brazilians, 41% Colombians overweight 50%+ US, UK, Germans overweight; 50%+ Bangladesh, India children underweight U.S. - 20% children overweight or obese (50% increase since 1980); Nearly 1/5 U.S. children “food insecure” (USDA)
; Nearly 1/5 U.S. children food insecure (USDA).")
75
Underfed and Overfed The hungry and the overweight share high levels of sickness and disability, shortened life expectancies, and lower levels of productivity -- all of which impede a country's development Among the overweight, "obesity often masks nutrient starvation," as calorie-rich junk foods squeeze healthy items from the diet. In Europe and North America, fat and sugar now account for more than half of total caloric intake But few doctors give nutrition counselling –

76
Low-income, poorly educated, elderly = higher rates overweight, obesity Percent of Canadians who believe that low-fat foods are expensive, 1994-95

77
Overweight- by Education and Age (20-64), Canada, 1997 (%)
, Canada, 1997 (%)")
78
Costs of obesity – 8 Provinces Obesity: 56% diabetes 2 in NS attributable to obesity; 37% hypertension; 22% heart disease; 24% gallbladder disease; + stroke, cancers (colorectal, endometrial, post- menopausal breast), arthritis etc. Obesity costs NS health care system = $120m/year (6.8% budget) + $140m indirect productivity losses = $260m 39% N.S. overweight (BMI = >27)
 + $140m indirect productivity losses = $260m 39% N.S. overweight (BMI = >27).")
79
50% Nova Scotians are inactive (2005). Only 21% physically active (CCHS) (3 kcal/kg/day), age 12+, 2001 (%)
 (3 kcal/kg/day), age 12+, 2001 (%).")
80
T R E N D S: % exercising regularly in NS now stagnant after improvement in 1990s (63% inactive 1994, 52% 1998, 50% now). Improvement among women but decline among men (43% inactive 1998; 48% today; cf 60%->52% fem). Gap closing fast All 4 Atlantic provs rank below Cdn average Obesity = more than doubled; childhood asthma, obesity up sharply
. Gap closing fast All 4 Atlantic provs rank below Cdn average Obesity = more than doubled; childhood asthma, obesity up sharply.")
81
Obesity Trends* Among U.S. Adults BRFSS, 1985 Source: Mokdad A H, et al. J Am Med Assoc 1999;282:16, 2001;286:10. BRFSS – Behavioural Risk Factor Surveillance System - CDC

82
Obesity Trends* Among U.S. Adults BRFSS, 1986 Source: Mokdad A H, et al. J Am Med Assoc 1999;282:16, 2001;286:10.

83
Obesity Trends* Among U.S. Adults BRFSS, 1987 Source: Mokdad A H, et al. J Am Med Assoc 1999;282:16, 2001;286:10.

84
Obesity Trends* Among U.S. Adults BRFSS, 1988 Source: Mokdad A H, et al. J Am Med Assoc 1999;282:16, 2001;286:10.

85
Obesity Trends* Among U.S. Adults BRFSS, 1989 Source: Mokdad A H, et al. J Am Med Assoc 1999;282:16, 2001;286:10.

86
Obesity Trends* Among U.S. Adults BRFSS, 1990 Source: Mokdad A H, et al. J Am Med Assoc 1999;282:16, 2001;286:10.

87
Obesity Trends* Among U.S. Adults BRFSS, 1991 Source: Mokdad A H, et al. J Am Med Assoc 1999;282:16, 2001;286:10.

88
Obesity Trends* Among U.S. Adults BRFSS, 1992 Source: Mokdad A H, et al. J Am Med Assoc 1999;282:16, 2001;286:10.

89
Obesity Trends* Among U.S. Adults BRFSS, 1993 Source: Mokdad A H, et al. J Am Med Assoc 1999;282:16, 2001;286:10.

90
Obesity Trends* Among U.S. Adults BRFSS, 1994 Source: Mokdad A H, et al. J Am Med Assoc 1999;282:16, 2001;286:10.

91
Obesity Trends* Among U.S. Adults BRFSS, 1995 Source: Mokdad A H, et al. J Am Med Assoc 1999;282:16, 2001;286:10.

92
Obesity Trends* Among U.S. Adults BRFSS, 1996 Source: Mokdad A H, et al. J Am Med Assoc 1999;282:16, 2001;286:10.

93
Obesity Trends* Among U.S. Adults BRFSS, 1997 (*BMI ≥30, or ~ 30 lbs overweight for 5’ 4” person) No Data <10% 10%–14% 15%–19% ≥20%
 No Data <10% 10%–14% 15%–19% ≥20%.")
94
Obesity Trends* Among U.S. Adults BRFSS, 1998 (*BMI ≥30, or ~ 30 lbs overweight for 5’ 4” person) No Data <10% 10%–14% 15%–19% ≥20%
 No Data <10% 10%–14% 15%–19% ≥20%.")
95
Obesity Trends* Among U.S. Adults BRFSS, 1999 (*BMI ≥30, or ~ 30 lbs overweight for 5’ 4” person) No Data <10% 10%–14% 15%–19% ≥20%
 No Data <10% 10%–14% 15%–19% ≥20%.")
96
Obesity Trends* Among U.S. Adults BRFSS, 2000 (*BMI ≥30, or ~ 30 lbs overweight for 5’ 4” person) No Data <10% 10%–14% 15%–19% ≥20%
 No Data <10% 10%–14% 15%–19% ≥20%.")
97
Obesity Trends* Among U.S. Adults BRFSS, 2001 (*BMI ≥30, or ~ 30 lbs overweight for 5’ 4” person) No Data <10% 10%–14% 15%–19% 20%–24% ≥25%
 No Data <10% 10%–14% 15%–19% 20%–24% ≥25%.")
98
(*BMI ≥30, or ~ 30 lbs overweight for 5’ 4” person) Obesity Trends* Among U.S. Adults BRFSS, 2002 No Data <10% 10%–14% 15%–19% 20%–24% ≥25%

99
Obesity Trends* Among U.S. Adults BRFSS, 2003 (*BMI ≥30, or ~ 30 lbs overweight for 5’ 4” person) No Data <10% 10%–14% 15%–19% 20%–24% ≥25%
 No Data <10% 10%–14% 15%–19% 20%–24% ≥25%.")
100
Obesity Trends* Among U.S. Adults BRFSS, 2004 (*BMI ≥30, or ~ 30 lbs overweight for 5’ 4” person) No Data <10% 10%–14% 15%–19% 20%–24% ≥25%
 No Data <10% 10%–14% 15%–19% 20%–24% ≥25%.")
101
Obesity Trends* Among U.S. Adults BRFSS, 2005 (*BMI ≥30, or ~ 30 lbs overweight for 5’ 4” person) No Data <10% 10%–14% 15%–19% 20%–24% 25%–29% ≥30%
 No Data <10% 10%–14% 15%–19% 20%–24% 25%–29% ≥30%.")
102
1995 Obesity Trends* Among U.S. Adults BRFSS, 1990, 1995, 2005 (*BMI 30, or about 30 lbs overweight for 5’4” person) 2005 1990 No Data <10% 10%–14% 15%–19% 20%–24% 25%–29% ≥30%
 No Data <10% 10%–14% 15%–19% 20%–24% 25%–29% ≥30%.")
105
Overweight Canadians (BMI = >27),Canada and Provinces, Age 20-64, 1997 (%)
,Canada and Provinces, Age 20-64, 1997 (%)")
106
Methodology - Estimating the Cost of Obesity Step 1: Assess relative risk (RR) for known co-morbidities (epidemiological literature) Step 2: Calculate the population attributable fraction (PAF) due to obesity of each co- morbidity according to (1) the RR and (2) the probability (P) of a person being obese in a particular jurisdiction (i.e. rate of obesity) Formula: PAF = P(RR-1)/[P(RR-1)+1]
 Formula: PAF = P(RR-1)/[P(RR-1)+1].")
107
Estimating Cost of Obesity Step 3: Use PAF as percentage of official cost estimates for each disease (EBIC) to assess direct medical costs (hospital, doctor, drug, research, other) attributable to obesity Step 4: Assess indirect costs (productivity losses) due to premature death and disability (short-term and long-term). Various methods include human capital, inclusion of unpaid work, etc.

108
Step 1: RR for 10 known co- morbidities (Birmingham et al. (CMAJ): BMI = >27 compared to BMI = 20-24.9
: BMI = >27 compared to BMI =")
109
Limiting to 10 will underestimate costs Estimate will NOT include other illnesses associated with diabetes; e.g. osteoarthritis, musculoskeletal disorders, gout, asthma, back problems, thyroid problems, hormonal disorders, sleep apnea, infertility, pseudo tumour cerebri, impaired immune function

110
Step 2: Calculate PAF for particular jurisdiction. E.g. NB: P= 41% = >27

111
Step 3: Direct cost estimates e.g. NB = pop. 3/4 million: Direct costs 10 diseases: $C54.8 million/yr Add musculoskeletal at PAF of 15% = $15m Other obesity-related illnesses = $2 million TOTAL = $72 million = 5.6% health budget When account for other underestimates = (capital expenditures; RR of BMI = 25-27; 10% under-reporting), total cost estimate = $96 million/yr = 7.5% health budget
, total cost estimate = $96 million/yr = 7.5% health budget.")
112
Step 4: Indirect costs Based on Health Canada’s Economic Burden of Illness ratios, add $90-$110 million in productivity losses due to premature death and disability Total cost to NB = ~ $200 million/yr = 1.4% of province’s GDP (8 Provinces) Note: Cost estimates do NOT include diet and weight loss programs, etc.
 Note: Cost estimates do NOT include diet and weight loss programs, etc.")
113
Estimates for U.S. Colditz (Harvard) = $US 118 billion/yr direct + indirect costs (> smoking) 1995 lost wages due to obesity = $47.6b. 39.3 million work days lost annually; 62.7 million physician visits 239 million restricted activity days 89.5 million bed days
 = $US 118 billion/yr direct + indirect costs (> smoking) 1995 lost wages due to obesity = $47.6b million work days lost annually; 62.7 million physician visits 239 million restricted activity days 89.5 million bed days.")
114
European studies: e.g. Netherlands: Obese individuals 40% more likely visit doctors; 2.5 times more likely take drugs for CVD = direct costs Sweden: Obesity accounts for 7% of lost productivity due to sick leave, disability. Obese workers = 2x more likely to take long-term sick leave = indirect costs

115
Solutions must address causes of obesity epidemic Poor diet Physical inactivity Poverty, illiteracy Employment patterns Other underlying social causes

116
1) Obesity is only one consequence of poor diet Nutrient-poor, high-fat, high-sugar diets, with low fibre and chemical additives contribute to cancers of breast, colon, mouth, stomach, pancreas, prostate 30% of cancers worldwide could be prevented by switching to healthy diets USA: fat + sugar = 50%+ average caloric intake; complex carbohydrates just 1/3
 Obesity is only one consequence of poor diet Nutrient-poor, high-fat, high-sugar diets, with low fibre and chemical additives contribute to cancers of breast, colon, mouth, stomach, pancreas, prostate 30% of cancers worldwide could be prevented by switching to healthy diets USA: fat + sugar = 50%+ average caloric intake; complex carbohydrates just 1/3")
117
Dangers are out of sight Fats, oils, sugars, salt added to processed and prepared foods 1909: 2/3 discretionary sugar added in household. Today, more than 3/4 of sugar consumed is added to processed and prepared food, out of sight of consumer Whole grains largely replaced by refined grains (lack vitamins, minerals). Only 2% wheat flour in U.S.= unrefined
. Only 2% wheat flour in U.S.= unrefined.")
118
Fast food Single fast-food meal may exceed daily fat, sugar, cholesterol, and sodium RDAs Marketing: “Supersize” meal for 79c = 42 fl.oz. Coke (vs 16) + free refills; more than double weight of french fries = increases calories of nutrient poor, fat- rich meal from 680 to more than 1,340 1/5 “vegetables” consumed in U.S. = french fries and potato chips
 + free refills; more than double weight of french fries = increases calories of nutrient poor, fat- rich meal from 680 to more than 1,340 1/5 vegetables consumed in U.S. = french fries and potato chips.")
119
Ignorance re processed food Surveys show food labels widely misunderstood, misinterpreted, esp. ingredient lists, nutritional panels, validity of food claims on labels $30 billion annual food advertising dwarfs nutritional education budgets. Consumers get their knowledge from industry. School-based programs can help raise awareness

120
2) Physical activity U.S. Surgeon-General: Physical activity promotes fat loss; weight loss (dose- response a/c frequency, duration of session and program) Sedentary = 44% higher rate of obesity than physically active; 5x risk of heart disease; 60% higher depression (see GPI report on cost of physical inactivity)
 Sedentary = 44% higher rate of obesity than physically active; 5x risk of heart disease; 60% higher depression (see GPI report on cost of physical inactivity).")
121
Inactive Canadians (CCHS) (< 1.5 kcal/kg/day), age 12+, 2000/01 (%)
 (< 1.5 kcal/kg/day), age 12+, 2000/01 (%)")
122
Television Viewing, Average Hours per Week; 1999

123
TV linked to child obesity American Academy of Pediatrics: “Increased television use is documented to be a significant factor leading to obesity.” Study in JAMA: Children lost weight if they watched less television Add computer games. Childhood obesity rate has doubled in 20 years

124
3) Social Causes - E.g. Dual-earner families as a % of all Canadian families
 Social Causes - E.g. Dual-earner families as a % of all Canadian families")
125
LF participation rate of mothers with infants, 0-2, 1961-1995

126
Total Daily Paid+Unpaid Work, (averaged over 7-day week)
")
127
A Day in the Life of a Working Mother - Total Daily Work Time: 11 hrs 12 m

128
Stress, health, and weight Women w. high levels of job strain 1.8 times more likely experience unhealthy weight gain vs low job strain. Reduced work hours = 1/2 odds of weight gain cf standard hours Longer hours = 40% more likely decrease physical activity; 2.2 times more likely experience major depression; higher levels smoking (stress-related), unhealthy weight gain (poor eating) and drinking (Statcan)
, unhealthy weight gain (poor eating) and drinking (Statcan).")
129
Eating out has increased sharply, but... Harvard study - 16,000 children- the more families eat at home together, the more fruits & vegetables are eaten, less fried food + higher intake of important nutrients (calcium, fiber, folate, iron, vitamins B & E Healthy diets persist into adulthood Counsel eating home-cooked meals

130
The good news: Identifying problem suggests solutions Purpose of costing exercise is to identify cost-effective interventions to improve population health Concept of investment crucial - the language of business Investing in human, social, natural capital can be cost-effective, yield long- term return on investment

131
1) Promote Healthy Diets and Nutritional Literacy –Teachers can be trained to explain nutritional labels in class, supermkt tour –Singapore “Trim and Fit” program cut school children’s obesity 33%-50% –More explicit diet and nutritional training to doctors, nurses. Yet only 23% U.S. medical schools require separate nutrition course

132
Practising what we preach Schools, universities, hospitals, work- places can act alone to improve food quality, nutritional content (vs contract with fast food companies) Berkeley schools - vegetable gardens to teach, supply school cafeteria. 1999 - organic lunches

133
Case studies and models U.S. grade 3-5 “Child and Adolescent Trial for Cardiovascular Health” found lower fat, higher physical activity well into adolescence - Behavioural changes at young age have lasting effects Finland - nutrition media campaign, strict food labelling (e.g. “heavily salted”), education - helped cut heart disease deaths 65% 1970-95
, education - helped cut heart disease deaths 65%")
134
And in the future....? Restrictions on advertising (cf tobacco) Tax on foods inversely proportion to nutrient value per calorie (Kelly Brownell, Yale). Fatty, sugary, high- calorie, low nutrition = highest taxes, ; fruits, vegetables, whole grains exempt Tax revenues to nutritional education just as portion of cigarette, gambling revenues fund anti-smoking, counselling
 Tax on foods inversely proportion to nutrient value per calorie (Kelly Brownell, Yale). Fatty, sugary, high- calorie, low nutrition = highest taxes, ; fruits, vegetables, whole grains exempt Tax revenues to nutritional education just as portion of cigarette, gambling revenues fund anti-smoking, counselling.")
135
= Step towards “full-cost accounting” Taxation makes toxic substances and social liabilities pay full costs = “user pay” since taxpayers absorb health costs. What is true cost of supersized french fries? Also helps reduce poverty, inequity (low- fat, healthy food more affordable)
.")
136
2) Physical activity: can begin anywhere. Eg schools Tower Road school pact not to watch TV for full week, keep journal. Gradual increase in physical activity Glace Bay High: anti-smoking pact, calculate savings to health care system, invest in town swimming pool Cost-effectiveness of school gym programs

137
3) Addressing broader social determinants of health E.g. Netherlands: shortest work hours of any industrial county (1,370 cf 1,732 Can) No discrimination against part-timers = equal hourly pay, pro-rated benefits, career advancement; higher productivity Belgian civil service; Danes = 11 hours more free time / week
 No discrimination against part-timers = equal hourly pay, pro-rated benefits, career advancement; higher productivity Belgian civil service; Danes = 11 hours more free time / week.")
138
=Major shift from illness treatment paradigm to health promotion From high-tech medical interventions...to population health strategy Determinants of health include income, literacy, employment status, the physical environment, and healthy lifestyles. Containing spiralling health care costs through reducing demand on system = improved population health as cost-effective

139
Obstacles Heavier weights more “normal” - desire for weight change declined (NB = 65% 1985 to 45% 1997 while overweight 2x) Materialism - consumption addiction Measures of progress send contrary message. Counting it right is a good place to start - can shift policy agenda, change behaviour

140
Positive Approach: Can we do it? Percentage Waste Diversion in Nova Scotia

142
Challenges to Policy Adoption Long-term vs short-term – returns on health promotion policy = 25-30 years from now Cost “savings” hard to demonstrate without paradigm shift away from prolonging life, address “dying well” (Bhutan) Science as ‘certainty’ vs precautionary principle; Materialism / consumption addiction vs ‘contentment’, ‘enough’.
 Science as ‘certainty’ vs precautionary principle; Materialism / consumption addiction vs ‘contentment’, ‘enough’.")
143
But time is right – E.g. NS Gov’t commitments 2006-08: “Demonstrate international leadership by having one of the cleanest and most sustainable environments in the world by the year 2020” (Bill 146: Environmental Goals and Sustainable Prosperity Act “Becoming the “best place to live” means scoring well on quality of life indicators like those produced by Genuine Progress Index Atlantic” (Opportunities for Sustainable Prosperity. 2006) Power of Green Conference, 2007 (Ec. Dev’t)
 Power of Green Conference, 2007 (Ec. Dev’t).")
144
Maintain and update GPI Strongly recommend period of study, reflection, consultation Took nearly 12 years to get here, another year to investigate application appropriate – e.g. interdepartmental task force Understand methods and data sources, select appropriate indicators NS Govt will report GPI results (Community Counts)
.")
145
Data considerations New database key to easy updating, comparison, replication Data sources – (a) official/available – mostly Statcan; (b) provincial – e.g. forest inventories, waste diversion -> development; (c) new surveys (e.g. education); (d) local data (Community GPI) Time, money, resources depend on indicator selection. But cf resources required for GDP: How often is that needed?
 new surveys (e.g. education); (d) local data (Community GPI) Time, money, resources depend on indicator selection. But cf resources required for GDP: How often is that needed .")
146
Data challenges A.National vs local / community B.Conceptual inadequacies (indicator choices) 1.E.g. education: We could not answer the question: How educated are Nova Scotians? 2.Conventional output indicators can’t do so 3.Development of new indicators, data sources, measurement methods is needed – multiple literacies 4.Comprehensive list of “ideal” indicators

147
Conclusion GPI key tool to achieve sustainability, health promotion targets, because it measures progress in way that joins social, health, economic & environmental objectives, and accounts for true benefits and costs Measuring progress towards objectives is an essential mark of genuine commitment to those goals and objectives NZ has potential to become genuine model

148
GPI: Measuring what we value to leave a healthier NZ for our children

149
Genuine Progress Index for Atlantic Canada Indice de progrès véritable - Atlantique www.gpiatlantic.org

Similar presentations


: A Disease of Affluence.>")


