Download presentation
Presentation is loading. Please wait.

1
1 Agriculture as a Producer of Energy Vernon R. Eidman Department of Applied Economics University of Minnesota

2
2 Purpose of Paper Document the amount of energy used by the U.S. economy and agriculture’s role in supplying it. Review current state of technology in energy production from agricultural biomass. Summarize recent literature on agriculture’s potential to supply energy.

3
3 U.S. economy consumed 97.1 quadrillion Btu of energy in 2001. Petroleum and Petroleum Products39% Natural Gas24% Coal23% Nuclear8.2% Renewables5.8% Net imports make up 27% of total energy consumed, 60% of petroleum and 18% of natural gas.

4
4 U.S. Renewable Energy Flows as a Percentage of Total, 2001 Hydroelectric2.36 Geothermal0.32 Solar0.06 Wood2.24 Waste0.57 Ethanol and Biodiesel0.15 Wind0.06 Total Renewables5.76

5
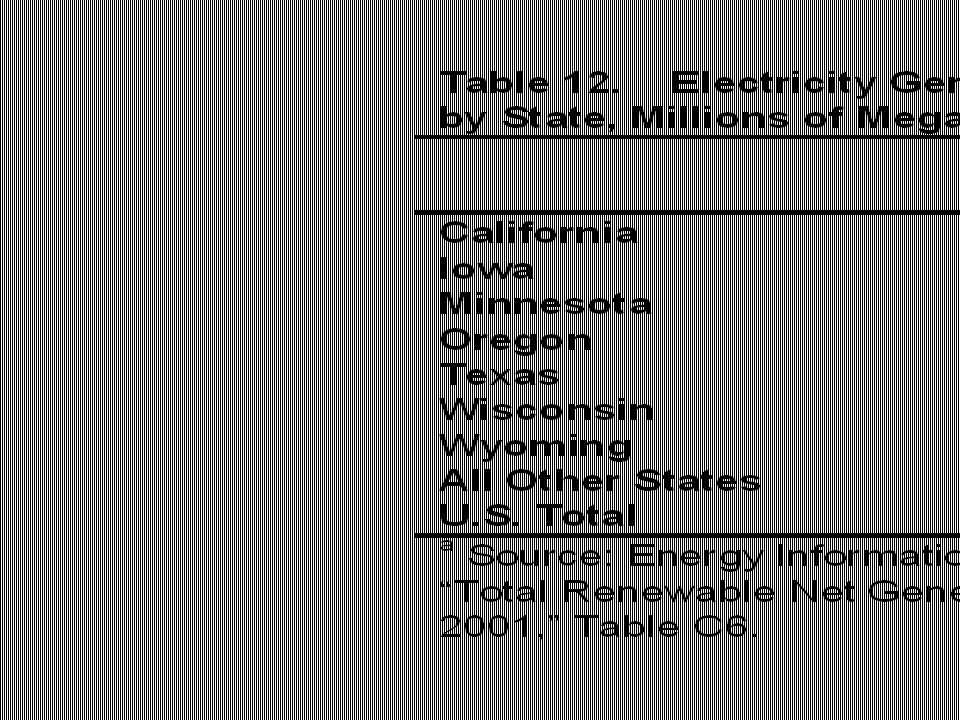
5 Production of ethanol, biodiesel, and electricity generated from wind turbines has been increasing rapidly. 2003 ethanol production, 2,810 million gallons, was up 32% from 2002, and represented 2.1% of U.S. gasoline supply. 2003 biodiesel production, 20 million gallons, was up 33% from 2002 and represented 0.05% of U.S. diesel consumption in 2003. Electricity generated from wind in 2002 was 10.5 million megawatts, up 56% over 2001, and represented 0.3% of U.S. electricity consumption.

6
6 Real prices of gasoline, diesel and natural gas have been higher during the 2000-2003 period than for 1994-1999 Average gasoline and diesel prices have been 35% higher. Natural gas prices have been 26% higher. Real electricity prices have been relatively constant over the past 8 years.

7
7 Energy Production from Agricultural Biomass: Technology and Costs

8
8 Ethanol

9
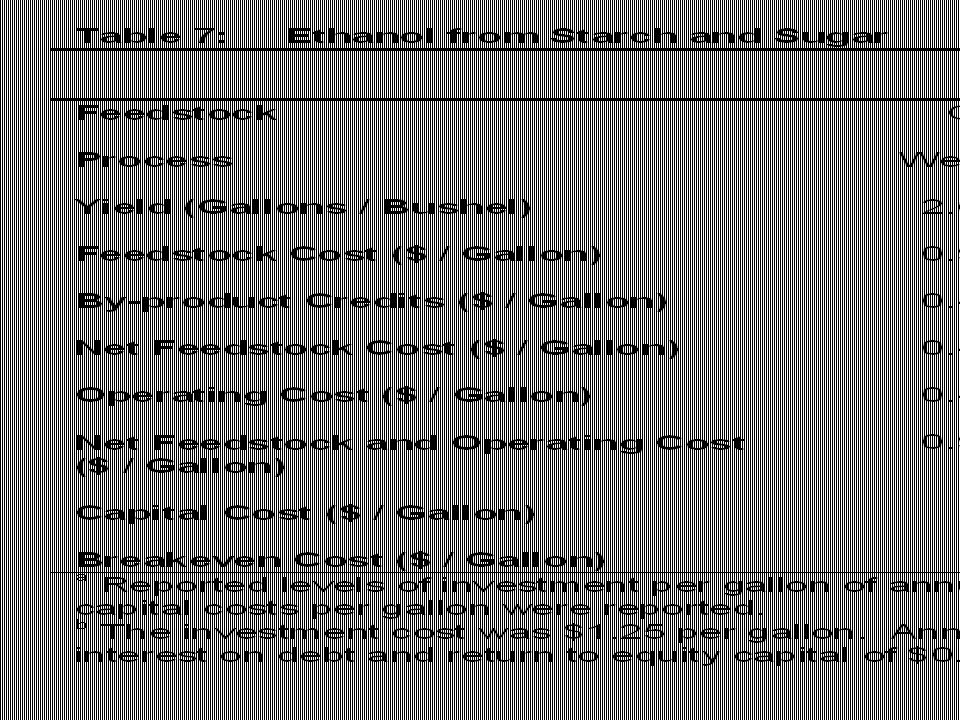
9 Ethanol from Starch Shapouri, et.al. USDA’s 1998 Ethanol Cost of Production Survey –Wet-mill processing grain –Dry-mill processing grain –Dry-mill processing waste starch and sugar Upper Midwest study conducted in 2003 reflects state of the art for dry-mill operations processing grain

11
11 Rack Ethanol Prices are highly dependent on the wholesale gasoline price. The demand for ethanol as an oxygenate can be expected to command a premium price when ethanol supplies are short. Ethanol’s demand as a fuel extender is driven largely by the wholesale price of gasoline.

12
12 Ethanol from Lignocellulosic Biomass Lignocellulosic biomass is the leafy or woody part of plants. Sources for ethanol production include: wood, wood waste, paper, corn stover, sugar cane bagasse, rice and wheat straw, switchgrass, etc. Primary components are cellulose, hemicellulose, and lignin.

13
13 National Renewable Energy Laboratory is developing a conversion process called “co-current dilute acid prehydrolysis and enzymatic hydrolysis. ” Pretreat biomass with dilute sulfuric acid to convert hemicellulose to sugar and other compounds. Remove acid and compounds that would be toxic to fermenting organisms. Add cellulase enzyme and maintain temperature to promote conversion of cellulose to glucose and ferment sugars to ethanol. Separate ethanol from water and solids. Burn waste products in a fluidized bed combustor to produce high pressure steam for electricity and process heat.

14
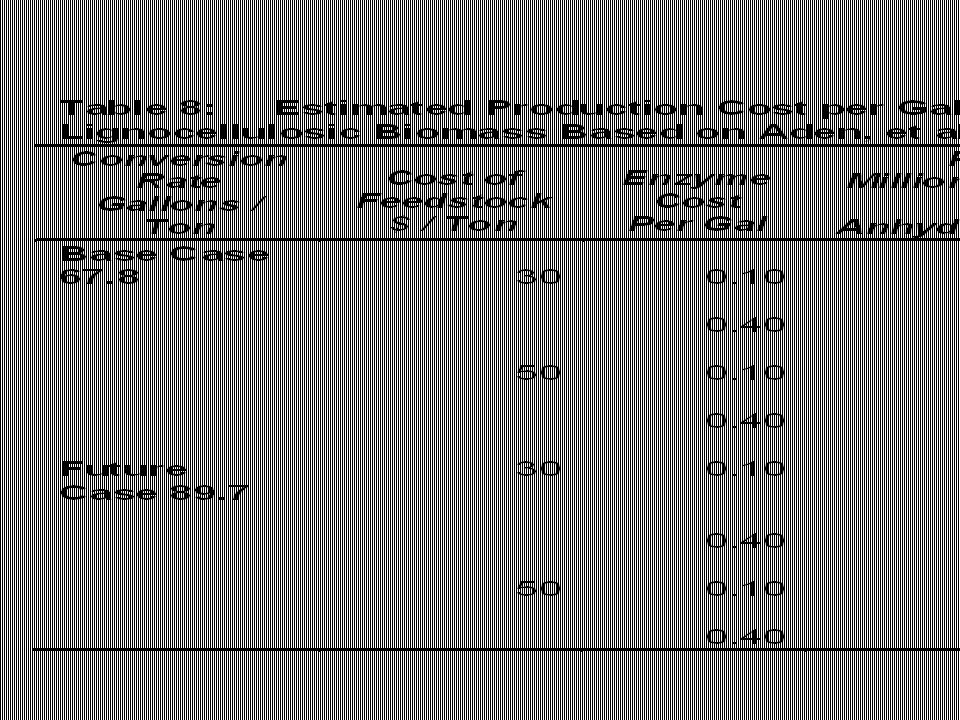
14 There are many uncertainties in the technology and cost of inputs. Three of the most important are: –The conversion rate –The cost of the feedstock –The cost of the cellulase enzyme

15
15 The estimated cost per gallon follows Aden et al.(2002) The investment and operating costs are for the n th plant. Plant processes 2205 tons per day. Plant operates 350 days per year, using 771,750 dry tons of lignocellulosic biomass. Estimated investment cost is $197.4 million.

17
17 Speculation on When Commercial Plants May Be Built to Produce Ethanol from Lignocellulosic Biomass There is currently 1 pilot plant in operation. Construction on pilot plants may begin over next few years. –May have access to niche sources of biomass at favorable costs. –May have several small plants in operation by 2010. Expected construction time is 2.5 years, suggesting it is unlikely large-scale plants using the new technology will be in production in less than 10 years.

18
18 New Technology in Lignocellulosic Biomass Processing Emphasis on developing cellulase enzyme that provides higher and more rapid conversion. Development of a biorefinery capable of producing a range of products – liquid fuels, power, chemicals.

19
19 Biodiesel Feedstock used depends on available supply, quality of feedstock and price. Potential diesel feedstocks produced in the United States, 3 year average (1993-95). Duffield, et.al. U.S. Biodiesel Development 1998 Soybean oil51.9 Corn oil7.2 Cottonseed oil4.2 Sunflower oil3.0 Other vegetable oils3.2 Yellow grease9.1 Inedible tallow12.6 Edible tallow5.2 Lard3.6 Total100
. Duffield, et.al. U.S. Biodiesel Development 1998 Soybean oil51.9 Corn oil7.2 Cottonseed oil4.2 Sunflower oil3.0 Other vegetable oils3.2 Yellow grease9.1 Inedible tallow12.6 Edible tallow5.2 Lard3.6 Total100.")
20
20 Feasibility of biodiesel production facility – Haas et al. 2004 Continuous-process vegetable oil transesterification, and ester and glycerol recovery. Assumes partial purification of glycerol and selling 80% glycerol to industrial glycerol refiners. 10 million gallon per year plant Feedstock is crude degummed soybean oil

21
21 Feasibility of biodiesel production facility – Haas et al. 2004 Total investment is $11. 5 million or $1.15 / gallon of annual capacity. 7.4 pounds of soy oil per gallon of biodiesel. Operating costs are $0.2550. Capital costs are $0.2292 per gallon. Sale of co-product 0.128 per gallon. Cost per gallon of biodiesel –$1.83 per gallon with degummed soybean oil costing $0.20 / pound. –$2.58 per gallon with degummed soybean oil costing $0.30 / pound.

22
22 Electricity from Wind Power

23
23 EIA estimates generating electricity using wind turbines is competitive with other sources of energy. a New generating capacity for 2010 –Gas is lowest cost, 49.66 mills/Kwh –Wind is a close second, 50.54 mills/Kwh New generating capacity for 2025 –Coal is lowest cost, 53.20 mills/Kwh –Gas is second, 54.38 mills/Kwh –Wind is third, 58.33 mills/Kwh a Source: EIA, Annual Energy Outlook, 2004.

24
24

26
26 The rate of development of generating capacity from wind has been highly dependent on the availability of the Federal Production Tax Credit, which expired December 31, 2003.

27
27 Anaerobic Digesters Enable large livestock operations and food processors to deal with a social problem Are management intensive Economic feasibility usually rests on reducing an expense (for disposal of waste, etc.), and substitution of the gas produced for purchased fuel and/or use of the gas to generate electricity
, and substitution of the gas produced for purchased fuel and/or use of the gas to generate electricity")
28
28 Resource Base and Potential Growth of Bioenergy U.S.D.A. Effects on the Farm Economy of a Renewable Fuels Standard for Motor Vehicle Fuel. Washington, DC: Office of Energy Policy and New Uses, USDA, 2002. De La Torre Ugarte, et.al. The Economic Impacts of Bioenergy Crop Production on U.S. Agriculture. Agricultural Economics Report 816. Washington, DC: USDA, Office of Energy Policy and New Uses, 2003. Gallagher, et. al. Biomass From Crop Residues: Costs and Supply Estimates. Agricultural Economics Report 819. Washington, DC:USDA, Office of Energy Policy and New Uses, 2003.

29
29 Summary comments on Projected Growth in Ethanol and Biodiesel Model suggests U.S. can produce 4.4 billion gallons of ethanol from grain. Producing as much as 124 million gallons of biodiesel from soybean oil causes major adjustments in other domestic uses and exports of soybean oil. The model results would be somewhat different starting from current stocks and prices, but probably not too different.

30
30 Meeting Clean Air Mandates without MTBE U.S. used 2.4 billion gallons of methyl tertiary butyl ether (MTBE) during 2002. Ethanol has a higher percentage of oxygen than MTBE and only about 1.2 billion gallons is needed. Ethanol production in 2002 was 2.1 billion gallons, suggesting ethanol can supply the demand for oxygenate for gasoline.
 during Ethanol has a higher percentage of oxygen than MTBE and only about 1.2 billion gallons is needed. Ethanol production in 2002 was 2.1 billion gallons, suggesting ethanol can supply the demand for oxygenate for gasoline..")
31
31 Blending Biodiesel and Diesel Fuel Blending even small percentages of biodiesel with petroleum diesel improves lubricity and reduces emissions. U.S. consumed 39,930 million gallons of diesel fuel. –2% blend would require 798.6 million gallons of biodiesel –5% blend would require 1,996.5 million gallons of biodiesel

32
32 Bioenergy Crop production Wildlife Management Scenario Production Management Scenario Million Acres19.4041.90 Million Dry Tons96.00188.10 Quads1.542.92 a Source: De la Torre Ugarte, et. al., Table 15.

33
33 Biomass from Crop Residue Estimated supply functions for crop residue by region. Excluded residue needed for conservation and erosion control. Assumed residue is available at its opportunity cost Source: Gallagher, et al.

34
34 Results on Crop Residue Indicate: 2/3 of total industry supply in U.S. would be available in Corn Belt and ¼ would be available in Great Plains. Industry supply is 145 million tons 90% of industry supply, 130.5 million tons, would be available for $35 per ton

35
35 Summary of Bioenergy Supplies from Agriculture With stronger world petroleum demand, the demand for ethanol and biodiesel is expected to remain strong. –4.4 billion gallons of ethanol from grain –0.1 to 0.2 billion gallons of biodiesel, although not all from soybean oil

36
36 Summary of Bioenergy Supplies from Agriculture Producing above levels of ethanol and biodiesel will result in fewer acres shifting from major crops to switchgrass. Wildlife Scenario Production Scenario Million Dry Tons Bioenergy Crop Production96.0188.10 Adjustment for Corn, S.B. Acerage -35.4-57.4 Crop Residue: 90% of Ind. Supply 130.5 Total Lignocellulosic Biomass191.1261.2

37
37 World Ethanol Production for All Uses, 2001 a Million GallonsPercent of World Americas5,441.061.3 Europe1,670.718.8 Asia1,576.617.8 Oceania47.40.5 Africa140.81.6 Total8,876.6100.0 a Source: Berg, Christoph. World Ethanol Production 2001. The Distilling and Ethanol Network. Available at http://www.distill.com/world_ethanol_production.htm

38
38 EU Biodiesel Industry: Estimated Production, 2002 Source: Foreign Agricultural Service, USDA. EU Biodiesel Industry Expanding Use of Oilseeds. September 20, 2003. Available at http://fas.usda.gov. http://fas.usda.gov Conversion from metric tons to gallons based on 7.337 pounds per gallon. Source is Chevron Products Company. Diesel Fuels Technical Review, Chevron, USA, 1998, p. 28 & 31. CountryMillion Gallons Germany135.2 France110.0 Italy63.1 Austria7.5 Denmark3.0 U.K.0.9 Sweden0.3 Total320.0

39
39 Some Areas for Further Research Analyze the role of other crops and imports of vegetable oils as feedstock for biodiesel. Analyze the role of imports and exports in the development of the biofuels industry. Complete a more integrated analysis of the amount of ethanol from grain, biodiesel and lignocellulosic biomass that would be supplied at various price levels, and update this periodically. Study the economic feasibility of biorefining.

Similar presentations