Download presentation
Presentation is loading. Please wait.

1
Success in the New Economy: How all Students can gain a Competitive Advantage Kevin Fleming PhD October 14, 2014

2
education counts $114,800 $33,938 $63,310 $41,473

3
USA Median Annual Earnings by Education $200,000 in debt Earning $36,000/year

4
(but skills count more) education counts
 education counts")
5
The Fate of 20 Ninth Graders (Nationally) 6 drop out (30%) 6 graduate & go to work (30%) 8 Enroll in college (40%) 4 Drop out (20%) 4 Graduate in five years (20%) 2 Take “gray collar” jobs, nationally (10%) 2 Win the one-way-to-win game (10%)
 6 drop out (30%) 6 graduate & go to work (30%) 8 Enroll in college (40%) 4 Drop out (20%) 4 Graduate in five years (20%) 2 Take gray collar jobs, nationally (10%) 2 Win the one-way-to-win game (10%)")
6
21%

7
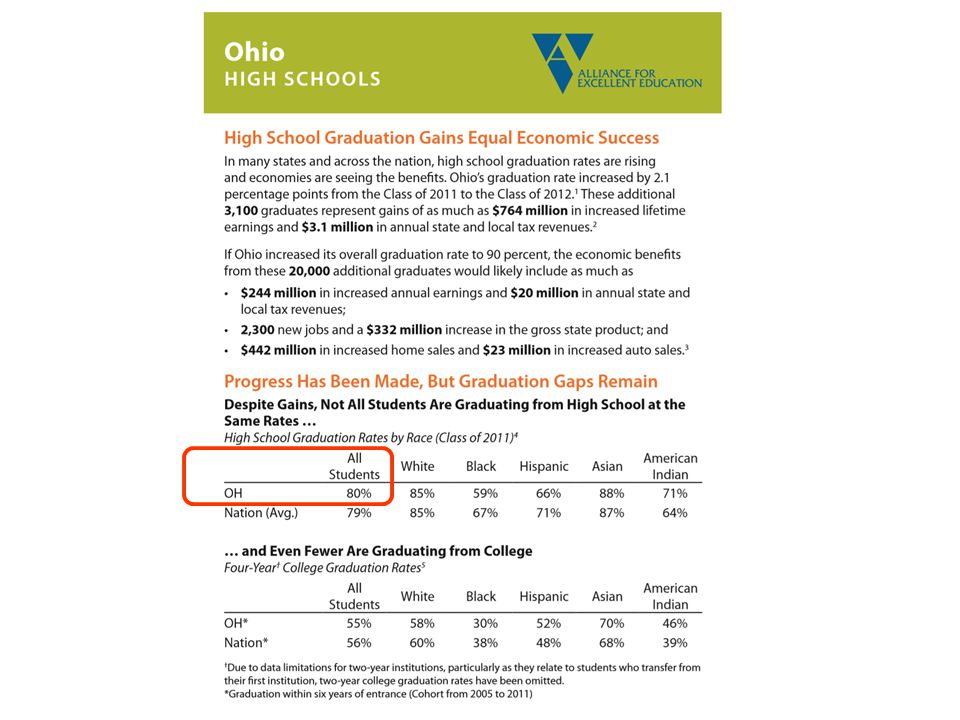
Ohio: by the numbers (Ohio Department of Education, Race to the Top Dropout Tracking Report) 3.9% drop out annually (9-12 th grade) Appr. 14.7% of all students dropout during high school

8
Ohio: by the numbers (Ohio Department of Education, Race to the Top Dropout Tracking Report & NCES) 3.9% drop out annually (9-12 th grade) Appr. 14.7% of all students dropout during high school (NCES indicates 15.78% dropout) Among the 85.3% that become seniors, 71.1% met graduation standard (proficiency or above on OGT) Nevertheless, Ohio has an 81.4% average graduation rate (NCES)
 Among the 85.3% that become seniors, 71.1% met graduation standard (proficiency or above on OGT) Nevertheless, Ohio has an 81.4% average graduation rate (NCES).")
10
Ohio: by the numbers (Ohio Department of Education, Race to the Top Dropout Tracking Report & NCES) 3.9% drop out annually (9-12 th grade) Appr. 14.7% of all students dropout during high school (NCES indicates 15.78% dropout) Among the 85.3% that become seniors, 71.1% met graduation standard (proficiency or above on OGT) Nevertheless, Ohio has an 81.4% average graduation rate (NCES) Thus, 69.43% of 9 th graders graduate from high school (in 5 years)
 Among the 85.3% that become seniors, 71.1% met graduation standard (proficiency or above on OGT) Nevertheless, Ohio has an 81.4% average graduation rate (NCES) Thus, 69.43% of 9 th graders graduate from high school (in 5 years).")
11
Ohio: by the numbers (NCES. 2012 Tables and Figures) Number of graduates from all high schools: 136,740 Number of first-time freshmen graduating from high school in the previous 12 months, enrolled in institutions: In any state: 84,068 In state: 71,583 Estimated rate of high school graduates going to college, In any state: 61.5% In state: 52.3%
 Number of graduates from all high schools: 136,740 Number of first-time freshmen graduating from high school in the previous 12 months, enrolled in institutions: In any state: 84,068 In state: 71,583 Estimated rate of high school graduates going to college, In any state: 61.5% In state: 52.3%.")
12
Ohio: by the numbers (Ohio Department of Education, 2012-13 State Profile, & NCES) 100% 9 th graders - 14.7% dropouts - 18.6% non-graduating seniors - 47.7% not college/university bound (in state) 36.32% of 9 th graders directly enroll in OH higher education 100% 9 th graders - 14.7% dropouts - 18.6% non-graduating seniors - 38.5% not college/univ bound (61.5% national postsecondary enrollment) 42.71% of 9 th graders eventually enroll in any college, anywhere
 100% 9 th graders % dropouts % non-graduating seniors % not college/university bound (in state) 36.32% of 9 th graders directly enroll in OH higher education 100% 9 th graders % dropouts % non-graduating seniors % not college/univ bound (61.5% national postsecondary enrollment) 42.71% of 9 th graders eventually enroll in any college, anywhere")
13
Ohio: by the numbers (Ohio Department of Education, 2012-13 State Profile, & NCES) 100% 9 th graders - 14.7% dropouts - 18.6% non-graduating seniors - 47.7% not college/university bound (in state) 36.32% of 9 th graders directly enroll in OH higher education According to NCES, the Four-Year graduation rate in Ohio is 55% ( 4-year university graduation within six years of entrance)
 100% 9 th graders % dropouts % non-graduating seniors % not college/university bound (in state) 36.32% of 9 th graders directly enroll in OH higher education According to NCES, the Four-Year graduation rate in Ohio is 55% ( 4-year university graduation within six years of entrance)")
14
57% of Ohio 9 th graders Don’t play the One-Way-to-Win game Do not immediately enroll in higher education

15
The Three“Rs” Reading Writing Arithmetic Relevance Reality Five

16
Most Jobs in the Workplace are Middle Skilled: (e.g. the Health Care Industry) Ratio: 1 to 2 to 7
 Ratio: 1 to 2 to 7")
17
www.daytonregion.com

18
By 2018, most jobs will not require a BA Source: March CPS data, various years; Center on Education and the Workforce forecast of educational demand to 2018, as reported in Pathways to Prosperity (Harvard, February, 2011)
")
19
“The society which scorns excellence in plumbing because plumbing is a humble activity and tolerates shoddiness in philosophy because it is an exalted activity will have neither good plumbing nor good philosophy. Neither its pipes nor its theories will hold water” - John Gardner, 1961

20
Median, 25th Percentile, and 75th Percentile Earnings of Full-Time Year-Round Workers Ages 25 and Older, by Gender and Education Level, 2011 Sources: The College Board, Education Pays 2013, Figure 1.5; U.S. Census Bureau, 2012, Table PINC-03; U.S. Census Bureau, 2012a; calculations by the authors AA/AS recipients $26,900 - $71,900 BA/BS recipients $35,100 - $100,000

21
The fact is that large numbers of CA college graduates leave school as unsure of what they will do “ when they grow up ” (except perhaps continue to go to school) as they were when they started. – CA Postsecondary Education Commission

22
Meet Mike! BA Film Production (LMU) Music Video Production Company Bartender Real Estate Agent Forklift Operator FIDM – fashion school Fabric buyer for BCBG Raw materials manager for American Apparel Two website start-ups Financial Planner Women’s casual wear clothing line Screen writing Photographer
 Music Video Production Company Bartender Real Estate Agent Forklift Operator FIDM – fashion school Fabric buyer for BCBG Raw materials manager for American Apparel Two website start-ups Financial Planner Women’s casual wear clothing line Screen writing Photographer.")
23
30% of associate degree holders have higher annual earnings as 4-yr grads

24
83% of associate degree holders have the same or higher annual earnings as 4-yr grads

25
https://vimeo.com/56875546

27
Determine the Goal HS graduation? College? University? College and graduation? College, graduation and commensurate employment? A productive & successful life?

28
CTE is to some teens what AP & Honors is to others

29
Thank You! Kevin Fleming www.TelosES.com

Similar presentations