Download presentation
Presentation is loading. Please wait.

1
Traditional Method 2 proportions

2
The President of a homeowners’ association believes that pink flamingos on lawns are tacky, or as she puts it, “detrimental to the aesthetic integrity of the neighborhood.” For years, she has dreamed of passing a ban on these “offensive” decorations, but she has been blocked by homeowners who are very attached to their pink flamingos. Personally, I think we’re quite attractive.

3
In an effort to determine when best to put forward her proposed ban, she has begun an annual poll of her neighbors’ feelings on the “offending” birds. Last year, she surveyed 100 homeowners and found that 40 of them found the birds “aesthetically displeasing.” This year, she surveyed 120 homeowners and found that 42 of them found the birds “aesthetically displeasing.” I’m offended. Me too. Let’s do a survey of our own on how many flamingos find her displeasing.

4
Distressed by these findings, she believes she is actually losing ground on this issue. She immediately decides to do a statistical analysis to test the theory that the proportion of homeowners who find pink flamingos “aesthetically displeasing” has decreased. Help her out by using the Traditional method with α =.01 to test the claim that the proportion of homeowners opposed to the birds has decreased.

5
If you’d like to work through this problem on your own, go ahead. Just click the flamingo below when you’re ready to check your answer. Otherwise, keep clicking through the slideshow and we’ll work through this problem together.

6
Set-up

7
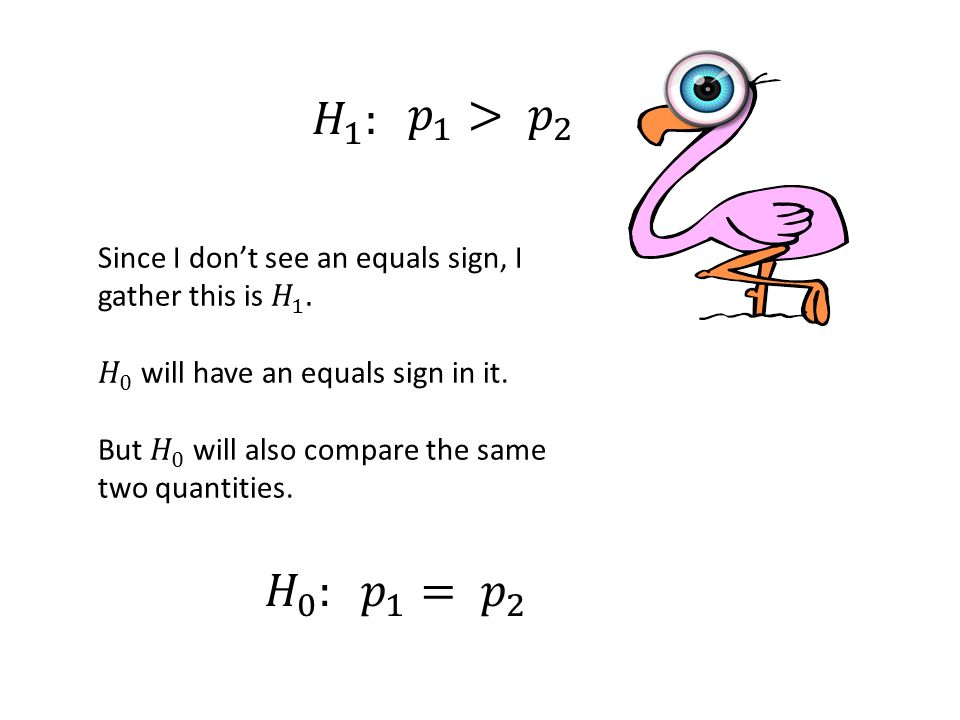
Step 1: State the hypotheses and identify the claim. The claim is that “the proportion of homeowners opposed to the birds has decreased.” If this is true, then the proportion opposed to the birds this year is smaller than the proportion last year. Equivalently, the proportion opposed last year is bigger than the proportion opposed this year.

8
Step 1 State the hypotheses and identify the claim. No hats on those p’s! The hypotheses are about population proportions, not sample proportions!

9
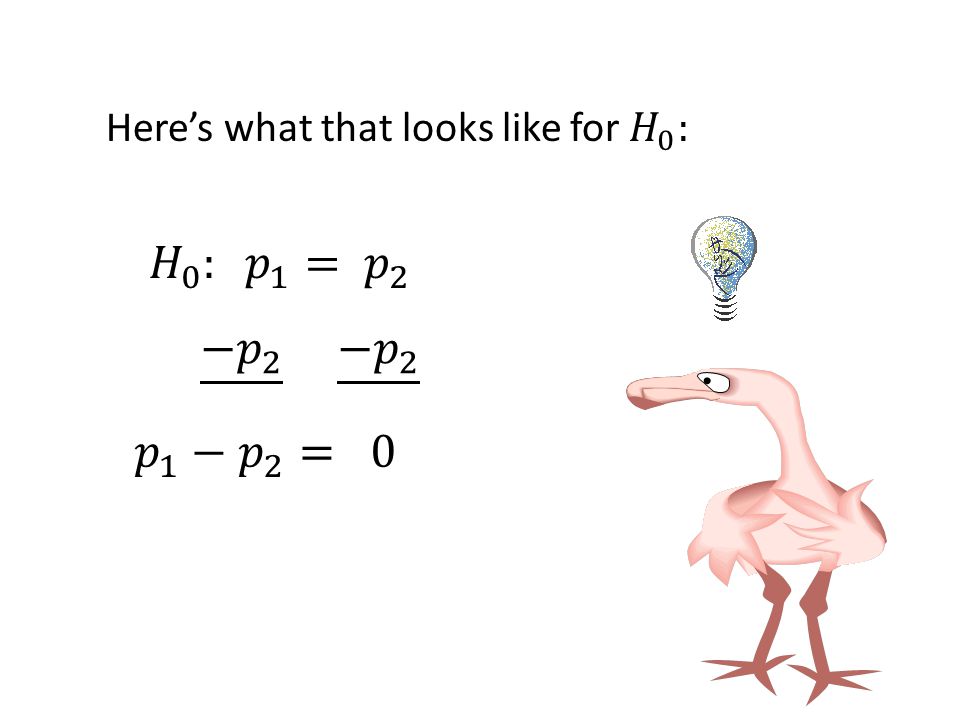
We can use either inequality, but planning ahead, we might prefer the “greater than.” We will eventually want to subtract everything over to one side. This way, if we subtract everything over to the to left side, we’ll get an inequality involving “greater than 0.” “Greater than 0” means “positive,” and I like positive numbers!

11
If we subtract everything over to the left side, we’ll get the number that goes at the center of our distribution!

13
So, our hypotheses are:

14
Step (*) Draw the picture and label the area in the critical region.
 Draw the picture and label the area in the critical region.")
15
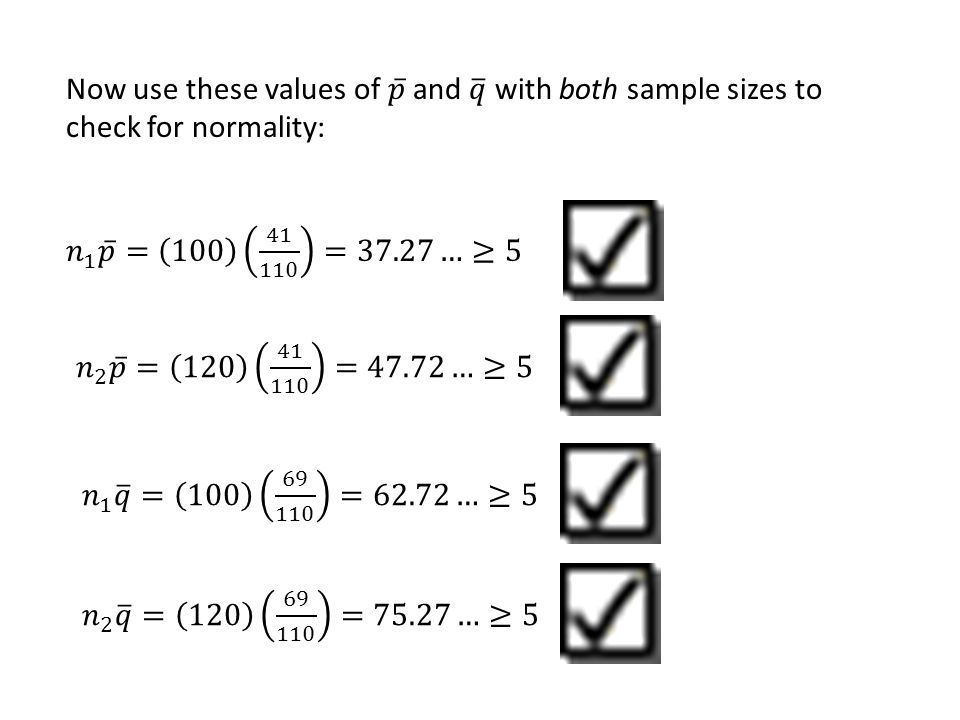
Do we know we have a normal distribution? It’s proportions! We have to check!

16
The basic rule is that for both samples np and nq have to be at least 5. And we’re supposed to use the HYPOTHESIZED values of p and q in checking this. But what are the hypothesized values of p and q?

17
The number from the hypotheses is the hypothesized value for the difference in the two proportions, not for the population proportion.

18
We’ll keep this as a fraction since the decimal repeats and we don’t want to round this early in the problem!

19
get a common denominator

21
Step (*): Since we have a normal distribution, draw a normal curve. Top level: Area Middle level: standard units(z) We always use z-values when we are working with proportions.
 We always use z-values when we are working with proportions..")
22
Step (*): Since we have a normal distribution, draw a normal curve. Top level: Area Middle Level: Standard Units (z) 0 The center is always 0 in standard units. Label this whenever you draw the picture.
 0 The center is always 0 in standard units. Label this whenever you draw the picture..")
23
Step (*): Since we have a normal distribution, draw a normal curve. Top level: Area Middle Level: Standard Units (z) 0 Bottom level: Actual Values There are no units for proportions.
 0 Bottom level: Actual Values There are no units for proportions..")
24
Step (*): Since we have a normal distribution, draw a normal curve. Top level: Area Middle Level: Standard Units (z) 0 Bottom level: Actual Values 0 The number from the Null Hypothesis always goes in the center of the bottom level; that’s because we’re drawing the picture as if the Null is true.
 0 Bottom level: Actual Values 0 The number from the Null Hypothesis always goes in the center of the bottom level; that’s because we’re drawing the picture as if the Null is true..")
25
Then remember: The raditional Method T is op-down T

26
Step (*): (continued) Once you’ve drawn the picture, start at the Top level and label the area in the critical region. Standard Units (z) 0 Actual Values 0 Top level: Area.01
 0 Actual Values 0 Top level: Area.01.")
27
Step 2: Move down to the middle level and mark off the critical value; this is the boundary of the tail in standard units. Standard Units (z) 0 Actual Values 0.01 Middle level Put critical value here.
 0 Actual Values 0.01 Middle level Put critical value here..")
28
We can find the critical value using either Table E or Table F. Click on the table you want to use. Table E gives us the z-values associated with certain areas under the standard normal curve The bottom row of table F gives us the z- values associated with the area in the tail/s.

29
Ok, we’ll use Table E

30
Our picture looks like this: (we know the area to the right of the critical value, and want to know the critical value.) 0. 01 ? To use Table E, we want to have our picture match this one, where we know the area to the left of the critical value. We can subtract the area in the right tail from the total area (1) to get the area to the left! 1-.01=.99
 to get the area to the left =.99.")
31
So now we look for an area of.99 (with 4 decimal places this will be.9900) in the area part of Table E.
 in the area part of Table E.")
32
We’ll have to zoom in.

33
The area closest to.9900 is.9901. Our critical value is z = 2.33.

34
So now we can add the critical value to our picture. Standard Units (z) 0 Actual Values 0.01 Middle level Put critical value here. 2.33
 0 Actual Values 0.01 Middle level Put critical value here")
35
Step 3: Standard Units (z) 0 Actual Values 0.01 2.33 Bottom level
 0 Actual Values Bottom level")
36
Standard units (z) 0 Actual values 0.01 2.33 ARGGGH!.05 > 0 so it’s to the right of center, but which spot does it go in? Is it far enough right that it falls in the critical region?

37
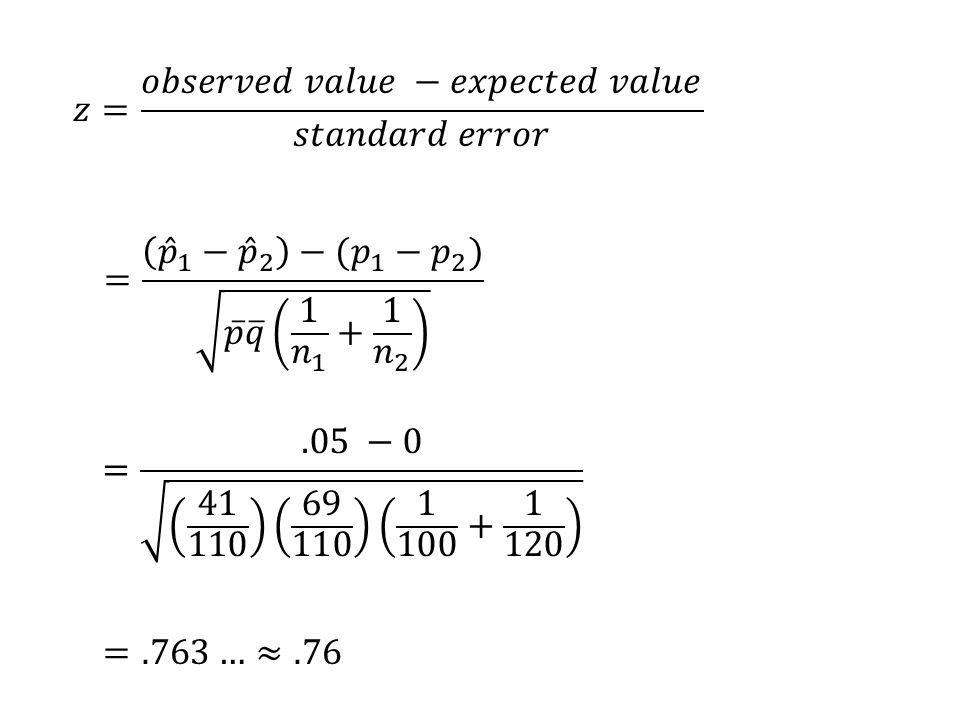
In order to see where.05 goes, we’ll convert it to standard units so that we can see whether it should go to the left or right of 2.33. Why am I always the one who has to come up with the good ideas?

38
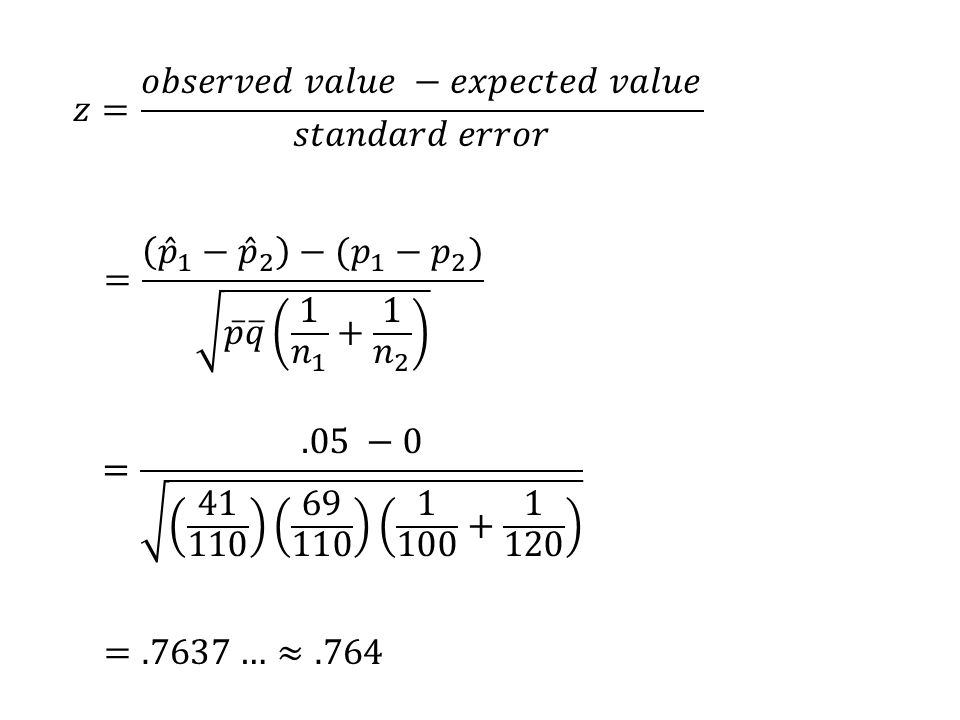
Standard error for the distribution of the difference in sample proportions

39
.4 -.35 hypothesized difference

41
Standard units (z) 0 Actual values 0.01 2.33 Now we can add the observed value to the picture!.76.76 < 2.33 so it goes to the left of the critical value..05 Line up the observed value,.05, with.76.
 0 Actual values Now we can add the observed value to the picture! < 2.33 so it goes to the left of the critical value..05 Line up the observed value,.05, with.76.")
42
Standard units (z) 0 Actual values 0.01 2.33.76.05
 0 Actual values")
43
Step 5: Answer the question.

44
There is not enough evidence to support the claim that the proportion of homeowners opposed to pink flamingos has decreased.

45
Would you mind summarizing all that?

46
Each click will give you one step. Step (*) is broken into two clicks. Step 1. Step (*) Standard units (z) 0 Actual values 0.01 Step 2 2.33 Step 3.76.05 Step 5: There is not enough evidence to support the claim.
 Standard units (z) 0 Actual values 0.01 Step Step Step 5: There is not enough evidence to support the claim..")
47
And there was much rejoicing.

48
Press the escape key to exit the slide show. If you keep clicking through, you’ll re-calculate the critical value using Table F instead of Table E.

49
Look at the top of Table F to determine which column will contain our critical value. Since this is a one-tailed test, look for α =.01 in this row.

50
Since our standard units are z-values, be sure to go all the way to the bottom row of Table F, the one labeled “z.”

51
2.326 z = 2.326

52
So now we can add the critical value to our picture. Standard Units (z) 0 Actual Values 0.01 Middle level Put critical value here. 2.326
 0 Actual Values 0.01 Middle level Put critical value here")
53
Step 3: Standard Units (z) 0 Actual Values 0.01 2.326 Bottom level
 0 Actual Values Bottom level")
54
Standard units (z) 0 Actual values 0.01 2.326 ARGGGH!.05 > 0 so it’s to the right of center, but which spot does it go in? Is it far enough right that it falls in the critical region?

55
In order to see where.05 goes, we’ll convert it to standard units so that we can see whether it should go to the left or right of 2.326. Why am I always the one who has to come up with the good ideas?

56
Standard error for the distribution of the difference in sample proportions

57
.4 -.35 hypothesized difference

59
Standard units (z) 0 Actual values 0.01 2.33 Now we can add the observed value to the picture!.764.764 < 2.326 so it goes to the left of the critical value..05 Line up the observed value,.05, with.764.
 0 Actual values Now we can add the observed value to the picture! < so it goes to the left of the critical value..05 Line up the observed value,.05, with.764.")
60
Standard units (z) 0 Actual values 0.01 2.33.764.05
 0 Actual values")
61
Step 5: Answer the question.

62
There is not enough evidence to support the claim that the proportion of homeowners opposed to pink flamingos has decreased.

63
Would you mind summarizing all that?

64
Each click will give you one step. Step (*) is broken into two clicks. Step 1. Step (*) Standard units (z) 0 Actual values 0.01 Step 2 2.326 Step 3.764.05 Step 5: There is not enough evidence to support the claim.
 Standard units (z) 0 Actual values 0.01 Step Step Step 5: There is not enough evidence to support the claim..")
65
And there was much rejoicing.

Similar presentations


.>")


 and a score between 136 and 145 is considered normal.>")


 Note: In this version, we’ll use Excel to do all the calculations. If you wanted the tutorial that worked through.>")


