Download presentation
Presentation is loading. Please wait.

1
The Family Tree of Quality Improvement
Faye Nipps, MBA, BSN, CPHQ

2
Objectives Clarify knowledge of the Transition of Health and Care in America Identify three strategies to improve cardiac health through Best Practice Intervention Packages (BPIPS) and Home Health Quality Improvement (HHQI) Communicate assistance provided for home health agencies (HHAs) on improving influenza, pneumococcal and herpes zoster immunization rates, reducing hospital readmissions and improving medication safety Provide resources for data-driven performance improvement from HHQI and the TMF Quality Innovation Network Quality Improvement Organization (QIN-QIO) Clarify knowledge of the Transition of Health and Care in America Identify 3 strategies to improve Cardiac Health through Best Practice Intervention Practices (BPIPS) and HHQI. Communicate assistance provided for Home Health Agencies on improving immunization rates for Influenza, Pneumococcal and Herpes Zoster, reducing hospital readmissions and improving medication safety. Provide resources for data driven performance improvement from HHQI and TMFQIN
 and Home Health Quality Improvement (HHQI) Communicate assistance provided for home health agencies (HHAs) on improving influenza, pneumococcal and herpes zoster immunization rates, reducing hospital readmissions and improving medication safety. Provide resources for data-driven performance improvement from HHQI and the TMF Quality Innovation Network Quality Improvement Organization (QIN-QIO) Clarify knowledge of the Transition of Health and Care in America. Identify 3 strategies to improve Cardiac Health through Best Practice Intervention Practices (BPIPS) and HHQI. Communicate assistance provided for Home Health Agencies on improving immunization rates for Influenza, Pneumococcal and Herpes Zoster, reducing hospital readmissions and improving medication safety. Provide resources for data driven performance improvement from HHQI and TMFQIN.")
3
The Centers for Medicare and Medicaid Services

4
Family Tree of HHQI The Triple Aim objectively gives us guidance for where we are going in health care today to help us understand “Why We Do This”. What is Your Story? Creating Partnerships with HHQI to enhance understanding of Best Practices (BPIPS) utilizing the Cardiac Registry, Cardio LAN, Data Rich Resources TMFQIN promotes alignment of CMS quality initiatives for Home Health. Explore the new projects, resources and technical assistance available to Home Health in the Quality Innovation Network Data driven performance Improvement creates synergy for the future of value base purchasing. Being proactive in the face of uncertainty. Note: the Million Hearts® word and logo marks are owned by the U.S. Department of Health and Human Services (HHS). Use of these marks does not imply endorsement by HHS. Use of the Marks also does not necessarily imply that the materials have been reviewed or approved by HHS.
 utilizing the. Cardiac Registry, Cardio LAN, Data Rich Resources. TMFQIN promotes alignment of CMS quality initiatives for Home Health. Explore the new projects, resources and technical assistance available to Home Health in the Quality Innovation Network. Data driven performance Improvement creates synergy for the future of value base purchasing. Being proactive in the face of uncertainty. Note: the Million Hearts® word and logo marks are owned by the U.S. Department of Health and Human Services (HHS). Use of these marks does not imply endorsement by HHS. Use of the Marks also does not necessarily imply that the materials have been reviewed or approved by HHS.")
5
2014 Success

6
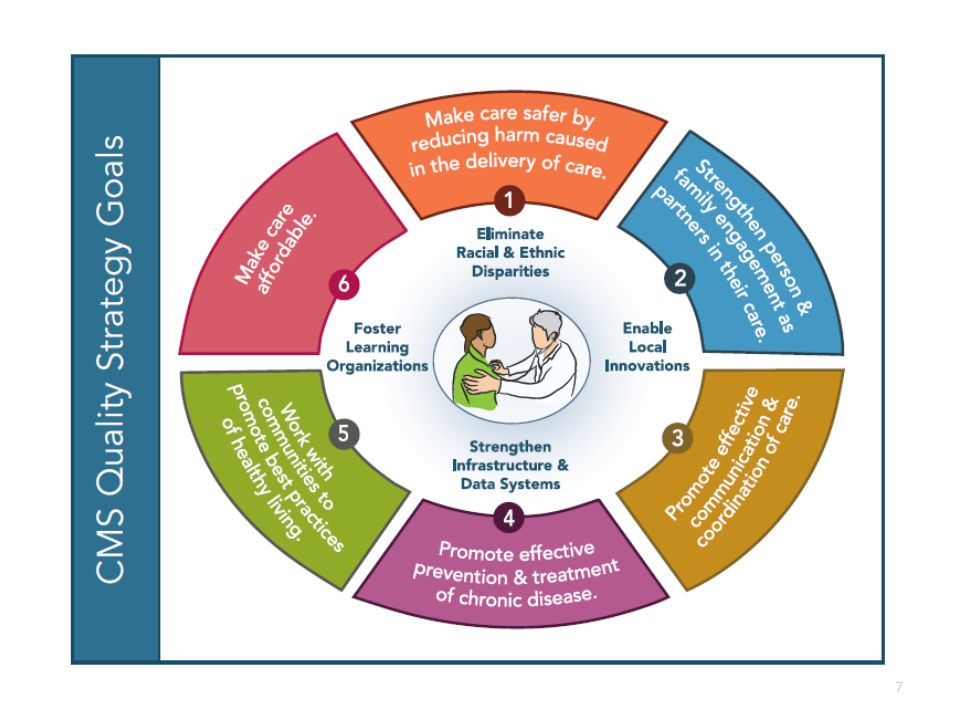
The Triple Aim – CMS QIN-QIO Approach to Clinical Quality
Goals National Patient Safety Make care safer Strengthen person and family engagement Promote effective communication and coordination of care Promote effective prevention and treatment Promote best practices for healthy living Make care affordable Through the Better Care aim, the Strategy pursues improvement to the overall quality of health care by making health care more patient-centered, reliable, accessible and safe. Better Care: Improve overall quality, by making health care more patient-centered, reliable, accessible, and safe. Through the Healthy People/ Healthy Communities aim, the Strategy guides the nation in improving population health by supporting proven interventions to address behavioral, social, and environmental determinants of health in addition to delivering higher-quality care. Healthy People/Healthy Communities: Improve the health of the U.S. population by supporting proven interventions to address behavioral, social and, environmental determinants of health And through the Affordable Care aim, the Strategy seeks to reduce the cost of quality health care for individuals, families, employers, and government. Affordable Care: Reduce the cost of quality health care for individuals, families, employers, and government. Foundational Principles Enable innovation Foster learning organizations Eliminate disparities Strengthen infrastructure and data systems

8
Our Heritage Video Source: CMS QIO Program Documentary,

9
TMF QIN-QIO

10
11th Statement of Work (SOW) QIN-QIO Map
TMF has built a strong quality improvement team throughout the multi-state region, partnering with longtime, successful quality improvement entitiesTMF Health Quality Institute has partnered with the Arkansas Foundation for Medical Care, Primaris in Missouri and the Quality Improvement Professional Organization, Inc. in Puerto Rico to form the TMF Quality Innovation Network Quality Improvement Organization (TMF QIN-QIO), under contract with the Centers for Medicare & Medicaid Services (CMS). The TMF QIN-QIO works with providers across all care settings to provide quality improvement services in the states of Arkansas, Missouri, Oklahoma and Texas, and the territory of Puerto Rico.
, under contract with the Centers for Medicare & Medicaid Services (CMS). The TMF QIN-QIO works with providers across all care settings to provide quality improvement services in the states of Arkansas, Missouri, Oklahoma and Texas, and the territory of Puerto Rico.")
11
About the QIN-QIO Program
Leading rapid cycle, large-scale change in health quality: Goals are bolder. The patient is at the center. All improvers are welcome. Everyone teaches and learns. Greater value is fostered. The Quality Innovation Network-Quality Improvement Organization (QIN-QIO) Program is the largest federal program dedicated to improving health quality at the community level. QIN-QIOs in defined regions across the country, united in a network administered by CMS, have the flexibility to respond to local needs. Leading rapid, large-scale change in health quality In August 2011, the Centers for Medicare & Medicaid Services gave the program an updated charter for leading change. Here are some of the biggest differences between today’s program and that of the past: • Goals are bolder. The QIN-QIO Program supports the aims of the Department of Health and Human Services’ National Quality Strategy. Providers that work with their QIN-QIO, for example, will contribute to improved cardiac health, fewer avoidable hospital readmissions, and a 40% national reduction in health care-acquired conditions. • The patient is at the center. By including the voice of the beneficiary in all their activities, QIN-QIOs are leading the way to patient-centered care. They will equip both providers and patients for shared health care decision making through a national Patient and Family Engagement Campaign. • All improvers are welcome. Embracing “boundarilessness” as a prerequisite for system-wide change, QIN-QIOs are breaking down organizational, cultural and geographic barriers. Initiatives are open to providers at all levels of clinical performance that make a commitment to improvement. • Everyone teaches and learns. Through large-scale learning and action networks, QIN-QIOs are accelerating the pace of change and rapidly spreading best practices. Improvement initiatives include collaborative projects, online interaction and peer-to-peer education. • Greater value is fostered. QIN-QIOs will support CMS’ new value-based purchasing programs with technical assistance to providers that includes sharing best practices, assisting with data analysis and conducting improvement activities.
 Program is the largest federal program dedicated to improving health quality at the community level. QIN-QIOs in defined regions across the country, united in a network administered by CMS, have the flexibility to respond to local needs. Leading rapid, large-scale change in health quality. In August 2011, the Centers for Medicare & Medicaid Services gave the program an updated charter for leading change. Here are some of the biggest differences between today’s program and that of the past: • Goals are bolder. The QIN-QIO Program supports the aims of the Department of Health and Human Services’ National Quality Strategy. Providers that work with their QIN-QIO, for example, will contribute to improved cardiac health, fewer avoidable hospital readmissions, and a 40% national reduction in health care-acquired conditions. • The patient is at the center. By including the voice of the beneficiary in all their activities, QIN-QIOs are leading the way to patient-centered care. They will equip both providers and patients for shared health care decision making through a national Patient and Family Engagement Campaign. • All improvers are welcome. Embracing boundarilessness as a prerequisite for system-wide change, QIN-QIOs are breaking down organizational, cultural and geographic barriers. Initiatives are open to providers at all levels of clinical performance that make a commitment to improvement. • Everyone teaches and learns. Through large-scale learning and action networks, QIN-QIOs are accelerating the pace of change and rapidly spreading best practices. Improvement initiatives include collaborative projects, online interaction and peer-to-peer education. • Greater value is fostered. QIN-QIOs will support CMS’ new value-based purchasing programs with technical assistance to providers that includes sharing best practices, assisting with data analysis and conducting improvement activities.")
12
Four Key Roles of the QIN-QIO
Champion local-level, results-oriented change Data-driven Active engagement of patients and other partners Proactive, intentional innovation and spread of best practices that stick Facilitate Learning and Action Networks (LANs) Create an all-teach, all-learn environment Place impetus for improvement at the bedside level (e.g., hand-washing) Teach and advise as technical experts Consultation and education The management of knowledge so learning is never lost Communicate effectively Optimal learning, patient activation and sustained behavior change
 Create an all-teach, all-learn environment. Place impetus for improvement at the bedside level (e.g., hand-washing) Teach and advise as technical experts. Consultation and education. The management of knowledge so learning is never lost. Communicate effectively. Optimal learning, patient activation and sustained behavior change.")
13
TMF QIN-QIO Website www.tmfqin.org
Provides targeted technical assistance and engages providers and stakeholders in improvement initiatives through numerous LANs. The networks serve as information hubs to monitor data, engage relevant organizations, facilitate learning and sharing of best practices, reduce disparities and elevate the voice of the patient. Data portal Post Acute Care Provider Reports

14
LANs Join any of the following TMFQIN.org networks and you can sign up to receive notifications to stay current on announcements, emerging content, events and discussions in the online forums. Cardiovascular Health and Million Hearts Nursing Home Quality Improvement Health for Life – Everyone with Diabetes Counts Patient and Family Quality Improvement Initiative Healthcare-Associated Infections Readmissions Meaningful Use Value-Based Improvement and Outcomes Medication Safety

15
All Are Welcome To join, create a free account at Visit the Networks tab for more information. As you complete registration, follow the prompts to choose the network(s) you would like to join. Choose the Readmission Network and set up a data portal account to view your agencies’ readmission reports if you are in a QIN-QIO-recruited coalition.
 you would like to join. Choose the Readmission Network and set up a data portal account to view your agencies’ readmission reports if you are in a QIN-QIO-recruited coalition.")
16
Care Coordination Readmission Network Medication Safety Network

17
TMF QIN-QIOs Provide technical assistance with:
Community coalition formation Root cause analyses Intervention selection and implementation plan Measurement Readmission and medication safety metrics Educational webinars Open Forum calls

18
Communities ACT Puerto Rico Texas Oklahoma Missouri East ACT LAZO
Delta ACT North Central ACT* Northwest ACT* Oklahoma Lawton Norman Hugo Durant McAlester* Clinton* Oklahoma City* Missouri West Central Kansas City* St. Louis* Puerto Rico LAZO CUPRI* Texas Denton El Paso Lubbock Rio Grande Valley, Upper Rio Grande Valley, Lower Lufkin/Nacogdoches Temple/Waco Sherman Houston* Dallas* Ft Worth* Laredo* * Recruiting in 2015

19
TMF QIN-QIO Goals for Care Coordination and Medication Safety Project
Improve care transitions for Medicare Fee-for-Service (FFS) beneficiaries by recruiting and working with community coalitions Improve medication safety and reduce adverse drug events (ADEs) for Medicare FFS beneficiaries in the region Special emphasis on these sub-groups of Medicare FFS beneficiaries: Dual eligible Multiple chronic conditions with multiple at-risk medications Behavioral health issues Alzheimer’s disease and dementia Lower socioeconomic status and other social determinates of health
 beneficiaries by recruiting and working with community coalitions. Improve medication safety and reduce adverse drug events (ADEs) for Medicare FFS beneficiaries in the region. Special emphasis on these sub-groups of Medicare FFS beneficiaries: Dual eligible. Multiple chronic conditions with multiple at-risk medications. Behavioral health issues. Alzheimer’s disease and dementia. Lower socioeconomic status and other social determinates of health.")
20
Statement of Problem: Readmissions
Hospitalizations consume 31 percent of $2 trillion in total health care expenditures in the United States 1 in 4 hospitalizations (25 percent) are avoidable 1 in 5 hospitalizations (20 percent) result in 30-day readmissions The chronically ill and frail elderly are the single largest population segment in terms of cost in the US. However, they interact with a health care delivery system that is oriented to acute, episodic interactions. It is the acute, episodic nature of care that is driving the hyper-fragmentation in care delivery, which affects no one more those who rely on continuous interaction with providers- those living with chronic illnesses. You’ll note throughout my comments, I will take a purposefully non-disease specific approach. Much of the work that has been done to understand high rates of rehosptialization and the effectiveness of various approaches to reduce the cycle of rehospitaliziations has been conducted in patients with congestive heart failure. Many of the principles apply broadly. To that end, Massachusetts’ focus on improving the care for patients with DM will undoubtedly go a long way to improving care for patients more generally. Hospitalizations account for almost a third of the $2 trillion in total health care expenditures in the United States Of course, in the majority of situations, hospitalizations for acute and serious illnesses are necessary and appropriate; However, research suggests that approximately a quarter of hospitalizations are avoidable and roughly 20% of all hospitalizations are re-hospitalizations, many of which are potentially avoidable. Source: Lynn J, Straube BM, Bell KM, Jencks SF, Kambic RT. Using population segmentation to provide better health care for all: The “Bridges to Health” model. Milbank Q. 2007;85:
 are avoidable. 1 in 5 hospitalizations (20 percent) result in 30-day readmissions. The chronically ill and frail elderly are the single largest population segment in terms of cost in the US. However, they interact with a health care delivery system that is oriented to acute, episodic interactions. It is the acute, episodic nature of care that is driving the hyper-fragmentation in care delivery, which affects no one more those who rely on continuous interaction with providers- those living with chronic illnesses. You’ll note throughout my comments, I will take a purposefully non-disease specific approach. Much of the work that has been done to understand high rates of rehosptialization and the effectiveness of various approaches to reduce the cycle of rehospitaliziations has been conducted in patients with congestive heart failure. Many of the principles apply broadly. To that end, Massachusetts’ focus on improving the care for patients with DM will undoubtedly go a long way to improving care for patients more generally. Hospitalizations account for almost a third of the $2 trillion in total health care expenditures in the United States. Of course, in the majority of situations, hospitalizations for acute and serious illnesses are necessary and appropriate; However, research suggests that approximately a quarter of hospitalizations are avoidable and roughly 20% of all hospitalizations are re-hospitalizations, many of which are potentially avoidable. Source: Lynn J, Straube BM, Bell KM, Jencks SF, Kambic RT. Using population segmentation to provide better health care for all: The Bridges to Health model. Milbank Q. 2007;85:")
21
Readmissions Network Goals
Reduce hospital readmission rates in the Medicare program by 20 percent Reduce hospital admission rates in the Medicare program by 20 percent Increase community tenure by increasing the number of days spent at home by Medicare FFS beneficiaries by 10 percent Reduce the prevalence of adverse drug events, emergency department visits and observation stays or readmissions occurring as a result of the care transitions process

22
What is an unplanned readmission?
A hospitalization within 30 days of discharge that was not foreseen at discharge Almost always urgent or emergencies Often signal failure of the transition from hospital to another source of care Evidence shows a great need to improve health care deliver in Texas. In the Dartmouth Atlas of Health Care1 –Texas ranked higher than the national average in multiple areas of service in These areas included all hospital discharges per 1,000 enrollees, total Part A and Part B reimbursement per enrollee and home health and hospice reimbursement per enrollee. The Commonweath Fund State Scorecare on Health system Performance, 2007, indicated that the 30 day readmissions in Texas represented 21% of all Medicare admissions in 2003, the third highest ranking among all states. In this measure – it is NOT good to rank high. Dartmouth Atlas of Health Care (The center for the Evaluative Clinical Sciences, Dartmouth Medical School) The most frequent reasons for rehospitalization bullet point source: DSHS data years and older. See texas (1) doc
 The most frequent reasons for rehospitalization bullet point source: DSHS data years and older. See texas (1) doc.")
23
Quick Facts In October 2013, Medicare reduced reimbursement by up to 2 percent for 2,225 hospitals due to excess readmissions. The payment penalty for readmissions increased to 3 percent in October 2014. MedPAC recommendation: adjust skilled nursing facility (SNF) payments to reduce hospital readmissions. This proposal reduces payments by up to 3 percent for SNFs with high rates of care-sensitive, preventable hospital readmissions, beginning in 2017. This will accrue $2.2 billion in savings over 10 years. MedPAC estimates 14 percent of SNF readmissions are preventable.
 payments to reduce hospital readmissions. This proposal reduces payments by up to 3 percent for SNFs with high rates of care-sensitive, preventable hospital readmissions, beginning in This will accrue $2.2 billion in savings over 10 years. MedPAC estimates 14 percent of SNF readmissions are preventable.")
24
Statement of Problem: Medication Safety
National estimates suggest that ADEs contribute an additional $3.5 billion dollars to U.S. health care costs.1 Given the U.S. population’s large and ever-increasing magnitude of medication exposure, the potential for harm from ADEs is a critical patient safety and public health challenge. ADEs are a direct result of drugs used during medical care that produce harmful events. These harmful events can include, but are not limited to, medication errors, adverse drug reactions, allergic reactions and overdoses.2,3 1Institute of Medicine Committee on Identifying and Preventing Medication Errors. Preventing Medication Errors: Quality Chasm Series. Washington, DC: The National Academies Press, 2006. 2Agency for Healthcare Research and Quality. Adverse Drug Event (ADE), in Patient Safety Network: Glossary. Available at: 3National Action Plan for Adverse Drug Event Prevention. U.S. Department of Health and Human Services, Office of Disease Prevention and Health Promotion, 2013.
, in Patient Safety Network: Glossary. Available at: 3National Action Plan for Adverse Drug Event Prevention. U.S. Department of Health and Human Services, Office of Disease Prevention and Health Promotion,")
25
Research Shows 80 percent of patients will forget what their providers say Almost 50 percent of what patients remember is recalled incorrectly Health literacy costs health care systems as much as $58 billion/year 33 percent of patients are unable to read basic health care material 42 percent of patients do not understand directions for taking medications on an empty stomach What changes can we make that will result in improvement? 1. Meet the patient, family caregiver(s), and inpatient caregiver(s) in the hospital and review transition home plan. 1A. Whenever possible, home health care nurse or liaison meets the patient, family caregiver(s), and at least one inpatient caregiver (e.g., nurse, hospitalist, social worker, discharge case manager) in the hospital and reviews the transition home plan. It is important to identify and collaborate with the appropriate responsible caregiver whenever possible. 1B. Reinforce to patient, family caregiver(s), and inpatient caregiver(s) that a follow-up appointment should be made before discharge to ensure timely follow-up after hospitalization with primary care or managing clinician. 2. Assess the patient, initiate plan of care and reinforce patient self-management. 2A. Evaluate the patient’s clinical status since leaving the hospital. 2B. Reconcile all medications, including all medications in the home. 2C. Assess, reinforce, and improve patient and family caregiver’s understanding and ability to manage medications and clinical procedures required for self-care with Teach Back 3. Engage, coordinate, and communicate with the full clinical team. A. Ensure early, consistent, real-time consultation with primary care provider or other managing clinicians. B. Use a patient-centered health record to communicate to all caregivers. C. Advocate as necessary to ensure referrals are completed and needed services are received to assist the patient in being maintained in the community. Source: HHQI Best Practice Intervention Package: underserved populations
, and inpatient caregiver(s) in the hospital and. review transition home plan. 1A. Whenever possible, home health care nurse or liaison meets the patient, family caregiver(s), and at least one inpatient caregiver (e.g., nurse, hospitalist, social worker, discharge case manager) in the hospital and reviews the transition home plan. It is important to identify and collaborate with the appropriate responsible caregiver whenever possible. 1B. Reinforce to patient, family caregiver(s), and inpatient caregiver(s) that a follow-up appointment should be made before discharge to ensure timely follow-up after hospitalization with primary care or managing clinician. 2. Assess the patient, initiate plan of care and reinforce patient self-management. 2A. Evaluate the patient’s clinical status since leaving the hospital. 2B. Reconcile all medications, including all medications in the home. 2C. Assess, reinforce, and improve patient and family caregiver’s understanding and ability to manage medications and clinical procedures required for self-care with Teach Back. 3. Engage, coordinate, and communicate with the full clinical team. A. Ensure early, consistent, real-time consultation with primary care provider or other managing clinicians. B. Use a patient-centered health record to communicate to all caregivers. C. Advocate as necessary to ensure referrals are completed and needed services are received to assist the patient in being maintained in the community. Source: HHQI Best Practice Intervention Package: underserved populations.")
26
Medication Safety Network
Reduce ADEs by 35 percent per 1,000 screened Medicare FFS beneficiaries by the year 2019 Monitor ADE rates by Medicare FFS beneficiaries on anticoagulants, diabetic agents or opioids by care setting, state, region and readmission rate

27
What causes ADEs in the elderly?
Research shows: Among older adults (65 years of age or older), percent reported taking five to nine medications, while percent reported taking 10 or more.1 ADEs can occur in any health care setting, including inpatient (e.g., acute care hospitals), outpatient and long-term care settings (e.g., nursing homes). The likelihood of ADEs occurring may also increase during transitions of care (transitions from one health care setting to another) when information may not be adequately transferred among health care providers,2 or patients may not completely understand how to manage their medications.3,4,5 1Slone Epidemiology Center. Patterns of medication use in the United States: A report from the Slone Survey. Boston, MA: 2006. 2Kripalani S, LeFevre F, Phillips CO, Williams MV, Basaviah P, Baker FW. Deficits in communication and information transfer between hospital-based and primary care physicians: implications for patient safety and continuity of care. JAMA. 2007;297(8): 3Schnipper JL, Kirwin JL, Cotugno MC, et al. Role of pharmacist counseling in preventing adverse drug events after hospitalization. Arch Intern Med. 2006;166(5): 4Calkins DR, Davis RB, Reiley P, et al. Patient-physician communication at hospital discharge and patients’ understanding of the post-discharge treatment plan. Arch Intern Med. 1997;157(9): 5Lindquist LA, Go L, Fleisher J, Jain N, Friesema E, Baker DW. Relationship of health literacy to intentional and unintentional non-adherence of hospital discharge medications. J Gen Intern Med. 2012;27(2):173-8.
, percent reported taking five to nine medications, while percent reported taking 10 or more.1. ADEs can occur in any health care setting, including inpatient (e.g., acute care hospitals), outpatient and long-term care settings (e.g., nursing homes). The likelihood of ADEs occurring may also increase during transitions of care (transitions from one health care setting to another) when information may not be adequately transferred among health care providers,2 or patients may not completely understand how to manage their medications.3,4,5. 1Slone Epidemiology Center. Patterns of medication use in the United States: A report from the Slone Survey. Boston, MA: Kripalani S, LeFevre F, Phillips CO, Williams MV, Basaviah P, Baker FW. Deficits in communication and information transfer between hospital-based and primary care physicians: implications for patient safety and continuity of care. JAMA. 2007;297(8): Schnipper JL, Kirwin JL, Cotugno MC, et al. Role of pharmacist counseling in preventing adverse drug events after hospitalization. Arch Intern Med. 2006;166(5): Calkins DR, Davis RB, Reiley P, et al. Patient-physician communication at hospital discharge and patients’ understanding of the post-discharge treatment plan. Arch Intern Med. 1997;157(9): Lindquist LA, Go L, Fleisher J, Jain N, Friesema E, Baker DW. Relationship of health literacy to intentional and unintentional non-adherence of hospital discharge medications. J Gen Intern Med. 2012;27(2):")
28
What causes ADEs in the elderly?
Research shows: In inpatient settings, ADEs are the single largest contributors to hospital-related complications.7 ADEs comprise an estimated one-third of all hospital adverse events,8 affect approximately 2 million hospital stays annually8,9 and prolong hospital length of stay by approximately 1.7 to 4.6 days.9,10,11 ADEs have also been identified as the most common causes of post- discharge complications (those occurring within three weeks of hospital discharge), accounting for two-thirds of all post discharge complications – more than half of which are likely preventable.12 7Classen DC, Resar R, Griffin F, et al. ‘Global trigger tool’ shows that adverse events in hospitals may be ten times greater than previously measured. Health Aff (Millwood). 2011;30(4): U.S. Department of Health and Human Services Office of Inspector General (OIG). Adverse Events in Hospitals: National Incidence Among Medicare Beneficiaries. Washington, DC., 2010 November. Report No.: OEI Lucado, J. (Social & Scientific Systems, Inc.), Paez, K. (Social & Scientific Systems, Inc.), and Elixhauser A. (AHRQ). Medication-Related Adverse Outcomes in U.S. Hospitals and Emergency Departments, HCUP Statistical Brief #109. April Agency for Healthcare Research and Quality, Rockville, MD. Available from: 10Bates DW, Spell N, Cullen DJ, et al. The costs of adverse drug events in hospitalized patients. Adverse Drug Events Prevention Study Group. JAMA. 1997;277(4): Classen DC, Pestotnik SL, Evans RS, Lloyd JF, Burke JP. Adverse drug events in hospitalized patients. Excess length of stay, extra costs, and attributable mortality. JAMA. 1997;277(4): Forster AJ, Murff HJ, Peterson JF, Gandhi TK, Bates DW. The incidence and severity of adverse events affecting patients after discharge from the hospital. Ann Intern Med. 2003;138(3):161-7.
, accounting for two-thirds of all post discharge complications – more than half of which are likely preventable.12. 7Classen DC, Resar R, Griffin F, et al. ‘Global trigger tool’ shows that adverse events in hospitals may be ten times greater than previously measured. Health Aff (Millwood). 2011;30(4): U.S. Department of Health and Human Services Office of Inspector General (OIG). Adverse Events in Hospitals: National Incidence Among Medicare Beneficiaries. Washington, DC., 2010 November. Report No.: OEI Lucado, J. (Social & Scientific Systems, Inc.), Paez, K. (Social & Scientific Systems, Inc.), and Elixhauser A. (AHRQ). Medication-Related Adverse Outcomes in U.S. Hospitals and Emergency Departments, HCUP Statistical Brief #109. April Agency for Healthcare Research and Quality, Rockville, MD. Available from: 10Bates DW, Spell N, Cullen DJ, et al. The costs of adverse drug events in hospitalized patients. Adverse Drug Events Prevention Study Group. JAMA. 1997;277(4): Classen DC, Pestotnik SL, Evans RS, Lloyd JF, Burke JP. Adverse drug events in hospitalized patients. Excess length of stay, extra costs, and attributable mortality. JAMA. 1997;277(4): Forster AJ, Murff HJ, Peterson JF, Gandhi TK, Bates DW. The incidence and severity of adverse events affecting patients after discharge from the hospital. Ann Intern Med. 2003;138(3):")
29
Hospital VBP FY 2017 Domains
3 HCAHPS questions

30
Improving Medicare Beneficiary
Influenza, Pneumococcal and Herpes Zoster Immunization Rates

31
Immunization Project Objectives
Improve: Tracking Assessment and documentation Reporting Special focus: Reducing immunization health care disparities

32
Discussion Question Influenza and pneumonia are ranked what number as the top 10 leading cause of death? 7th leading cause 5th leading cause 8th leading cause

33
Influenza and Pneumonia: Eighth-Leading Cause of Death
In October 2014, the National Center for Health Statistics (NCHS) reported that Vaccine preventable diseases (Influenza and Pneumonia) were the 8th leading cause of death in the United States in 2012. Source: CDC/NCHS, National Vital Statistics System, Mortality
 reported that Vaccine preventable diseases (Influenza and Pneumonia) were the 8th leading cause of death in the United States in Source: CDC/NCHS, National Vital Statistics System, Mortality.")
34
Deaths from Pneumonia Pneumonia is estimated to kill 40K people in the United States each year. Graphic is from clip art 53,282 Sources:

35
Deaths from Influenza Annually nearly 226K people are hospitalized annually due to influenza and it causes between 3K to 49K (depending on severity of flu season) deaths per year. Adults age 65 and older make up ninety percent of those deaths.
 deaths per year. Adults age 65 and older make up ninety percent of those deaths.")
36
Discussion Question What percentage of Medicare beneficiaries are vaccinated for influenza? 60 percent 54 percent 49 percent

37
Percentage of Medicare Beneficiaries Vaccinated
60% Despite the risk of these deadly diseases and availability of vaccinations to prevent, the immunization rate for adults remains historically low. Source: Centers for Disease Control and Prevention. (2014). Interactive mapping tool: Live-tracking flu vaccinations of Medicare beneficiaries; Williams, W. W., Lu, P-J., O’Halloran, A., Bridges, C. B., Pilishvili, T., Hales, C. M., & Markowitz, L. E. (2014). Noninfluenza vaccination coverage among adults . United States, Morbidity and Mortality Weekly Report, 63(5),
. Interactive mapping tool: Live-tracking flu vaccinations of Medicare beneficiaries; Williams, W. W., Lu, P-J., O’Halloran, A., Bridges, C. B., Pilishvili, T., Hales, C. M., & Markowitz, L. E. (2014). Noninfluenza vaccination coverage among adults . United States, Morbidity and Mortality Weekly Report, 63(5),")
38
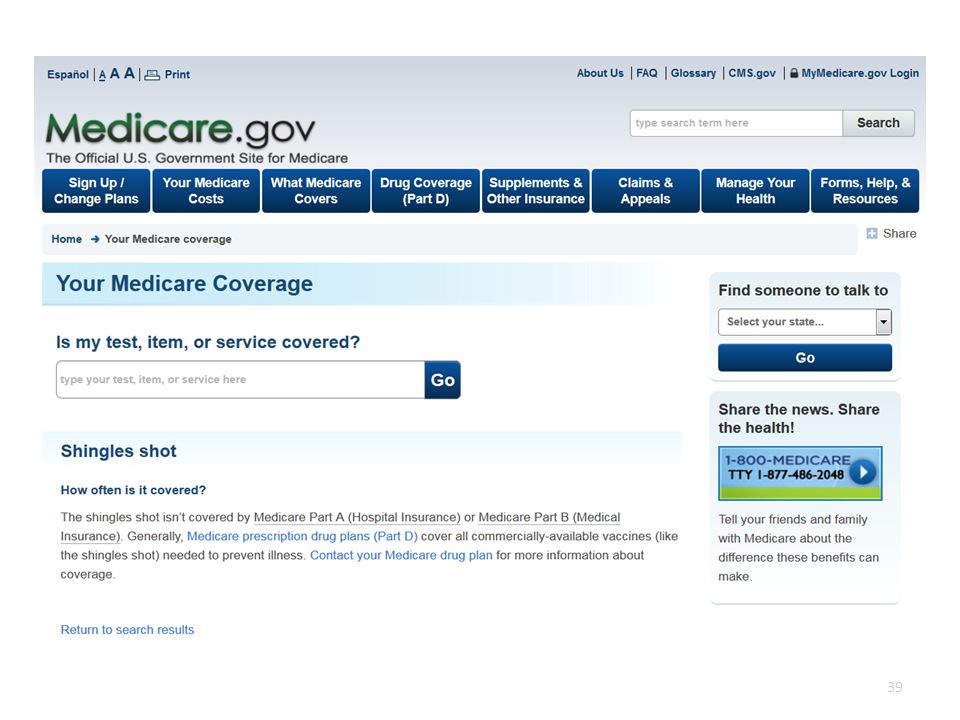
Herpes Zoster 1 million cases Varicella / Shingles
100% effective Herpes Zoster Vaccine 20% Vaccinated Estimated 1 million cases of Varicella/Shingles Year Herpes Zoster Vaccine is almost 100% effective at preventing severe cases of varicella Yet only 20% of those age 60 and older are vaccinated Source:

40
Influenza Vaccination
By looking at these influenza vaccination statistics: Majority of Medicare Beneficiaries receive their influenza vaccine in the physician office Resulting in only 54% are vaccinated Large percentage of Medicare beneficiaries without an annual physician visit who are at a higher risk for not receiving influenza immunization. By providing an alternative venue to receive vaccinations, we can increase the number vaccinated. Home Health Agencies can play a major role in accomplishing this. Source: Centers for Disease Control and Prevention. (2014). Interactive mapping tool: Live-tracking flu vaccinations of Medicare beneficiaries; Williams, W. W., Lu, P-J., O’Halloran, A., Bridges, C. B., Pilishvili, T., Hales, C. M., & Markowitz, L. E. (2014). Centers for Medicare and Medicaid Services. Overview Medicare Current Beneficiary Survey. 2011a Retrieved from Source: Centers for Disease Control and Prevention. (2014). Interactive mapping tool: Live-tracking flu vaccinations of Medicare beneficiaries; Williams, W. W., Lu, PJ, O’Halloran, A., Bridges, CB, Pilishvili, T., Hales, C. M., & Markowitz, L. E. (2014). Centers for Medicare and Medicaid Services. Overview Medicare Current Beneficiary Survey. 2011a Retrieved from
. Interactive mapping tool: Live-tracking flu vaccinations of Medicare beneficiaries; Williams, W. W., Lu, P-J., O’Halloran, A., Bridges, C. B., Pilishvili, T., Hales, C. M., & Markowitz, L. E. (2014). Centers for Medicare and Medicaid Services. Overview Medicare Current Beneficiary Survey. 2011a Retrieved from Source: Centers for Disease Control and Prevention. (2014). Interactive mapping tool: Live-tracking flu vaccinations of Medicare beneficiaries; Williams, W. W., Lu, PJ, O’Halloran, A., Bridges, CB, Pilishvili, T., Hales, C. M., & Markowitz, L. E. (2014). Centers for Medicare and Medicaid Services. Overview Medicare Current Beneficiary Survey. 2011a Retrieved from")
41
Discussion Question What racial/ethnic group has the lowest rates for influenza vaccinations? White Asian Black Hispanic

42
Medicare Immunization Rates by Type, Race and Ethnicity
Despite the fact that All racial and ethnic groups in the Medicare population receive about the same rate of health care. Caucasian patients are more likely to receive recommended immunizations than others. Source: Centers for Disease Control and Prevention. (2014). Interactive mapping tool: Live-tracking flu vaccinations of Medicare beneficiaries; Williams, W. W., Lu, P-J., O’Halloran, A., Bridges, C. B., Pilishvili, T., Hales, C. M., & Markowitz, L. E. (2014). Noninfluenza vaccination coverage among adults – United States, Morbidity and Mortality Weekly Report, 63(5),
. Interactive mapping tool: Live-tracking flu vaccinations of Medicare beneficiaries; Williams, W. W., Lu, P-J., O’Halloran, A., Bridges, C. B., Pilishvili, T., Hales, C. M., & Markowitz, L. E. (2014). Noninfluenza vaccination coverage among adults – United States, Morbidity and Mortality Weekly Report, 63(5),")
43
2019 Goals Align with the Healthy People 2020 Goals
National Absolute Immunization Rates 70 percent influenza 90 percent pneumonia 30 percent zoster 1 million previously unimmunized Medicare beneficiaries will receive pneumonia immunization 90 percent of adult immunizations will be reported to the registry

44
Recruitment: Health Care Providers
Physician Offices Hospitals Critical Access Hospitals HHAs Pharmacies Vaccination Centers I would like to specifically address the important role the home health agencies can play in increasing vaccination rates

45
Recruitment: Community
Community Organizations Physician Organizations State/Territory Agencies State/Territory Immunization Registries Beneficiary Representatives Disseminate immunization information/best practices via organizations list servs, newsletters, live meeting and conferences Collaborating with state/territory agencies to promote immunization interventions Offer supporting services to disseminate immunization information to patients and health care staff Engagement of state/territory registry programs to coordinate and co-sponsor outreach to reach health care providers. Hospitals and patients. Collaborate to scale and spread use of health care technology to promote best practices for vaccine recommendations. Collaborate with beneficiary representatives in promoting effective communication with patients and families

46
Technical Assistance Collaborate with HHAs and provide technical assistance on: Improving cardiac health through BPIPS Improving immunization rates for influenza, pneumococcal and herpes zoster diseases Reducing hospital readmissions Improving medication safety

47
Technical Assistance, cont.
Educating patients, staff, physicians Standing orders and protocols Electronic health record and paper chart: reminder/recall systems Flu-Fit Program (American Cancer Society) Improving accessibility Immunization registry reporting Policy and procedure updates Identify and develop educational tools and resources for Patient, Staff and Physician designed to dispel confusion, anxiety and fear regarding myths surrounding vaccination Promotion of explicit physician recommendation with Assist with development and/or utilization of vaccination standing orders and protocols Aid in development of immunization reminder/recall system or strengthen functionality of existing reminder/recall systems Advocate offering/providing take home fecal occult blood test at the time patient receives annual flu vaccine (American Cancer Society’s Flu Fit program) and provide support in developing workflow processes to incorporate Encourage utilization of vaccination centers to improve accessibility Assist providers in onboarding to the immunization registry in addition to providing education and support to providers in the reporting to the registry Assist providers in policy and procedure updates that promote increase vaccination rates and close communication gaps of immunization status
 Improving accessibility. Immunization registry reporting. Policy and procedure updates. Identify and develop educational tools and resources for Patient, Staff and Physician designed to dispel confusion, anxiety and fear regarding myths surrounding vaccination. Promotion of explicit physician recommendation with. Assist with development and/or utilization of vaccination standing orders and protocols. Aid in development of immunization reminder/recall system or strengthen functionality of existing reminder/recall systems. Advocate offering/providing take home fecal occult blood test at the time patient receives annual flu vaccine (American Cancer Society’s Flu Fit program) and provide support in developing workflow processes to incorporate. Encourage utilization of vaccination centers to improve accessibility. Assist providers in onboarding to the immunization registry in addition to providing education and support to providers in the reporting to the registry. Assist providers in policy and procedure updates that promote increase vaccination rates and close communication gaps of immunization status.")
48
Technical Assistance, cont.
Providing evidence-based practices Sharing interventions and techniques to increase community demand Promoting the “Immunization Passport” to improve documentation and communication Identifying or developing educational tools and resources Provide evidence based practices to increase vaccinations of targeted population Share interventions and techniques to improve increase in community demand such as offering wallet-sized immunization records for clients. Promote the “immunization passport” –A communication referral tool developed for patients who receive a vaccination via pharmacy or vaccination center to provide reporting back to the eligible provider. Identify or Develop Educational Tools and Resources

49
Proposed Annual Impact
61,000 Medicare beneficiaries: Pneumonia vaccination: 5,850 Influenza vaccination: 52,950 Herpes zoster vaccination: 2,200

50
Coordinated Interventions
Immunization registries Flu-Fit Program Shared tools and best practices Coordinated Interventions Enhanced vaccination access Educational programs Affinity group sessions Community vaccination clinics

52
Data Individualized reports: Securely delivered online Updated monthly
Acute Care Hospitalization Oral Medication Management Immunizations Securely delivered online Updated monthly OASIS-based (raw and risk-adjusted) Historical trends and target setting
 Historical trends and target setting.")
53
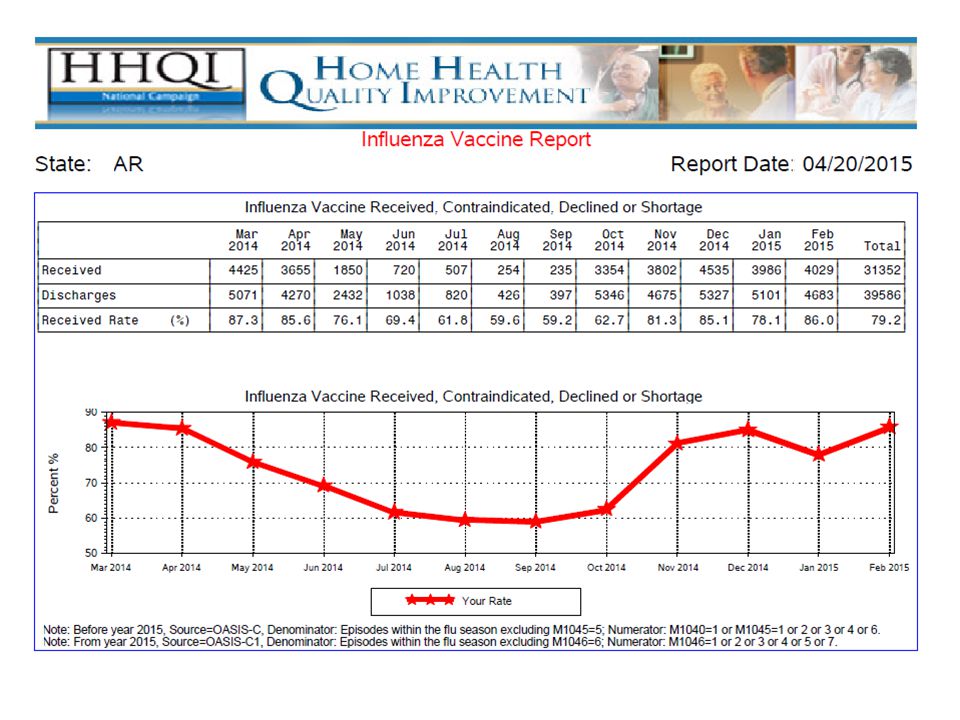
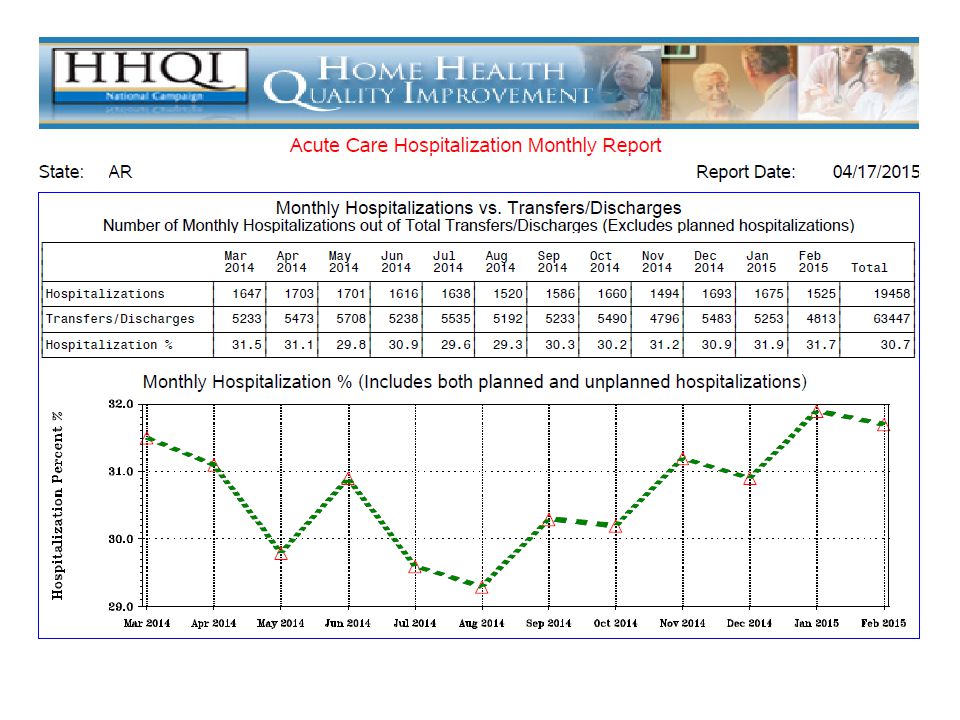
Arkansas Data

56
Cardiovascular Health Network TMF QIN-QIO

57
Cardiovascular Health Network HHAs
Access to resources and literature Expert Consulting Services Access to live online forums for networking HHQI tools and interventions Assistance focused on the ABCS Benefits

58
Cardiovascular Health: Let’s Get to the Heart of the Data
The Facts Put it into Perspective Heart disease and stroke are the FIRST- and FOURTH-leading causes of death respectively for all races in the United States Annually, heart disease and stroke cost more than $312.6 billion in health care expenditures and lost productivity 1.5 million people The population of San Antonio Number of HEART ATTACKS and STROKES EACH YEAR in the US 800,000 people Weekly attendance at Disney World® Number of Americans who DIE from HEART DISEASE EVERY YEAR 2,200 people Number of passengers in four loaded jets People who die EVERY DAY from cardiovascular disease

59
Cardiovascular Health Network
HHAs We help HHAs sign up for the Cardiovascular Data Registry, developed through the HHQI National Campaign. This registry allows HHAs to track progress related to the ABCS (Aspirin therapy, Blood pressure management, Cholesterol control and Smoking/tobacco cessation). Utilize health literacy tools to provide education Utilize BPIPs to provide technical assistance Participate in cardiac LAN Network activities and share success stories
. Utilize health literacy tools to provide education. Utilize BPIPs to provide technical assistance. Participate in cardiac LAN Network activities and share success stories.")
60
Cardiovascular Health Network
Technical assistance: Focus on ABCS Improving health care delivery Regional open forums and LANs CMS incentive payment programs Patient/provider collaboration Tools and resources on

61
Cardiovascular Health Network
Goals: Facilitate improvements and best practices Assist Providers with reporting cardiovascular PQRS reporting Assist HHAs to report cardiovascular measures through the Home Health Cardiovascular Data Registry (HHCDR) Improving performance on the following clinical quality measures: Aspirin therapy; Blood pressure control Cholesterol control Smoking/Tobacco Use
 Improving performance on the following clinical quality measures: Aspirin therapy; Blood pressure control. Cholesterol control. Smoking/Tobacco Use.")
63
HHCDR Available to CMS-certified HHAs
Helps target potential disparities in care Provides evidence of impact made by improvement efforts Most data auto-populates from OASIS-C transmissions Requires approximately two to three hours per month Option to select which measure/s to abstract: ABCS Twelve patients per measure or total discharges (whichever is smaller)
")
64
Do You Know Your ABCS? Aligns with national Million Hearts® initiative
Focuses on the ABCS of preventive cardiovascular care The Million Hearts® word and logo marks are owned by the U.S. Department of Health and Human Services (HHS). Use of these marks does not imply endorsement by HHS. Use of the Marks also does not necessarily imply that the materials have been reviewed or approved by HHS.
. Use of these marks does not imply endorsement by HHS. Use of the Marks also does not necessarily imply that the materials have been reviewed or approved by HHS.")
65
HHCDR Was the patient taking ASA? Final blood pressure?
Was HTN addressed during this episode? Did the patient have a lipid panel in the record? Was the patient assessed for tobacco use? Was it addressed? Was the patient dually eligible?

66
Cardio Milestones Sign up for the HHCDR
Download all cardiovascular BPIPs Complete HHCDR security authentication Close at least one month of required patient data in the HHCDR Download at least one HHCDR report Abstract and close a total of six months of required patient data for HHCDR Validate data Achieve noted improvement in one or more cardiovascular outcomes

67
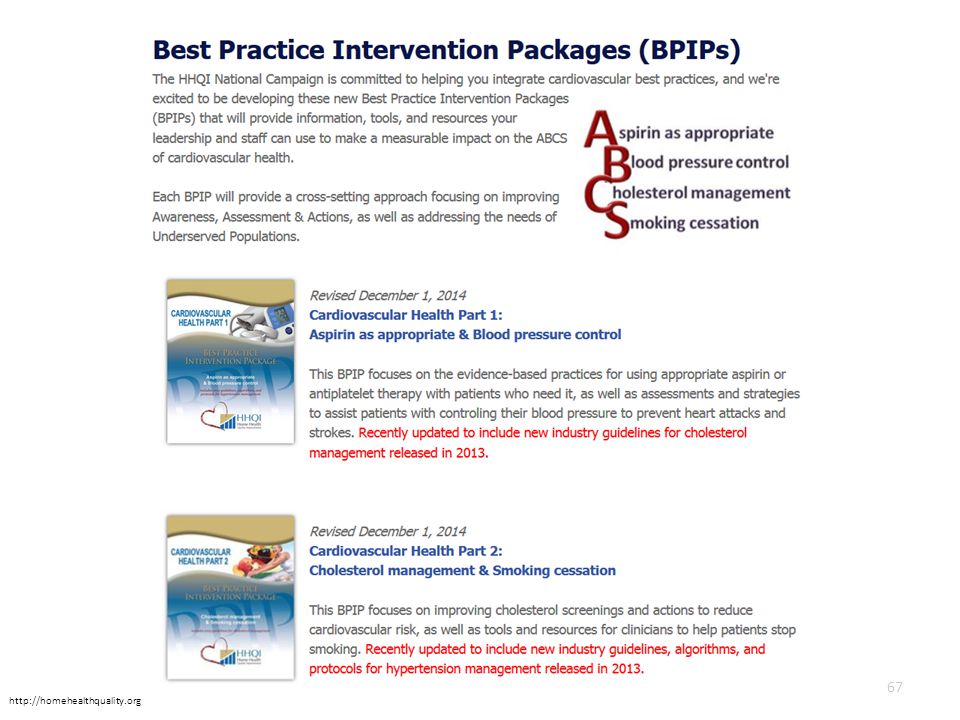
Presenter needs to note that this is a screen shot of the BPIPS page where they can access the Cardiovascular Health part 1 &2. Also let audience know that the website listed is note a direct link to BPIPS they must click on the actual BPIPS tab.
68
BPIPs Two primary cardiovascular health BPIPs
Aspirin as appropriate and blood pressure control Cholesterol management and smoking cessation Fundamental BPIPS focus on: Blood pressure control Smoking cessation Include patient tools and resources Free nursing continuing education credits available

69
Sign Up Today

70
THE DNA

71
Questions? Faye Nipps, MBA, BSN, CPHQ TMF Quality Innovation Network Phone: This material was prepared by TMF Health Quality Institute, the Medicare Quality Innovation Network Quality Improvement Organization, under contract with the Centers for Medicare & Medicaid Services (CMS), an agency of the U.S. Department of Health and Human Services. The contents do not necessarily reflect CMS policy. 11SOW-QINQIO-C
, an agency of the U.S. Department of Health and Human Services. The contents do not necessarily reflect CMS policy. 11SOW-QINQIO-C")
Similar presentations


, CPHQ Quality Improvement Consultant,>")

![[Hospital Name | Presenter name and title | Date of presentation]](/19/5722524/big_thumb.jpg "[Hospital Name | Presenter name and title | Date of presentation]>")


