Download presentation
Presentation is loading. Please wait.

1
Scott D. Duncan, MD, MHA, FAAP

2
Science of Safety We cannot improve quality and safety of healthcare until we view the everyday delivery of healthcare as a science

3
Flow Charts “If you can’t describe what your doing as a process, you don’t know what you’re doing” W. Edwards Deming A written description of a process requires a common definition of terms, fluency with the concepts, and the absence of an agenda by the author and reader.

4
"Draw a flowchart for whatever you are doing. Until you do, you do not fully understand what you are doing. You just have a job.“ "The first step in any organization is to draw a flow diagram to show how each component depends on others. Then everyone may understand what their job is. If people do not see the process, they cannot improve it."

5
SIPOC+CM SIPOC is a data collection form that is used before we start to construct a flow chart since it helps us to gather relevant information about the process. Assists in gathering information about Suppliers, Inputs, Process, Outputs, and Customer of the process. SIPOC is high level view of the “As Is” state of a process under investigation.

6
SIPOC+CM When to use it: When first starting to investigate a process and a team needs to understand the basics that make up the process. When a team needs a way to get the collective knowledge of the team members about a process recorded in an easy to view format. When we need to make a concise communication to others about a process and the parameters that it encompasses.

7
Process/Activities: Begins With: Ends With: Inputs: Suppliers: Outputs: Customers: Constraints: SIPOC+CM Collection Form Measures

8
SIPOC+CM

9
Flow Charting Flow charting is the first step we take in understanding a process Organized combination of shapes, lines, and text Flow charts provide a visual illustration, a picture of the steps the process undergoes to complete it's assigned task From this graphic picture we can see a process and the elements comprising it Shows how interactions occur Makes the invisible visible

10
Problem Identification Generating Solutions Test Disseminate 7 Flow Chart Benefits

11
Puts a spotlight on waste Streamlines work processes Defines and standardizes the steps and sequence Promotes deep understanding Builds consensus Key tool for continuous quality improvement 11 Flow Chart Benefits

12
Flow Charting Construction Clearly define the process boundaries to be studied Define the first and last steps – start and end points Get the right people in the room Decide on the level of detail –Complete the big picture first – macro view –Fill in the details – micro view

13
Flow Charting Construction Gather information of how the process flows: –Experience –Observation –Conversation –Interviews –Research Clearly define each step in the process – Be accurate and honest

14
Constructing a Flow Chart Asking questions is the key to flow charting a process. For this process: –Who is the customer(s)? –Who is the supplier(s) ? –What is the first thing that happens? –What is the next thing that happens? –Where does the input(s) to the process come from? –How does the input(s) get to the process? –Where does the output(s) of this operation go? –Is their anything else that must be done at this point? –What is the baseline measurement of this process?
. –Who is the supplier(s) . –What is the first thing that happens. –What is the next thing that happens. –Where does the input(s) to the process come from. –How does the input(s) get to the process. –Where does the output(s) of this operation go. –Is their anything else that must be done at this point. –What is the baseline measurement of this process .")
15
Flow Charting Steps Use the simplest symbols possible – Post-Its Make sure every loop has an escape There is usually only one output arrow out of a process box. Otherwise, it may require a decision diamond. Trial process flow – walk through people involved in the process to get their comments Make changes if necessary Identify time lags and non-value-adding steps.

16
Adding Time Lines As Is Flow Chart Could Be Flow ChartShould Be Flow Chart Time

17
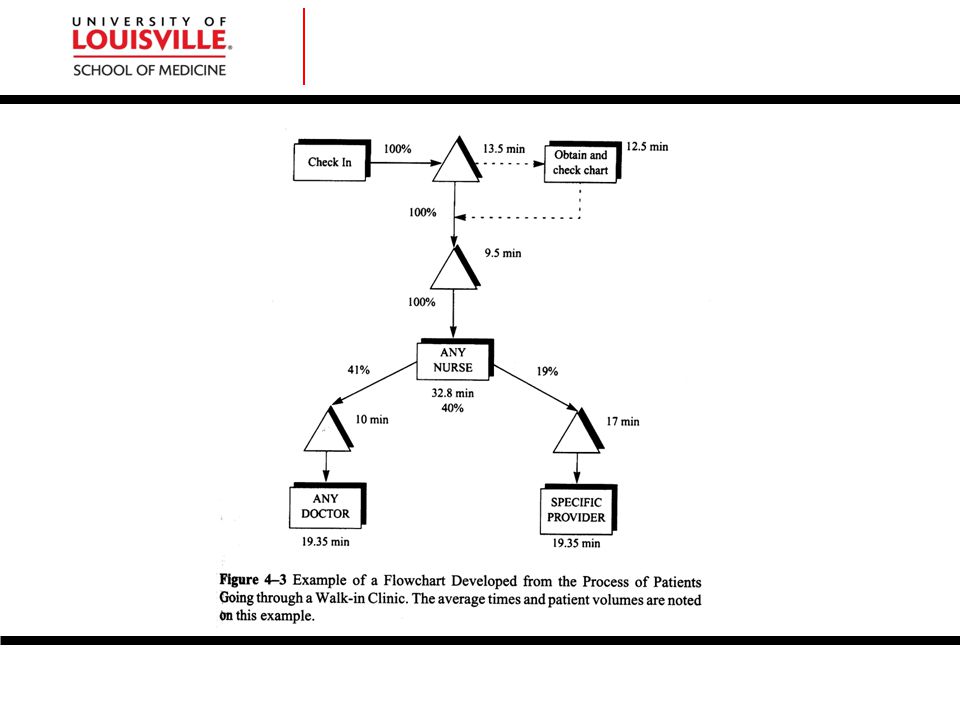
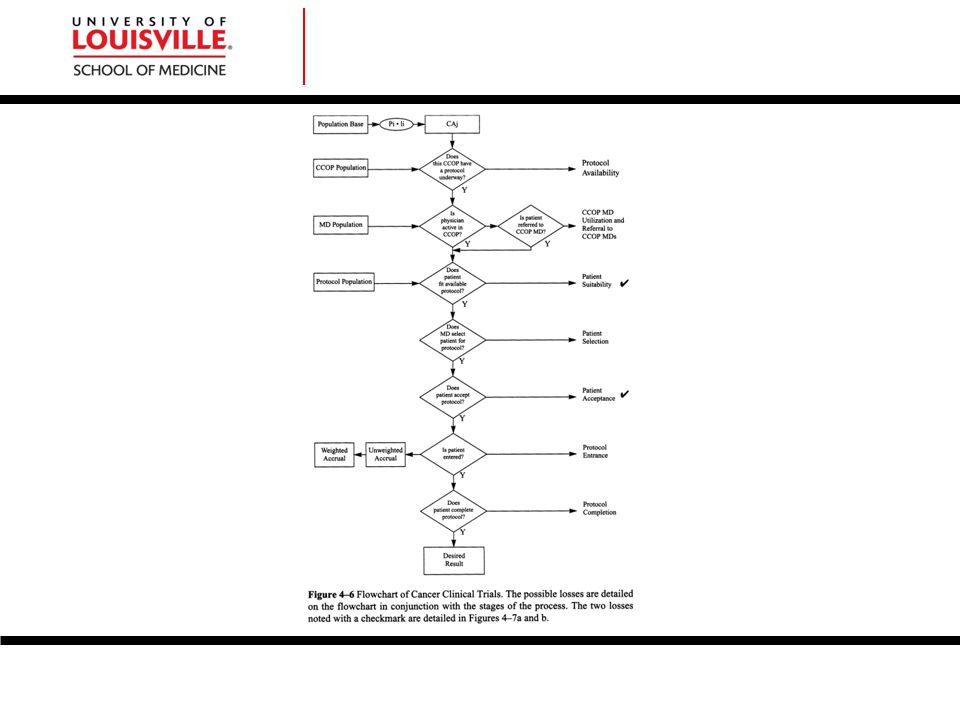
Flow Charts

18
Flow Chart Symbols Activity: Operation/Inspection Decision Start/End Bookends Document Wait/Delay Storage Data Base Transport Input Output A Connector Forms Comment Collector Input/ Output Data Manual Operation Preparation Manual Input Display Unfamiliar/ Research

19
Written physician order scanned to pharmacy from 3L for a scheduled oral medication. Is the time of order entry prior to 1240? Is a dose due prior to 1800 on the day AFTER initial order entry? AB CD Yes No Process Flow Chart

20
A Order entry by the pharmacistLabel will print Pharmacy technicians receives label(s) for a patient specific oral medication. Technician draws up the appropriate patient specific dose into an oral syringe and labels the oral syringe with the patient’s label. Syringes are left with the bulk medication bottle for pharmacist verification. Pharmacist verifies that medication dispensed matches the medication ordered on the label and initials the medication label. Medication is tubed to 3L. Process Flow Chart

23
Process Mapping: Initial Workflow 23

24
Analyzing A Flow Chart Assessing the current process map with the goal of improving patient flow by looking for steps that: i)Definitely add value ii)Add no value, but are unavoidable iii)Add no value, but are avoidable Once completing a process map, return to the site and discuss it with employees to ensure its accuracy. Together, consider how the map could be used to make improvements to the system.

25
Analyzing A Flow Chart Examine each: –Activity symbol – value/cost? –Decision point – necessary/redundant? –Choke Points – bottlenecks? –Rework loop – time/cost? –Handoff – is it seamless? –Document or data point – useful? –Wait or delay symbol – why?/reduce/eliminate –Transport Symbol – time/cost/location? –Data Input Symbol – right format/timely? –Document/Form Symbol – needed/cost/value?

26
Process Mapping: Areas for Improvement 26

Similar presentations


 Robert Martin, PsyD Performance Excellence UCLA.>")


