Download presentation
Presentation is loading. Please wait.

1
Gene Expression Clustering

2
The Main Goal Gain insight into the gene’s function. Using: Sequence Transcription levels.

3
Microarray Technology

4
Microarray - standard laboratory technique. Information about gene expression. Tens of thousands of data points. Analyze by computational methods.

5
Gene Clustering To cluster genes means to group together genes with similarity in their expression patterns.

6
Why do we need to cluster genes? Unknown gene function. Common regulatory elements. Pathways and biological processes. Defining new disease subclasses. Predict categorization of new samples. Data reduction and visualization.

7
Gene Clustering Clustering methods can be divided into two major groups: Supervised clustering –classify according to previous knowledge (group prediction). Unsupervised clustering – no previous knowledge is used (pattern discovery).
..")
8
Unsupervised clustering In many cases we have little a-priory knowledge about genes. There are many different methods of unsupervised clustering. We will present Hierarchical clustering.

9
The Method

10
Hierarchical clustering All data instances start in their own clusters. Two most closely related clusters are merged. Repeated until a single cluster remains. Arranges the data into a tree structure Can be broken into the desired number of clusters.

11
Hierarchical clustering The raw data Chip20 … Chip2Chip1Gene x 1,20 … x 1,2 x 1,1 1 x 2,20 … x 2,2 x 2,1 2 x 3,20 … x 3,2 x 3,1 3.............................. x 12000,20 … x 12000,2 x 12000,1 12,000

12
Hierarchical clustering Normalized data

13
Hierarchical clustering Calculate the Distance Matrix Euclidean distance formula: Correlation coefficient ( ): A B C
: A B C")
14
Hierarchical clustering Calculate the Distance Matrix Average linkage - midpoint. Single linkage – smallest distance. Complete linkage - largest distance.

15
Hierarchical clustering Calculate the Distance Matrix Chip2Chip1Gene 1.0-2.0A -0.5-1.5B 0.251.0C CBA 3.091.580.00A 2.610.001.58B 0.002.613.09C

16
Hierarchical clustering Average Linkage Algorithm DCBA 4.743.091.580.00A 5.002.610.001.58B 2.700.002.613.09C 0.002.705.004.74D CBDA

17
Hierarchical clustering Average Linkage Algorithm DCAB 4.812.850.00AB 2.700.002.85C 0.002.704.81D CDBA

18
Hierarchical clustering Average Linkage Algorithm CDAB 3.830.00AB 0.003.83CD DCBA

19
Hierarchical clustering dendogram DCBA

20
Hierarchical clustering heat maps red corresponding to high expression levels green corresponding to low expression levels black corresopnding to intermediate expression levels.

21
Hierarchical clustering Experiment Control Random 1 – randomized by rows. Random 2 – randomized by columns. Random 3 – randomized by both rows and columns.

22
Examples

23
Example I We present here an experiment of Spellman et al that was published in Mol. Biol. Cell 9, 3273-3297 (1998). Goals of the experiment: Identify all cell cycle regulated genes in Yeast. Show clustering at work.
. Goals of the experiment: Identify all cell cycle regulated genes in Yeast. Show clustering at work..")
24
Example I Cell Cycle

25
Example I Methods DNA microarrays contained all the yeast genome. Measure levels of mRNA as a function of time.

26
Example I Methods Synchronization: factor. Elutriation – size based. Cdc15 – heat mutation. Factors: cln3p, clb2p deletation. induced with these factors. Data from a previously published study (Cho et al. 1998) Control sample: asynchronous cultures.
 Control sample: asynchronous cultures..")
27
Example I Methods Measurements analyzed based on: Fourier algorithm - assesses periodicity. Correlation measurement - compared with previously identified cell cycle regulated genes.

28
Example I Methods Calculate a score for each gene - "CDC score". Threshold CDC value. 91% of the genes previously shown to be cell cycle regulated are included. About 800 genes were identified as cell cycle regulated.

29
Example I Phasing By time of peak expression:

30
By similarity of expression across the measurements: Example I Clustering

31
Hierarchical clustering. Identified 9 clusters. Genes in each cluster share: Common upstream elements Regulation by similar transcription factors. Common function (only for known genes). Cln3p and clb2p has the same effect on the genes in a cluster.
. Cln3p and clb2p has the same effect on the genes in a cluster..")
32
Example I Clustering Histone cluster: A very tight cluster. Repeated SCB motif in promoter. Induced by Cln3. Unaffected by Clb2. Peak during S phase.

33
Example I Results Genes with known functionality: Cell cycle regulated functions The MET cluster. Genes involved in secretion and lipid synthesis. Known genes discovered as cell cycle regulated.

34
Example I Results New binding sites for regulators. The CLB cluster is highly regulated. Aligning the genes in the cluster. New consensus for MCM1+SFF binding site.

35
Example I Results MCM1:T-T-A-C-C-N-A-A-T-T-N-G-G-T-A-A SFF: G-T-M-A-A-C-A-A New motif: T-T-W-C-C-Y-A-A-W-N-N-G-G-W-A-A-W-W-N-R- T-A-A-A-Y-A-A

36
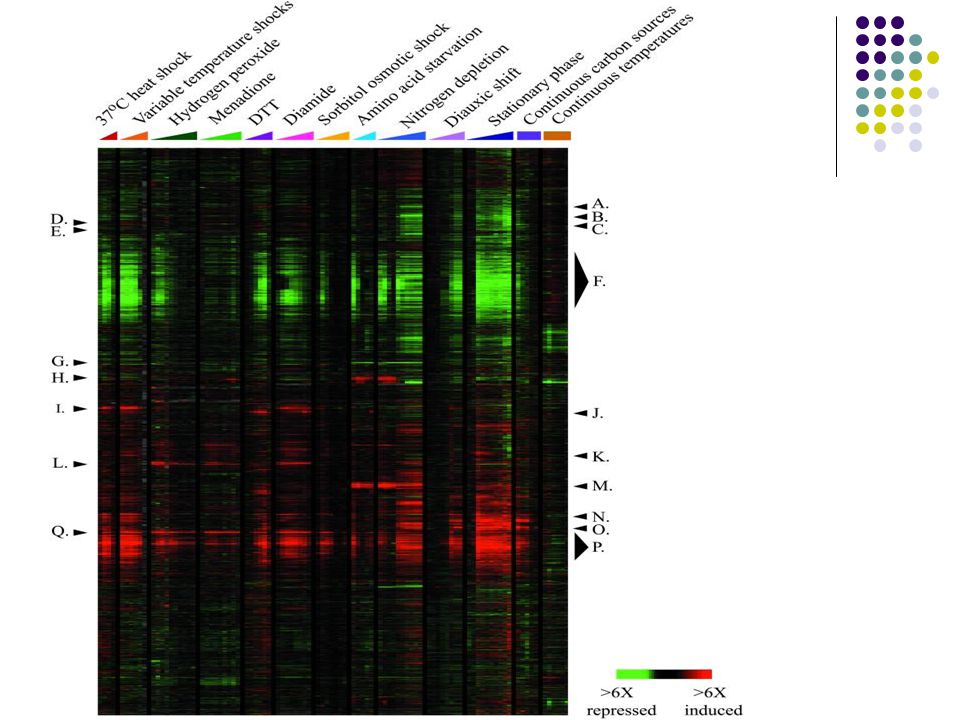
Example II Gasch AP. et al. Genomic expression programs in the response of yeast cells to environmental changes. Mol Biol Cell. 2000; 11(12): 4241-57 Main Goal: Characterize the yeast response to environmental changes, and particularly to stress conditions.
: Main Goal: Characterize the yeast response to environmental changes, and particularly to stress conditions..")
37
Example II Methods Yeast cells responding to diverse environmental stresses. Microarray contained all yeast genes. Results were organized by hierarchical clustering.

39
Example II General features of the stress response Massive and rapid changes. Transient changes. Correlated with the magnitude of the shift: Duration Amplitude Steady-state difference.

41
Example II General features of the stress response Some genes responded in a stereotypical manner. Some genes had unique response. No two expression programs were identical.

42
Example II The Environmental Stress Response (ESR) About 900 genes responded in a stereotypical manner. ESR – Environmental Stress Response. Two large clusters of genes: repressed genes (~ 600) induced genes (~ 300) Showed reciprocal response.
 induced genes (~ 300) Showed reciprocal response..")
44
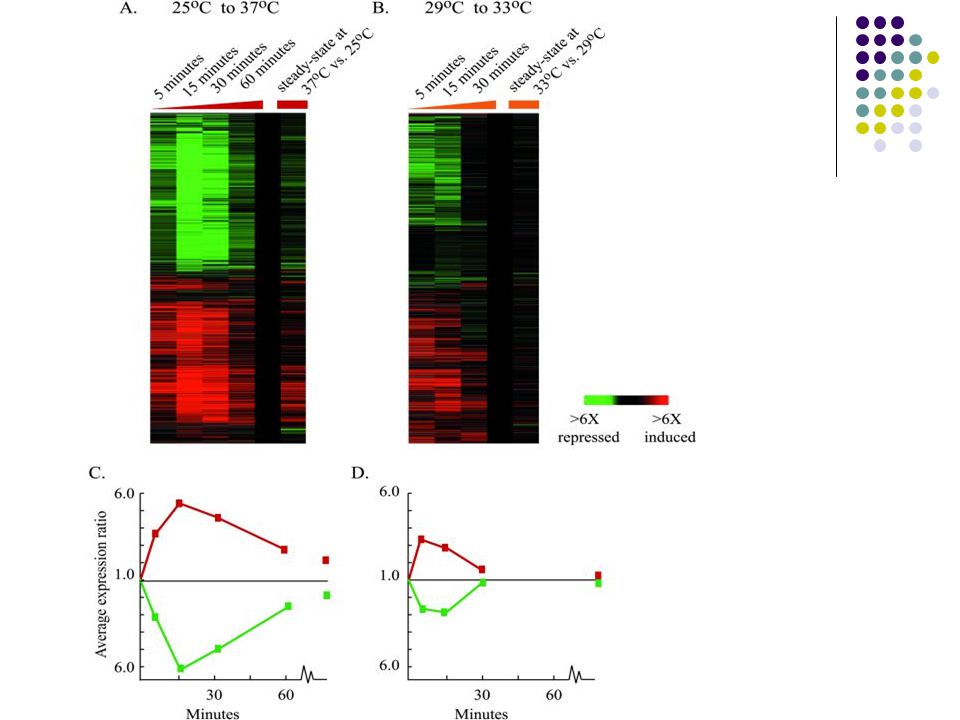
Example II The Environmental Stress Response (ESR) Response to different shift in: Temperature Osmolarity.
 Response to different shift in: Temperature Osmolarity.")
45
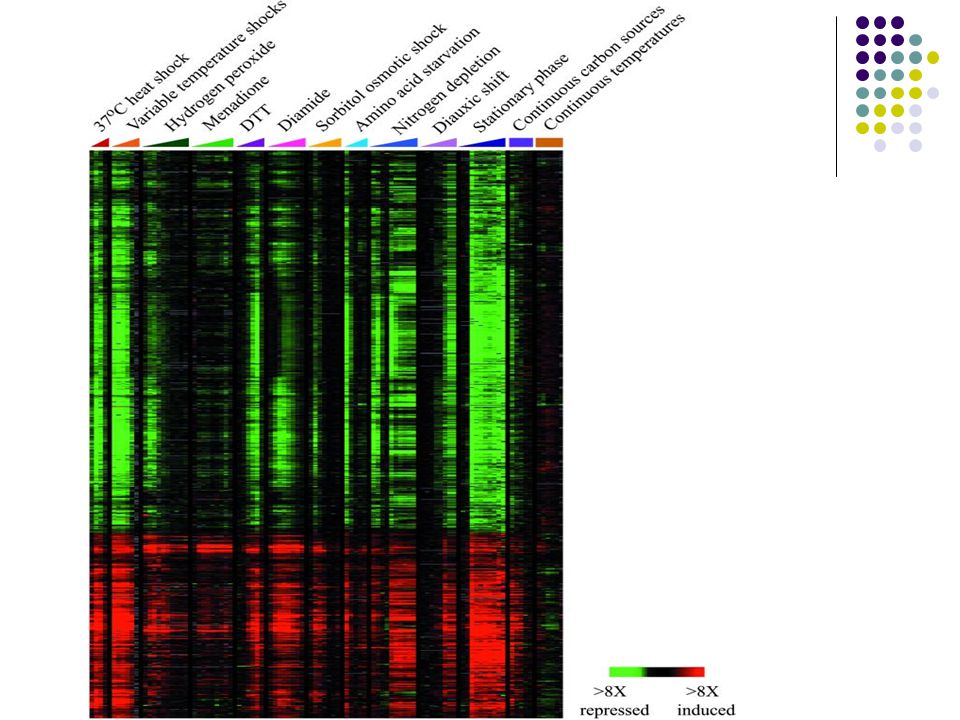
osmolarityHeat shock Example II The Environmental Stress Response (ESR) The ESR is not a response to all environmental changes.
 The ESR is not a response to all environmental changes.")
46
Example II The Environmental Stress Response (ESR) Shift between two equally stressful environments: 29 o C and hyper-osmotic medium. 33 o C with normal osmolarity. sum of the responses. Independent response to each of the changes.

47
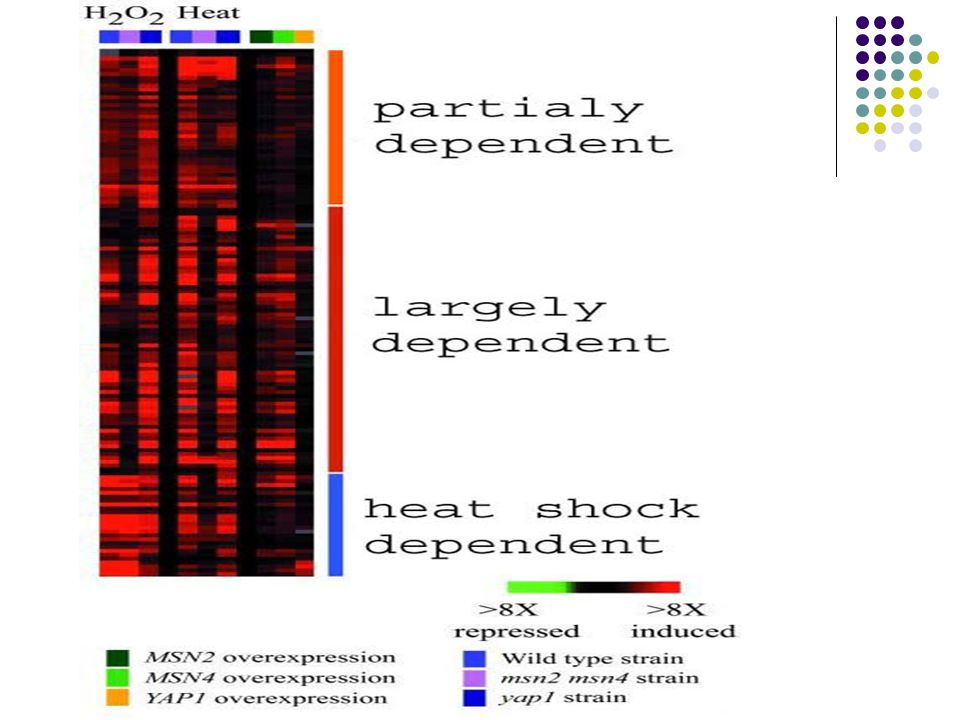
Example II The Environmental Stress Response (ESR) Previously known: STRE promoter. Recognized by Msn2p and Msn4p. One all-purpose regulatory system ?

49
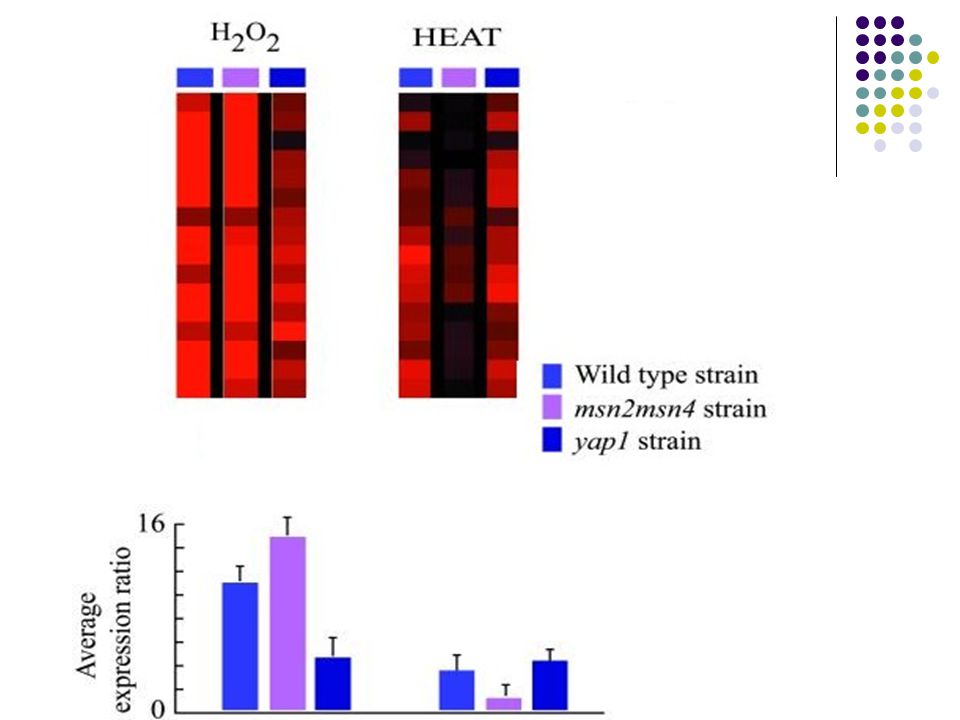
Example II The Environmental Stress Response (ESR) TRX2 cluster genes: Dependent on Msn2/Msn4p in response to heat shock. Unaffected from Msn2/Msn4p in response to H 2 O 2. Contained binding site for Yap1p. Yap1p deletion strain.

51
Example II The Environmental Stress Response (ESR) Revealed that TRX2 cluster genes: Induced by Yap1p in response to H 2 O 2 treatment Unaffected by the deletion in response to heat shock. ESR regulated by different transcription factors. Regulation is condition-specific and gene- specific.

52
Example II Specific Response Response to stress: Stereotypic response (ESR). Specific response. Character cell’s response to specific stress. Example: Heat-shock response ESR initiated fast (minutes). Induction of chaperones. Alternative carbon source utilization.
. Induction of chaperones. Alternative carbon source utilization..")
53
Conclusions

54
Hierarchical clustering Conclusion Difficulty: Post transcriptional regulation. Solution: Use the method in cases the main regulation is in transcription level (example – Yeast cell cycle).
..")
55
Hierarchical clustering Conclusion Difficulty: No statistical foundation for the decision of where to cut the dendogram. Solution: Split a tree in such a way which will produce clusters of genes with homogeneity. Such a split is considered to be evidence that the grouping was correct.

56
Hierarchical clustering Conclusion Difficulty: The algorithm will produce clusters in any case. Solution: Introduces a small amount of random to the data, re-cluster the data and compare the results to the original clustering. If the results are the same, then the clustering is not representing true biological meaning.

57
Hierarchical clustering Conclusion Discover gene’s function. Status of cellular processes. Information on regulatory mechanisms. General cell behaviors. Assign genes to pathways. Unknown biological pathways.

58
References Eisen M. B., Spellman P. T., Brown R. O., Botstein D. Cluster analysis and display of genome-wide expression pattern. Proc. Natl. Acad. Sci. USA, 95: 14863-14868, 1998 Spellman, P.T. et al. Comprehensive identification of cell cycle- regulated genes of the yeast Saccharomyces cerevisiae by microarray hybridization. Mol. Biol. Cell 9, 3273-3297 (1998). Gasch AP, Spellman PT, Kao CM, Carmel-Harel O, Eisen MB, Storz G, Botstein D, Brown PO. Genomic expression programs in the response of yeast cells to environmental changes. Mol Biol Cell. 2000; 11(12): 4241-57. Shannon William, Culverhouse Robert, Duncan Jill. Analyzing microarray data using cluster analysis. Pharmacogenomics, 2003, 4(1):41-51. Review. Kaminski Naftali, Friedman Nir. Practical Approaches to Analyzing Results of Microarray Experiments. American Journal of Respiratory and Cell Molecular Biology, 2002, 27:125-132. Reviwe.
. Gasch AP, Spellman PT, Kao CM, Carmel-Harel O, Eisen MB, Storz G, Botstein D, Brown PO. Genomic expression programs in the response of yeast cells to environmental changes. Mol Biol Cell. 2000; 11(12): Shannon William, Culverhouse Robert, Duncan Jill. Analyzing microarray data using cluster analysis. Pharmacogenomics, 2003, 4(1): Review. Kaminski Naftali, Friedman Nir. Practical Approaches to Analyzing Results of Microarray Experiments. American Journal of Respiratory and Cell Molecular Biology, 2002, 27: Reviwe..")
Similar presentations


 Ben Taskar (Stanford) Audrey Gasch (Berkeley) Nir Friedman (Hebrew University) Daphne.>")


