Download presentation
Presentation is loading. Please wait.

1
Economic History (Master APE & PPD, Paris School of Economics) Thomas Piketty Academic year Lecture 1: Income, capital and growth since 1800: how did rich countries become rich ? (Tuesday September 8th 2015) (check on line for updated versions)
 (check on line for updated versions)")
2
Introduction: three U-shaped curves
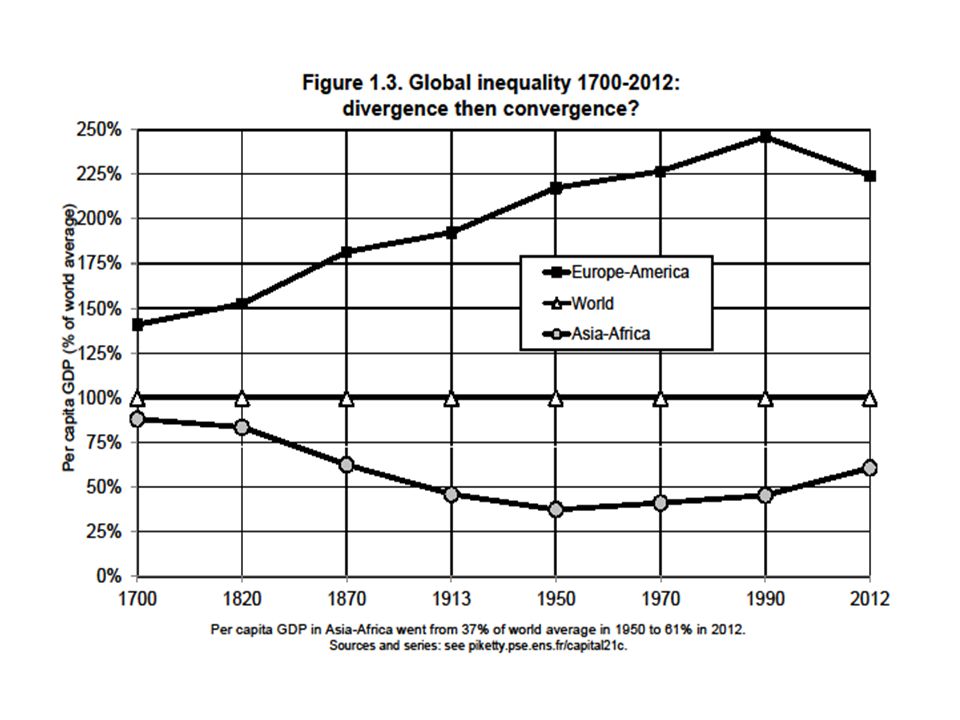
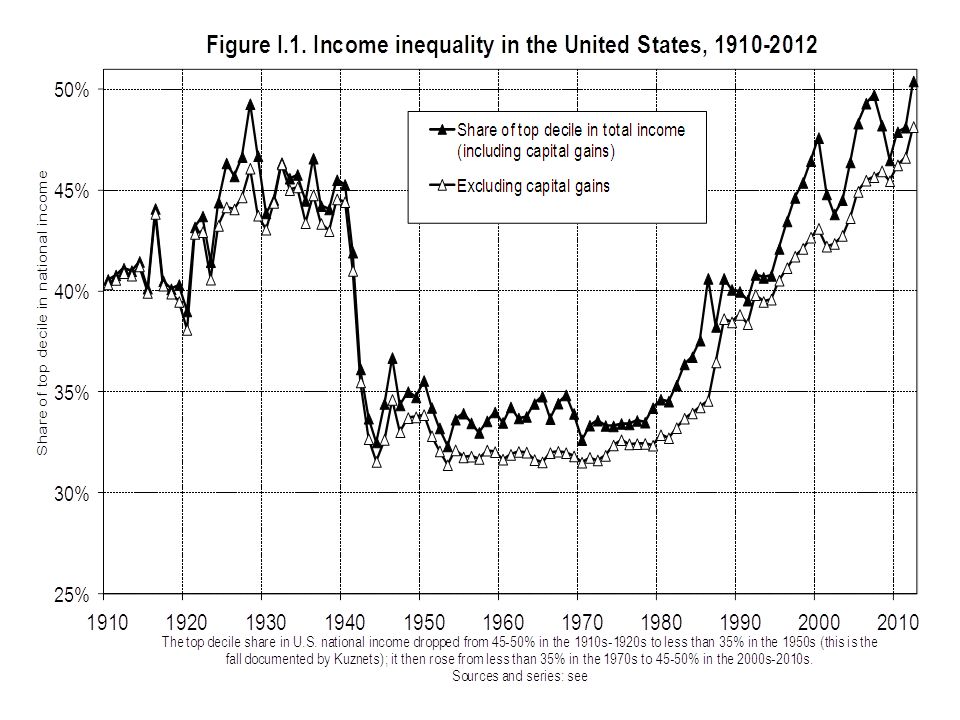
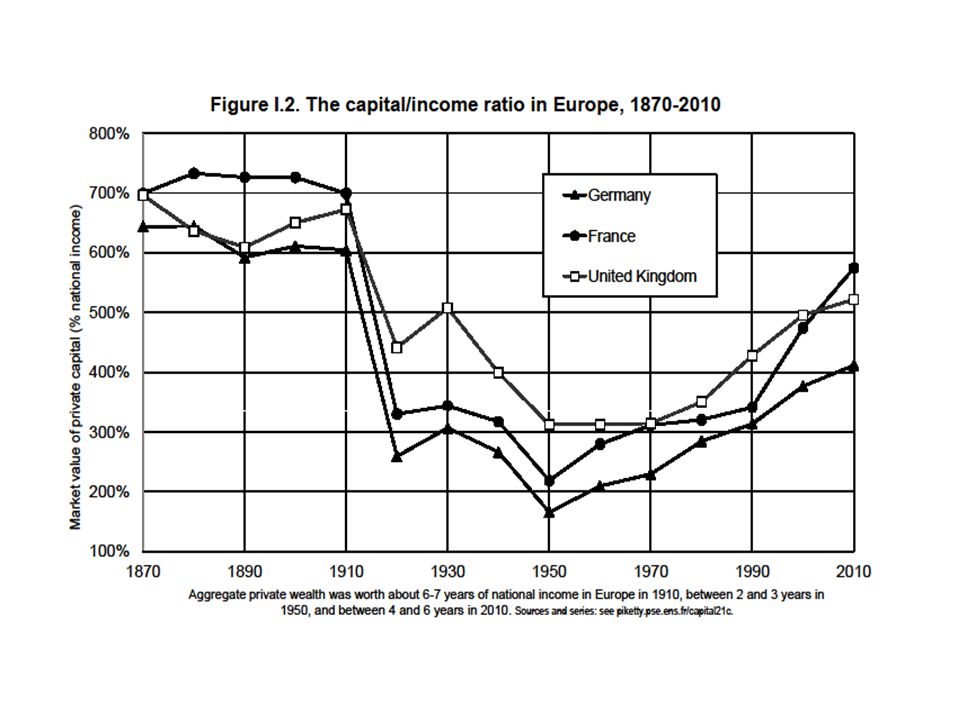
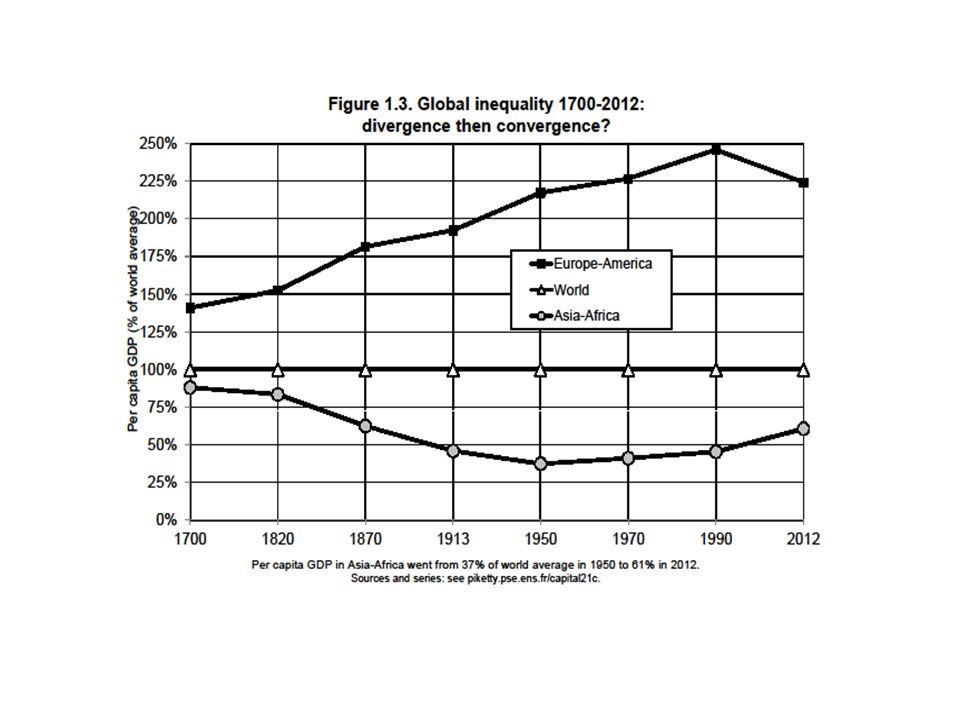
(1) Global income inequality : divergence between Western and other countries during 19c & until mid 20c, convergence since (reduction of inequality) (2) Within-country income inequality: in the US, income inequality rose since 1980 & is now back to the levels observed in early 20c : i.e. about 50% of national income for the top 10% (3) Capital/income ratio: in Europe & Japan, K/Y is almost back to the level observed in early 20c : i.e. about % for K/Y These three evolutions are partly related (world wars, decolonization, end of communism, globalization), but also invole country specific mechanisms: (1) largely due to internal evolutions of emerging countries ; (2) = mostly US trend; (3) mostly Europe and Japan (postwar recovery, demography) ; (2) and (3) could happen together everywhere in the future - or not One of the central objectives of this course is to better understand these long-run evolutions: how did rich countries get rich, and how do inequality and state formation interact?
 Global income inequality : divergence between Western and other countries during 19c & until mid 20c, convergence since (reduction of inequality) (2) Within-country income inequality: in the US, income inequality rose since 1980 & is now back to the levels observed in early 20c : i.e. about 50% of national income for the top 10% (3) Capital/income ratio: in Europe & Japan, K/Y is almost back to the level observed in early 20c : i.e. about % for K/Y. These three evolutions are partly related (world wars, decolonization, end of communism, globalization), but also invole country specific mechanisms: (1) largely due to internal evolutions of emerging countries ; (2) = mostly US trend; (3) mostly Europe and Japan (postwar recovery, demography) ; (2) and (3) could happen together everywhere in the future - or not. One of the central objectives of this course is to better understand these long-run evolutions: how did rich countries get rich, and how do inequality and state formation interact")
6
Basic concepts: income and capital
National income Y = domestic output Yd (NDP) + net foreign factor income Domestic output Yd (NDP = Net domestic product) = GDP (Gross domestic product) – capital depreciation Typically Y and Yd = about 85-90% GDP in rich countries today I.e. capital depreciation = about 10-15% GDP (but can be <5% in agrarian societies: low land depreciation rates as compared to buildings, equipment, computers, etc.) Net foreign factor income can be >0 (typically in countries with net foreign asset position > 0), or <0 (typically in countries with net foreign asset position < 0)
 + net foreign factor income. Domestic output Yd (NDP = Net domestic product) = GDP (Gross domestic product) – capital depreciation. Typically Y and Yd = about 85-90% GDP in rich countries today. I.e. capital depreciation = about 10-15% GDP (but can be <5% in agrarian societies: low land depreciation rates as compared to buildings, equipment, computers, etc.) Net foreign factor income can be >0 (typically in countries with net foreign asset position > 0), or <0 (typically in countries with net foreign asset position < 0)")
7
Net foreign asset position (NFA) = gross foreign assets (gross assets owned by the residents of a country in the rest of world) – gross foreign liabilities (debt) (gross assets owned by rest of the world in the country) Net foreign capital income = close to 0% of Yd in most rich countries (between +1-2% & -1-2% Yd) : right now, rich countries own approximately as much foreign assets in rest of the world as ROW owns in home assets, so that national income ≈ domestic output But this has not always been like this (colonial times); and it could change again: Germany and Japan – and China and oil producing countries – are currently accumulating large foreign assets position At the world level, net foreign income flows cancel out, so that national income Y = domestic output Yd
 : right now, rich countries own approximately as much foreign assets in rest of the world as ROW owns in home assets, so that national income ≈ domestic output. But this has not always been like this (colonial times); and it could change again: Germany and Japan – and China and oil producing countries – are currently accumulating large foreign assets position. At the world level, net foreign income flows cancel out, so that national income Y = domestic output Yd.")
8
National income Y = Yd + r NFA
Private capital (or private wealth) W = non-financial assets (real estate, family firms,..) + financial assets (equity, bonds, life insurance, deposits, cash, pension funds,..) – financial liabilities (debt) held by private individuals (households) (+non-profit inst.) Public capital (or public wealth) Wg = non-fin + fin assets – liabilities held by the government (all levels) National capital (or national wealth) Wn = W + Wg National wealth Wn = domestic capital K + net foreign assets NFA Domestic capital K = agricultural land + housing + other domestic capital (=structures, equipment, patents,.. used by firms & govt) Note that firms are valued at market prices through equity Private wealth/national income ratio β = W/Y National wealth/national income ratio βn = Wn/Y Domestic capital/output ratio βk = K/Yd At the world level, national wealth/national income ratio = domestic capital/output ratio; but at the country level, it can differ
 W = non-financial assets (real estate, family firms,..) + financial assets (equity, bonds, life insurance, deposits, cash, pension funds,..) – financial liabilities (debt) held by private individuals (households) (+non-profit inst.) Public capital (or public wealth) Wg = non-fin + fin assets – liabilities held by the government (all levels) National capital (or national wealth) Wn = W + Wg. National wealth Wn = domestic capital K + net foreign assets NFA. Domestic capital K = agricultural land + housing + other domestic capital (=structures, equipment, patents,.. used by firms & govt) Note that firms are valued at market prices through equity. Private wealth/national income ratio β = W/Y. National wealth/national income ratio βn = Wn/Y. Domestic capital/output ratio βk = K/Yd. At the world level, national wealth/national income ratio = domestic capital/output ratio; but at the country level, it can differ.")
9
Basic orders of magnitude in rich countries today
National wealth Wn ≈ private wealth W (i.e. public wealth Wg ≈ 0) (or <0..) National wealth Wn ≈ domestic capital K (i.e. net foreign asset NFA ≈ 0) (but large gross foreign positions) National wealth Wn ≈ % of national income Y ≈ residential housing + other domestic capital (≈ 50-50) Typically, in France, UK, Germany, Italy, US, Japan: Per capita average income Y ≈ € (= national income/population) Per capita average wealth W ≈ € (=private wealth/pop) I.e. β = W/Y ≈ 5-6 YK = capital income = rent, dividend, interest, profits,.. α = YK/Y = capital share in national income ≈ 25-30% I.e. average rate of return r = α/β = 4-5% Basic accounting law: α = r x β → see Lecture 2 on the dynamics of β and α
 (or <0..) National wealth Wn ≈ domestic capital K. (i.e. net foreign asset NFA ≈ 0) (but large gross foreign positions) National wealth Wn ≈ % of national income Y. ≈ residential housing + other domestic capital (≈ 50-50) Typically, in France, UK, Germany, Italy, US, Japan: Per capita average income Y ≈ € (= national income/population) Per capita average wealth W ≈ € (=private wealth/pop) I.e. β = W/Y ≈ 5-6. YK = capital income = rent, dividend, interest, profits,.. α = YK/Y = capital share in national income ≈ 25-30% I.e. average rate of return r = α/β = 4-5% Basic accounting law: α = r x β. → see Lecture 2 on the dynamics of β and α.")
10
Data about long-run growth
Long run national accounts: see Maddison 2008 (and official series for recent decades); see this excel file See Capital…, chapters 1-2 Maddison: no data on capital stock See Piketty-Zucman; see Goldsmith
; see this excel file. See Capital…, chapters 1-2. Maddison: no data on capital stock. See Piketty-Zucman; see Goldsmith.")
11
Facts & questions about long-run growth
Fact 1: Convergence Convergence between poor and rich countries now seems well under way; but not over yet (?) Fact 2: Global growth slowdown in 21c Productivity growth is always slow for countries at the world technological frontier; once global catch-up process is over, growth might be low everywhere (?) Population growth seems to be →0 (or <0) (?)
 Fact 2: Global growth slowdown in 21c. Productivity growth is always slow for countries at the world technological frontier; once global catch-up process is over, growth might be low everywhere ( ) Population growth seems to be →0 (or <0) ( )")
12
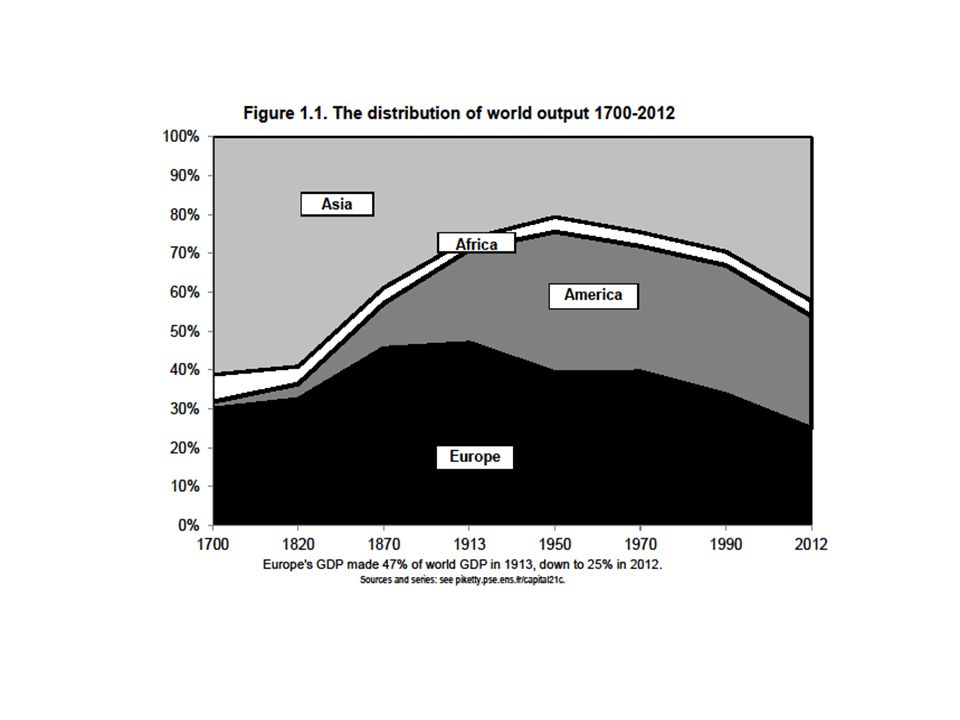
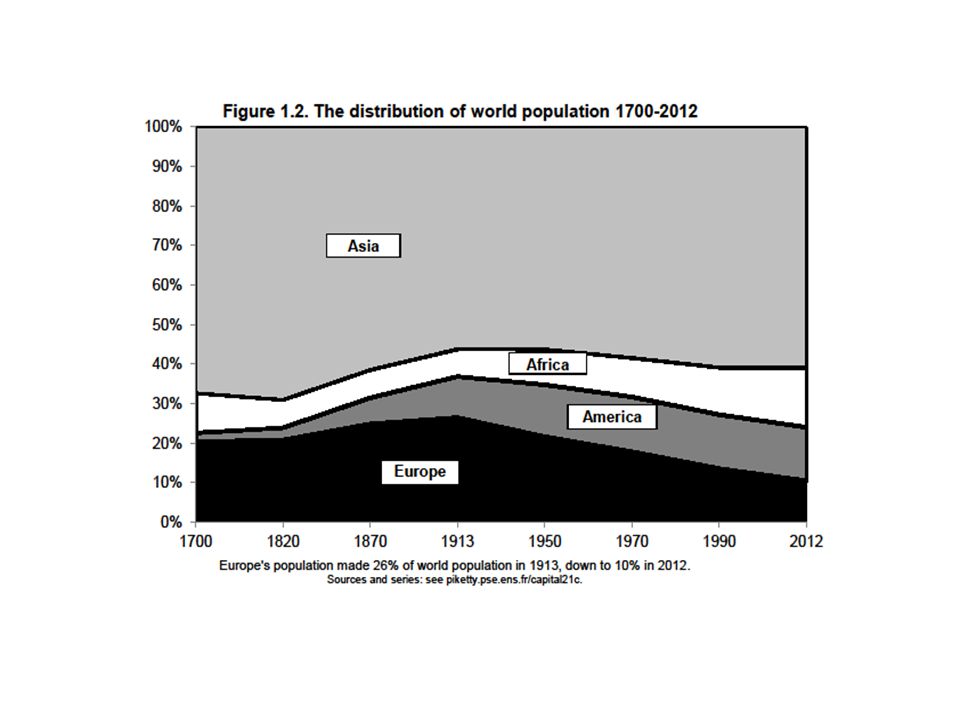
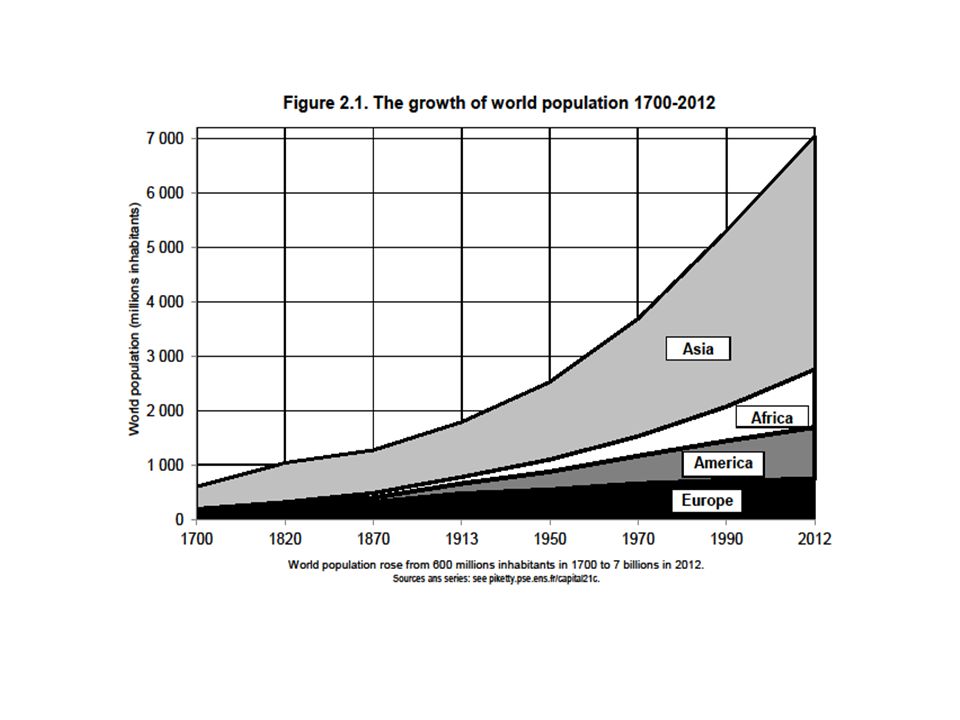
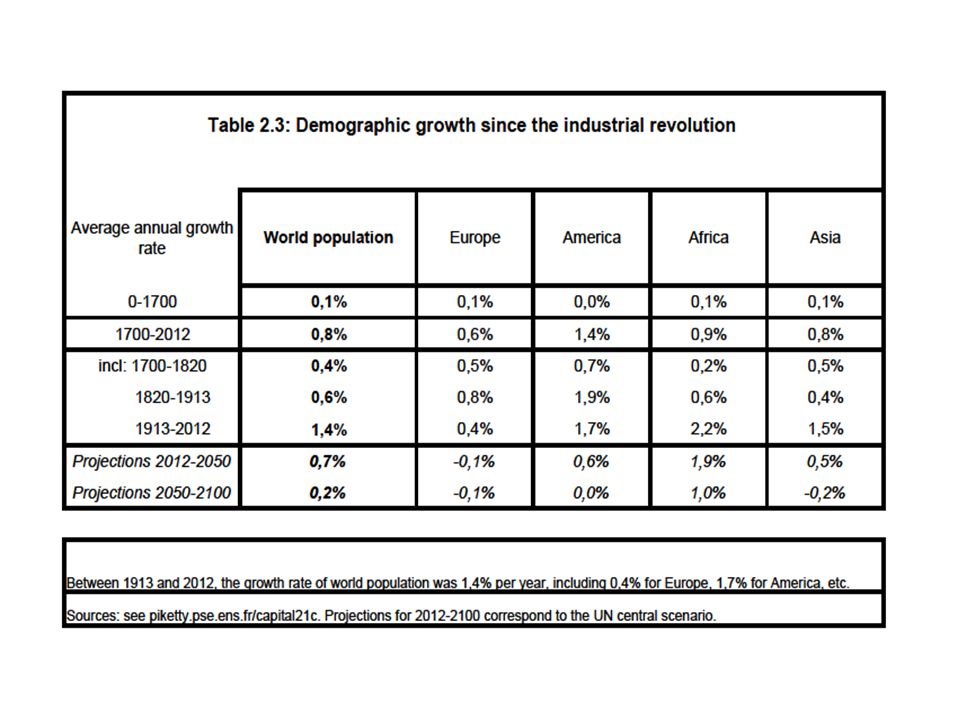
Fact 1. Convergence Between 1900 and 1980, Europe + America ≈ 70-80% world GDP In 2013: down to about 50% (as in 1860) At some point during 21c: down to 20-30%, i.e. to the share of Europe + America in world population = convergence in per capita output and income But will convergence be over in 2030, 2060 or 2090? Nobody knows. Probably closer to 2030 in East Asia, and closer to 2090 in South Asia and Africa. Convergence occured mostly through domestic investment (not so much through foreign investment: emerging countries are not owned by rich countries… except Africa) Economic openness had a critical impact on development via free trade (specialization effect) and via diffusion of technology and know-how; but maybe not so much via free capital flows More on this below
 Economic openness had a critical impact on development via free trade (specialization effect) and via diffusion of technology and know-how; but maybe not so much via free capital flows. More on this below.")
16
Basic orders of magnitude to remember:
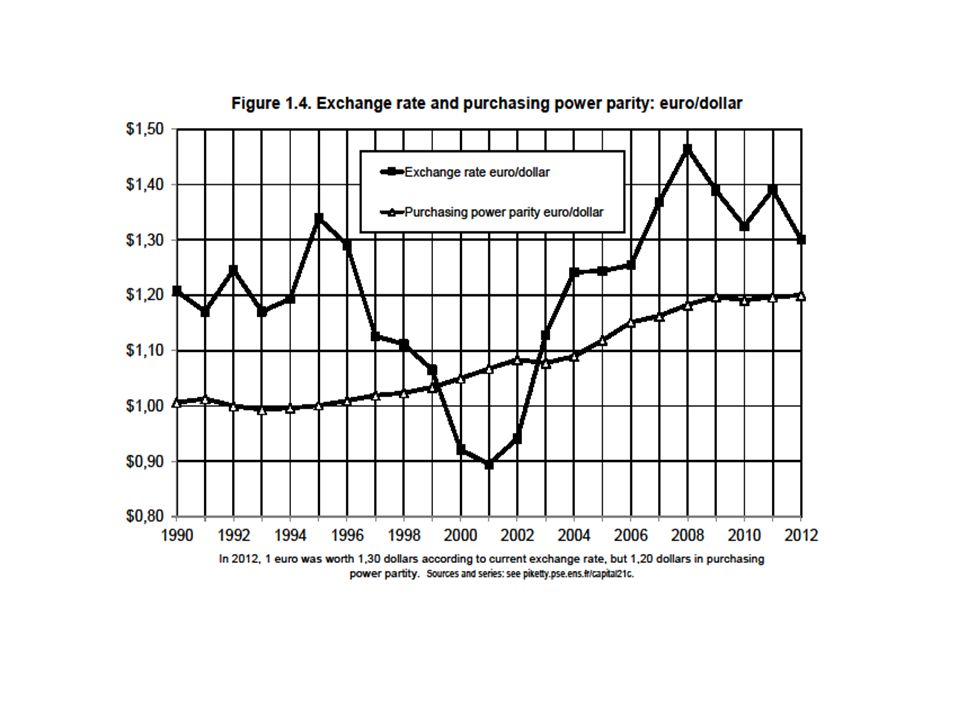
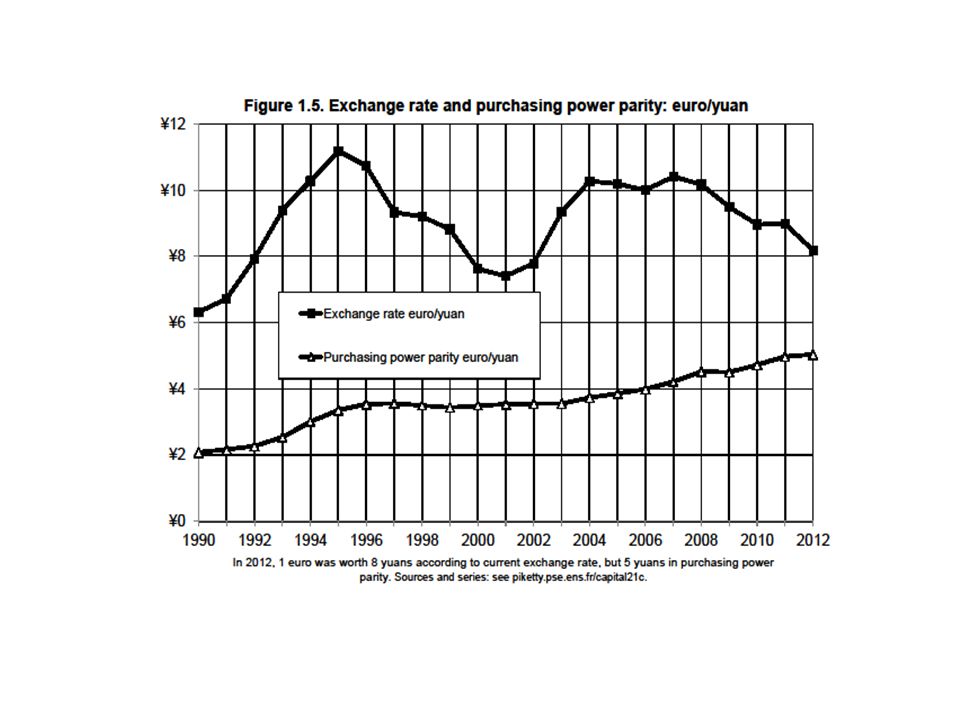
World GDP 2012 = about 70 trillions € (i.e billions €) World population = about 7 billions Per capital GDP = about € Per capital income = about 800€/month Rich countries = about €/month Poor countries = about €/month More inequality in income than in output, and in market exchange rates than in PPP
 World population = about 7 billions. Per capital GDP = about € Per capital income = about 800€/month. Rich countries = about €/month. Poor countries = about €/month. More inequality in income than in output, and in market exchange rates than in PPP.")
20
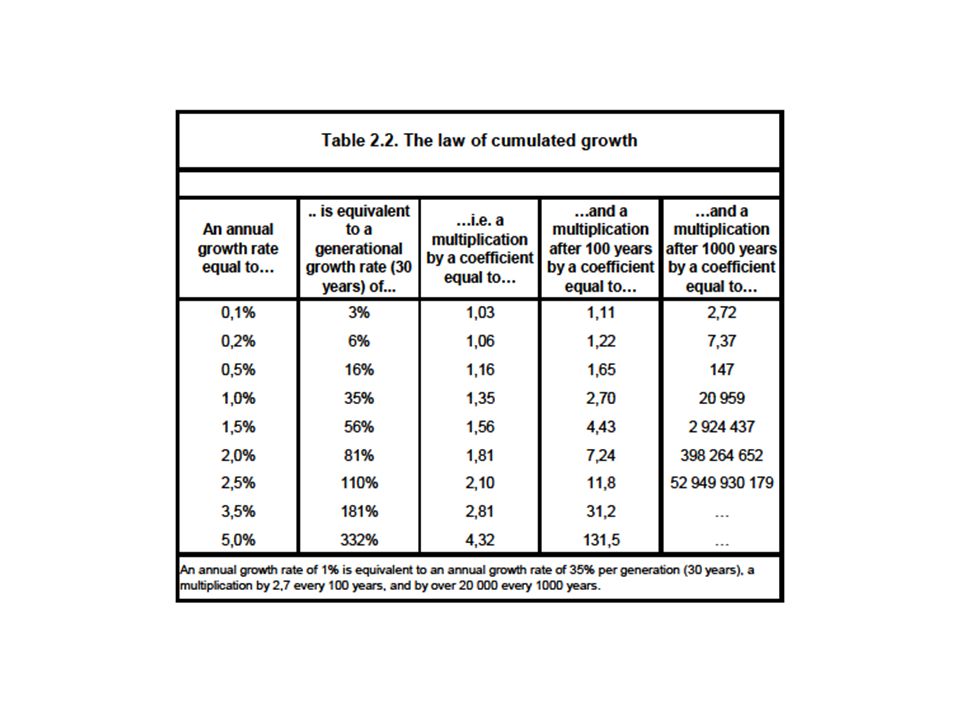
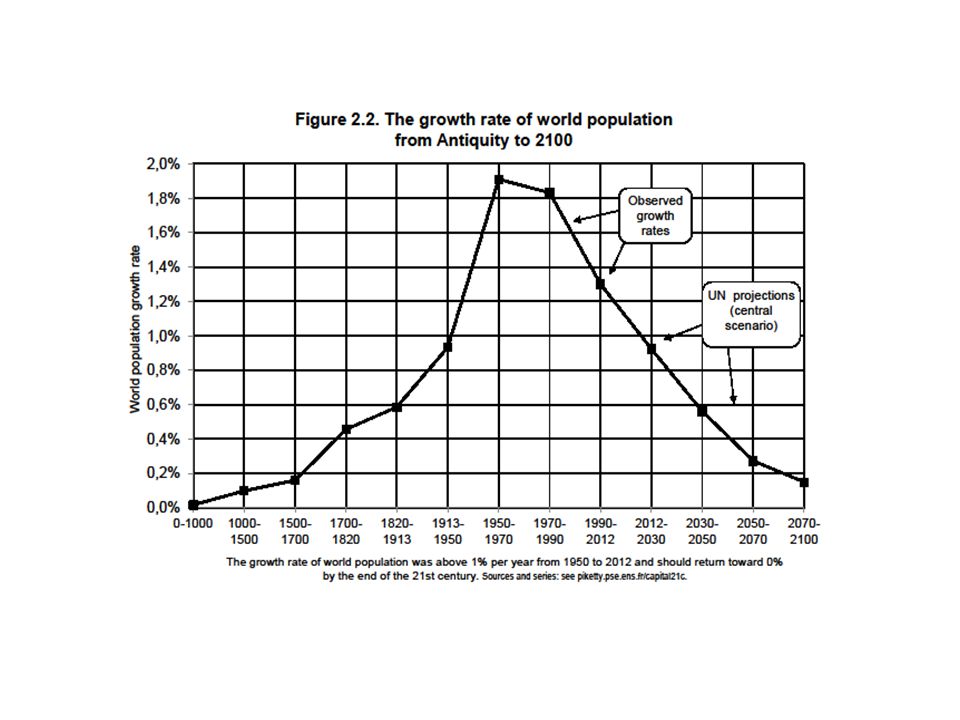
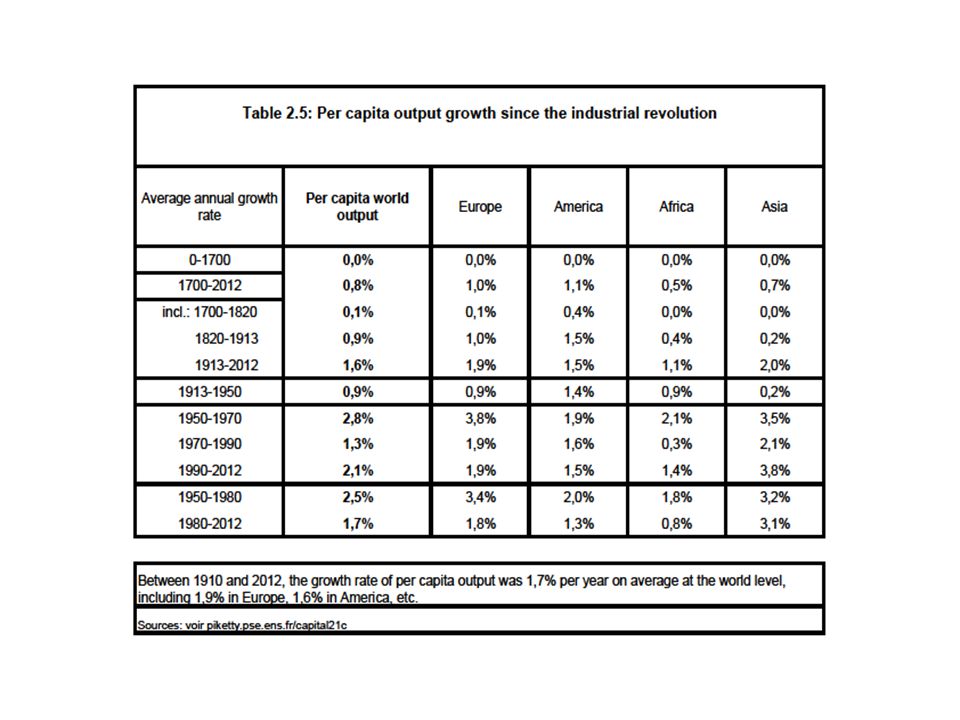
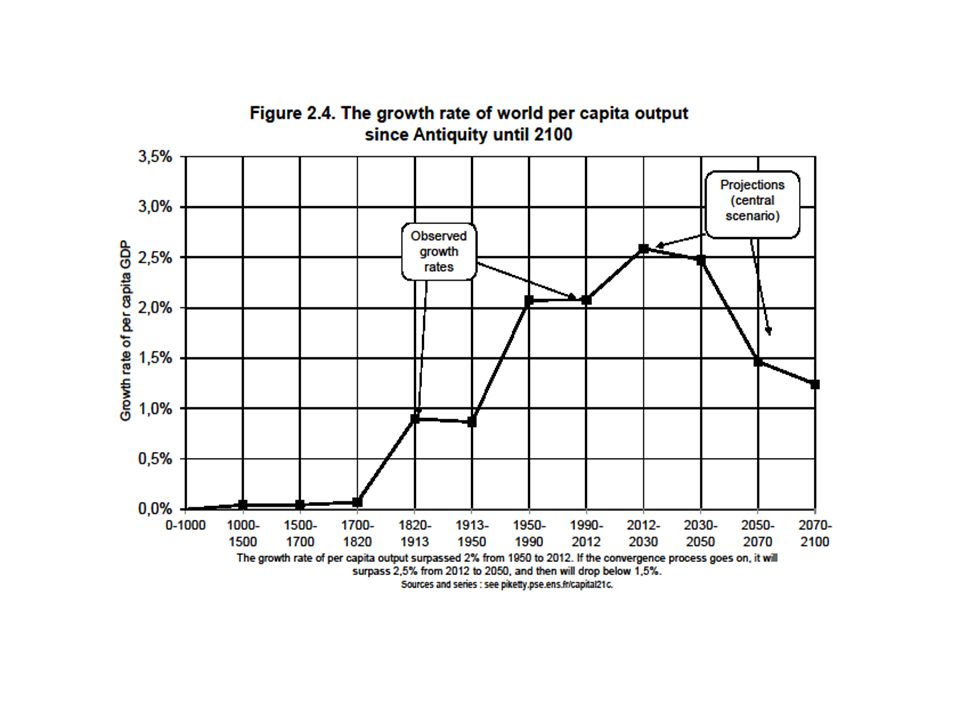
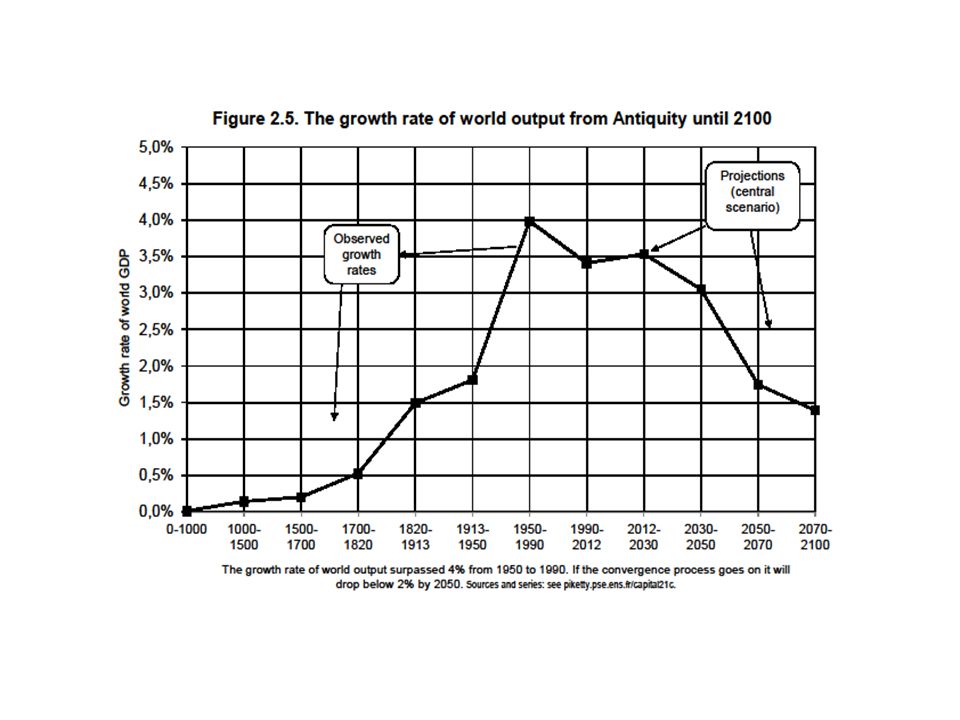
Fact 2. Growth slowdown Productivity growth is always slow for countries at the world technological frontier; once global catch-up process is over, growth might be low everywhere Population growth seems to be →0 (or <0) Average world growth : g=1,6%, including n=0,8% for population and h=0,8% for per capita output But 0,8% per year was enough to multiply world population (and average income) by a factor of 10 g = n + h with n = population growth and h = productivity growth In the very long run, maybe n ≈ 0% and h ≈ 1-1,5%, so that g=n+h≈1-1,5% Some economists are even less optimistic: long-run g<1% according to Gordon 2012
 Average world growth : g=1,6%, including n=0,8% for population and h=0,8% for per capita output. But 0,8% per year was enough to multiply world population (and average income) by a factor of 10. g = n + h with n = population growth. and h = productivity growth. In the very long run, maybe n ≈ 0% and h ≈ 1-1,5%, so that g=n+h≈1-1,5% Some economists are even less optimistic: long-run g<1% according to Gordon")
26
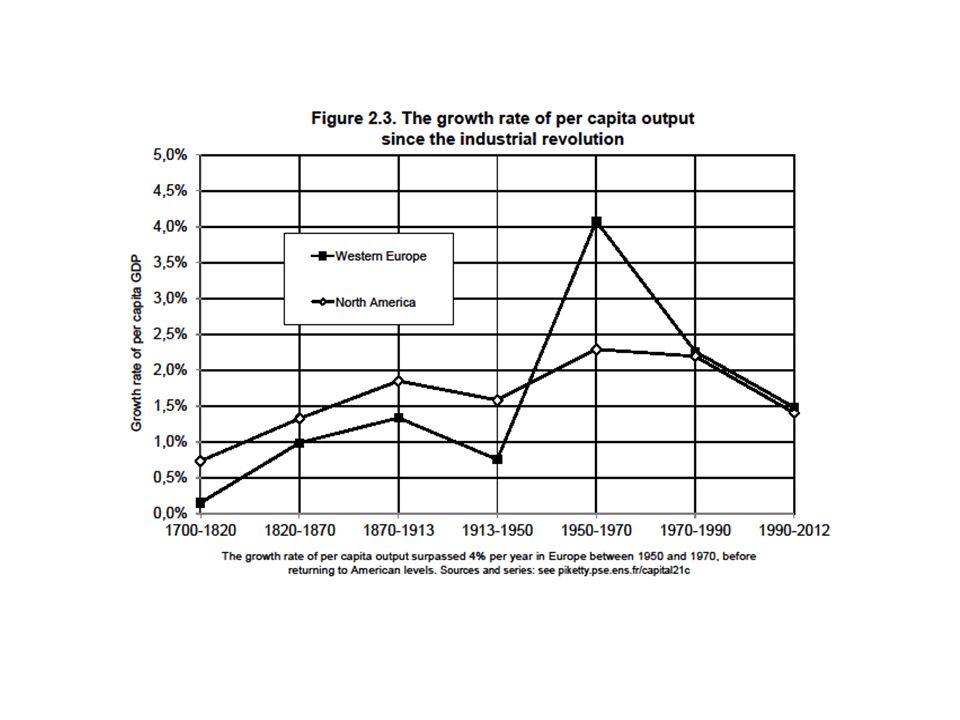
Per capita growth was exceptionally high in Europe and Japan in the period (h=4-5% per year) because of a catch-up process with the US; but since 1980, per capital growth rates have been low in all rich countries In the very long, h=1% is already quite fast and requires permanent reallocation of labor (about one third of the economy is being renewed at each generation)
")
32
How did convergence happen?
One possible view: with free markets and private property, everybody should become rich. The West first adopted these « institutions » (the rule of law and well-protected property rights) and became rich. Now that the rest of the world is following this strategy, everybody will become rich A bit simplistic: (1) Rising living standards in 20c came with the rise of government (tax revenues: 10% Y before WW1; 30-50% Y in all developed countries today). In order to understand development, one needs a broader view of institutions: public infrastructures, education, social welfare, economic and political democracy (2) Rise of the West over period came with violence: key role of slavery, colonization, political domination. Not really peaceful institutions and rule of law…
 and became rich. Now that the rest of the world is following this strategy, everybody will become rich. A bit simplistic: (1) Rising living standards in 20c came with the rise of government (tax revenues: 10% Y before WW1; 30-50% Y in all developed countries today). In order to understand development, one needs a broader view of institutions: public infrastructures, education, social welfare, economic and political democracy. (2) Rise of the West over period came with violence: key role of slavery, colonization, political domination. Not really peaceful institutions and rule of law…")
33
(3) Free markets and private property led to extreme inequality and social tensions by >>> nationalism, wars, communism >> the elites accept public regulation >>> reduction of inequality ( But complex legacy: different memories of post-WW2 exceptional period: high-growth egalitarian ideal in western Europe; « catch-up » period, except for US/UK (Reagan-Thatcher reaction); low-growth communist nightmare in Russia/China; decolonization period and mixed experience with state intervention; European colonial power replaced by US power system… until today
; low-growth communist nightmare in Russia/China; decolonization period and mixed experience with state intervention; European colonial power replaced by US power system… until today.")
34
(4) Rise of emerging countries did not come from foreign invt..
Standard growth model: output cv, not income cv Learning to live with inequality: the dimensions of political conflict

35
The standard growth model (1)
Output Y = F(K,L) with K = capital input (=non-human capital: buildings, equipment, robots, patents, etc.) and L = labor input (=human capital) Constant-returns-to-scale production function: F(µK,µL)=µF(K,L) → F(K,L) = L f(k) , with k = K/L = capital per labor unit and f(k) = F(K,L)/L=F(K/L,1) = output per labor unit Exemple: Cobb-Douglas production function: F(K,L)=Kα L1-α, i.e. f(k)=kα As k → ∞, marginal product of capital f’(k) → 0 : capital accumulation is not sufficient in itself to generate long-run growth; one also needs long-run population and/or productivity growth; see Solow 1956
 with K = capital input (=non-human capital: buildings, equipment, robots, patents, etc.) and L = labor input (=human capital) Constant-returns-to-scale production function: F(µK,µL)=µF(K,L) → F(K,L) = L f(k) , with k = K/L = capital per labor unit. and f(k) = F(K,L)/L=F(K/L,1) = output per labor unit. Exemple: Cobb-Douglas production function: F(K,L)=Kα L1-α, i.e. f(k)=kα. As k → ∞, marginal product of capital f’(k) → 0 : capital accumulation is not sufficient in itself to generate long-run growth; one also needs long-run population and/or productivity growth; see Solow")
36
The standard growth model (2)
Steady-state growth path = everything grows at rate g Yt = F(Kt,Lt) = Y0 egt with Kt = K0 egt and Lt = L0 egt (all ratios are constant) The growth of labor input Lt = Nt x Pt can be decomposed into the growth of (employed) population Nt=N0ent and the growth of productivity Pt=P0eht I.e. g = n + h with n = population growth and h = productivity growth Convergence: standard growth model implies output convergence, not income convergence; possibility of persistent wealth inequality
 = Y0 egt with Kt = K0 egt and Lt = L0 egt (all ratios are constant) The growth of labor input Lt = Nt x Pt can be decomposed into the growth of (employed) population Nt=N0ent and the growth of productivity Pt=P0eht. I.e. g = n + h with n = population growth. and h = productivity growth. Convergence: standard growth model implies output convergence, not income convergence; possibility of persistent wealth inequality.")
37
The standard growth model (3)
Where does population growth rate n come from? Fertility decisions, health conditions, etc. Where does productivity growth rate h come from? Human capital accumulation, educational institutions, innovations, etc. Endogenous growth literature = endogenizing g=n+h ; see e.g. Jones-Romer 2010 for a brief survey Steady-state capital-output ratio β=K/Y matters for output level, but not for output growth; same thing for employment rates Note: annual growth rates (Yt = Y0 (1+ga)t ) do not perfectly coincide with instantaneous growth rates (Yt = Y0 egt ): 1+ga = eg , i.e. ga ≈ g only if ga and g are small The advantage of instantaneous growth rates is additivity: g=n+h With annual growth rates, 1+ga = (1+ na) x (1+ha)
t ) do not perfectly coincide with instantaneous growth rates (Yt = Y0 egt ): 1+ga = eg , i.e. ga ≈ g only if ga and g are small. The advantage of instantaneous growth rates is additivity: g=n+h. With annual growth rates, 1+ga = (1+ na) x (1+ha)")
Similar presentations


 Thomas Piketty Academic year 2013-2014 Lecture 7: The regulation of capital and inequality.>")


 Thomas Piketty Academic year 2014-2015 Lecture 2: The dynamics of capital/income.>")


 Thomas Piketty Academic year 2015-2016 Lecture 4: Income Taxes.>")