Download presentation
Presentation is loading. Please wait.

1
Medical Image Analysis Introduction Figures come from the textbook: Medical Image Analysis, Second Edition, by Atam P. Dhawan, IEEE Press, 2011.

2
Modalities X-ray Computed Tomography (X-ray CT) Magnetic Resonance Imaging (MRI) Single Photon Emission Computed Tomography (SPECT) Positron Emission Tomography (PET) Ultrasound
 Magnetic Resonance Imaging (MRI) Single Photon Emission Computed Tomography (SPECT) Positron Emission Tomography (PET) Ultrasound")
3
An X-ray mammogram Figures come from the textbook: Medical Image Analysis, Second Edition, by Atam P. Dhawan, IEEE Press, 2011.

4
An X-ray CT

5
A PET Figures come from the textbook: Medical Image Analysis, Second Edition, by Atam P. Dhawan, IEEE Press, 2011.

6
An MRI Figures come from the textbook: Medical Image Analysis, Second Edition, by Atam P. Dhawan, IEEE Press, 2011.

7
Figure comes from the Wikipedia, www.wikipedia.org.www.wikipedia.org An ultrasound

8
Medical image modalities ◦ Energy ◦ Anatomical, physiological, or functional ◦ External, internal, or combination Figures come from the textbook: Medical Image Analysis, Second Edition, by Atam P. Dhawan, IEEE Press, 2011.

9
10 -10 Radio Waves TV Waves Radar Waves Microwaves Infrared Rays Visible Light Ultraviolet Rays X-rays Gamma Rays 10 2 10 1 1 10 -1 10 -2 10 -3 10 -4 10 -6 10 -7 10 -8 Wavelength in meters Frequency in Hz 10 -5 10 -9 10 -10 10 -11 10 -12 10 -13 10 -14 10 3 10 6 10 7 10 910 10 11 10 12 10 14 10 15 10 16 10 13 10 17 10 18 10 19 10 20 10 21 10 22 10 5 10 8 Energy in eV 10 -9 10 -8 10 -6 10 -5 10 -4 10 -3 10 -1 110 1 10 -2 10 2 10 3 10 4 10 5 10 6 10 7 10 -7 MRI X-ray Imaging Gamma-ray Imaging Cosmic Rays Figure 1.2: Different sources of imaging modality in the electromagnetic spectrum.

10
Figures come from the textbook: Medical Image Analysis, Second Edition, by Atam P. Dhawan, IEEE Press, 2011. Sourceof Energy Used for Imaging External Internal Combination: External and Internal Nuclear Medicine: Single Photon EmissionTomography (SPECT) Nuclear Medicine: Positron Emission Tomography (PET) Magnetic Resonance Imaging: MRI, PMRI, FMRI Optical Fluorescence Imaging Electrical Impedance Imaging Medical Imaging Modalities X-Ray Radiographs X-Ray Mammography X-Ray Computed Tomography Optical Transmission andTransillumination Imaging Ultrasound Imaging and Tomography
 Nuclear Medicine: Positron Emission Tomography (PET) Magnetic Resonance Imaging: MRI, PMRI, FMRI Optical Fluorescence Imaging Electrical Impedance Imaging Medical Imaging Modalities X-Ray Radiographs X-Ray Mammography X-Ray Computed Tomography Optical Transmission andTransillumination Imaging Ultrasound Imaging and Tomography.")
11
Figures come from the textbook: Medical Image Analysis, Second Edition, by Atam P. Dhawan, IEEE Press, 2011. Figure 1.1. A collaborative multidisciplinary paradigm of medical imaging research and applications.

12
From Physiology to Information Processing Understanding image medium ◦ Tissue density, blood flow, perfusion, cardiac motion Physics of imaging ◦ Transmission of X-rays, emission of gamma rays, MR imaging Imaging instrumentation ◦ Collecting the data, signal-to-noise ratio, resolution Figures come from the textbook: Medical Image Analysis, Second Edition, by Atam P. Dhawan, IEEE Press, 2011.

13
Data acquisition methods for image formation ◦ Active filtering, post-processing methods ◦ Back-projection, iterative and Fourier transform methods Imaging processing and analysis ◦ Enhancement, transformations, features of interest Figures come from the textbook: Medical Image Analysis, Second Edition, by Atam P. Dhawan, IEEE Press, 2011.

14
General Performance Measures Positive: Object was observed Negative: Object was not observed True Positive False Negative True Negative False Positive Figures come from the textbook: Medical Image Analysis, Second Edition, by Atam P. Dhawan, IEEE Press, 2011.

15
True Positive True Negative False Negative False Positive True Condition Object is present. Object is NOT present. Object is observed. Object is NOT observed. Observed Information Figure 1.4. A conditional matrix for defining four basic performance measures as defined in the text.

16
Figures come from the textbook: Medical Image Analysis, Second Edition, by Atam P. Dhawan, IEEE Press, 2011. TNF TPF b a c Figure 1.5: ROC curves with curve “a” indicating better overall classification ability than the curve “b” while the curve “c” shows the random probability.

17
Sensitivity Specificity Accuracy Figures come from the textbook: Medical Image Analysis, Second Edition, by Atam P. Dhawan, IEEE Press, 2011.

18
An example of feature-adaptive contrast enhancement processing as applied to a mammogram to enhance microcalcification areas ◦ Histogram equalization Figures come from the textbook: Medical Image Analysis, Second Edition, by Atam P. Dhawan, IEEE Press, 2011.

19
Figure 1.6. (a) A part of the digitized breast film-mammogram with microcalcification areas. (b): Enhanced image through feature adaptive contrast enhancement algorithm. (c): Enhanced image through histogram equalization method.
: Enhanced image through feature adaptive contrast enhancement algorithm. (c): Enhanced image through histogram equalization method..")
20
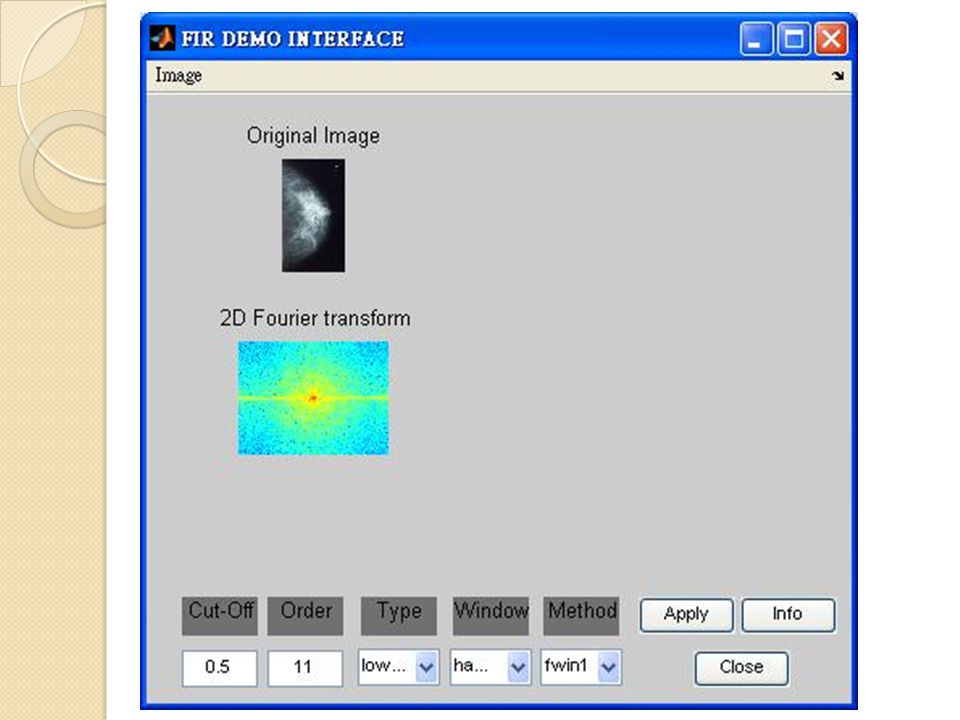
MATLAB Image Processing Toolbox Basic MATLAB image toolbox commands Figures come from the textbook: Medical Image Analysis, Second Edition, by Atam P. Dhawan, IEEE Press, 2011. pic = imread(f); pic = rgb2gray(pic); imagesc(pic); qb = fftshift(log(abs(fft2(pic))));
; pic = rgb2gray(pic); imagesc(pic); qb = fftshift(log(abs(fft2(pic))));.")
21
Imagepro Interface in MATLAB Environment and Image Databases

23
ImageJ and Other Image Processing Software Packages ImageJ 3D Slicer Mango MRIcro Figures come from the textbook: Medical Image Analysis, Second Edition, by Atam P. Dhawan, IEEE Press, 2011.

24
Selected slices for the course Chapters 2-12 Figures come from the textbook: Medical Image Analysis, Second Edition, by Atam P. Dhawan, IEEE Press, 2011.

25
Figure 2.7. (a) An image with a square region at the center and (b) the logarithmic magnitude image of its Fourier transform.
 An image with a square region at the center and (b) the logarithmic magnitude image of its Fourier transform..")
26
Figures come from the textbook: Medical Image Analysis, Second Edition, by Atam P. Dhawan, IEEE Press, 2011. Radiation Interaction with Matter Photon Energy (keV) 0 0 50 0 10 0 1. 0 (cm 2 /g) Rayleigh Scattering Photoelectric Absorption Scattering Compton Scattering Total Mass Attenuation Coefficient Figure 3.1. The mass attenuation coefficients of water under the 511 keV energy range.
 (cm 2 /g) Rayleigh Scattering Photoelectric Absorption Scattering Compton Scattering Total Mass Attenuation Coefficient Figure 3.1. The mass attenuation coefficients of water under the 511 keV energy range..")
27
Figures come from the textbook: Medical Image Analysis, Second Edition, by Atam P. Dhawan, IEEE Press, 2011. Figure 4.7: The translate-rotate parallel-beam geometry of first generation CT scanners.

28
Figures come from the textbook: Medical Image Analysis, Second Edition, by Atam P. Dhawan, IEEE Press, 2011. Figure 4.15 (a). Nuclei aligned under thermal equilibrium in the presence of an external magnetic field. (b). A non-zero net longitudinal vector and a zero transverse vector provided by the nuclei precessing in the presence of an external magnetic field.
. Nuclei aligned under thermal equilibrium in the presence of an external magnetic field. (b). A non-zero net longitudinal vector and a zero transverse vector provided by the nuclei precessing in the presence of an external magnetic field..")
29
Figures come from the textbook: Medical Image Analysis, Second Edition, by Atam P. Dhawan, IEEE Press, 2011. x1x1 x2x2 x3x3 I0I0 R0R0 T 1,2 T 3,4 T 2,3 T 4,3 T 3,2 T 5,4 Z1Z1 Z2Z2 Z3Z3 Z4Z4 Z5Z5 T 2,1 Figure 4.39. A path of a reflected sound wave in a multilayered structure.

30
Figures come from the textbook: Medical Image Analysis, Second Edition, by Atam P. Dhawan, IEEE Press, 2011. x y q p p f(x,y) P(p, ) Figure 2.8. Line integral projection P(p,q) of the two-dimensional Radon transform.
 P(p, ) Figure 2.8. Line integral projection P(p,q) of the two-dimensional Radon transform..")
31
Figure 6.1. An X-ray CT image (top left) and T-2 weighted proton density image (top right) of human brain cross-sections with their respective histograms at the bottom. The MR image shows a brain lesion.
 and T-2 weighted proton density image (top right) of human brain cross-sections with their respective histograms at the bottom. The MR image shows a brain lesion..")
32
Figures come from the textbook: Medical Image Analysis, Second Edition, by Atam P. Dhawan, IEEE Press, 2011. Figure 7.4. Two segmented MR brain images using a gray value threshold T=166 (top) and T=225 (bottom).
 and T=225 (bottom)..")
33
Figure 8.10. Example of morphological operations on MR brain image using a structuring element of (a) the original MR brain image; (b) the thresholded MR brain image for morphological operations; (c) dilation of the thesholded MR brain image; (d) resultant image after 5 successive dilations of the thresholded brain image; (e) erosion of the thresholded MR brain image; (f) closing of the thesholded MR brain image; (g) opening of the thresholded MR brain image; and (h) morphological boundary detection on the thresholded MR brain image.
 the original MR brain image; (b) the thresholded MR brain image for morphological operations; (c) dilation of the thesholded MR brain image; (d) resultant image after 5 successive dilations of the thresholded brain image; (e) erosion of the thresholded MR brain image; (f) closing of the thesholded MR brain image; (g) opening of the thresholded MR brain image; and (h) morphological boundary detection on the thresholded MR brain image..")
34
Figures 9.7 a, b and c: Sequential slices of MR (middle rows) and PET (bottom rows) and the registered MR-PET brain images (top row) of the corresponding slices using the IPAR method.
 and PET (bottom rows) and the registered MR-PET brain images (top row) of the corresponding slices using the IPAR method.")
Similar presentations


 are not up-to-date here for the 6 th edition. But you should be able to recognize the figures anyway.>")


 – Introduction of medical imaging and MRI – Basic.>")

