Download presentation
Presentation is loading. Please wait.

1
Highlights of the Ready Mixed Concrete Industry Data Report Presented to the 45 th Annual Business Administration Conference by William B. Allen Allen & Associates

2
Benchmarking Assists in helping to analyze the cost of doing business Assists in helping to analyze the efficiency of an operation

3
Surveys Available Industry Data Survey Fleet Benchmarking Survey Safety Survey Wage & Benefits Study

4
The Industry Data Survey Company Size Analysis By % Sales & $-Per-yd Regional Analysis By % Sales & $-Per-yd Rual, Urban & Mixed Area Type Analysis Five Year Trend Analysis

8
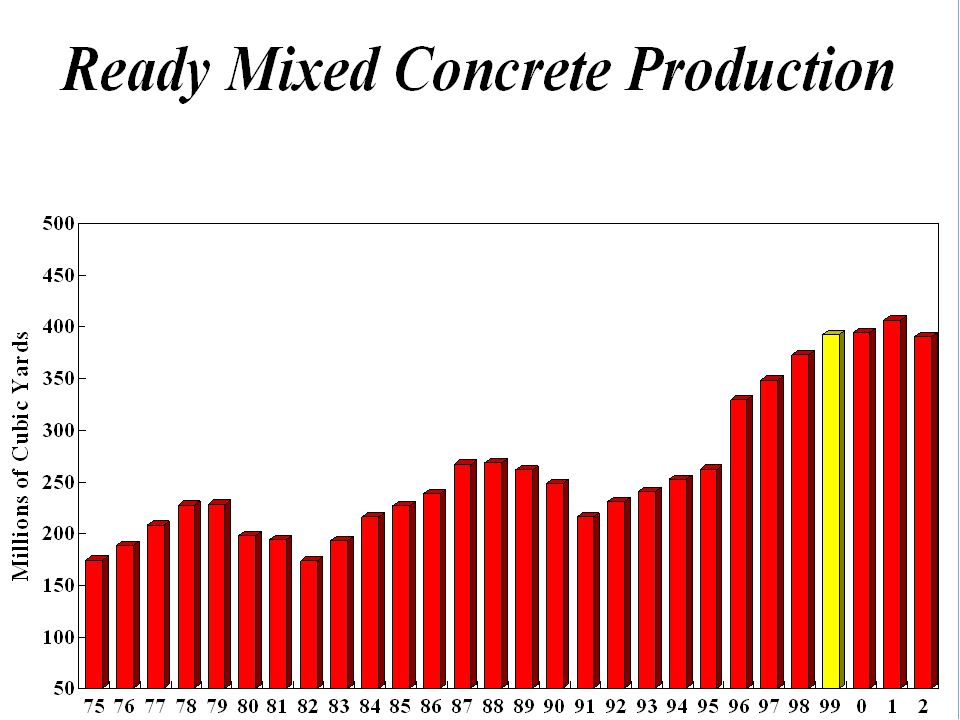
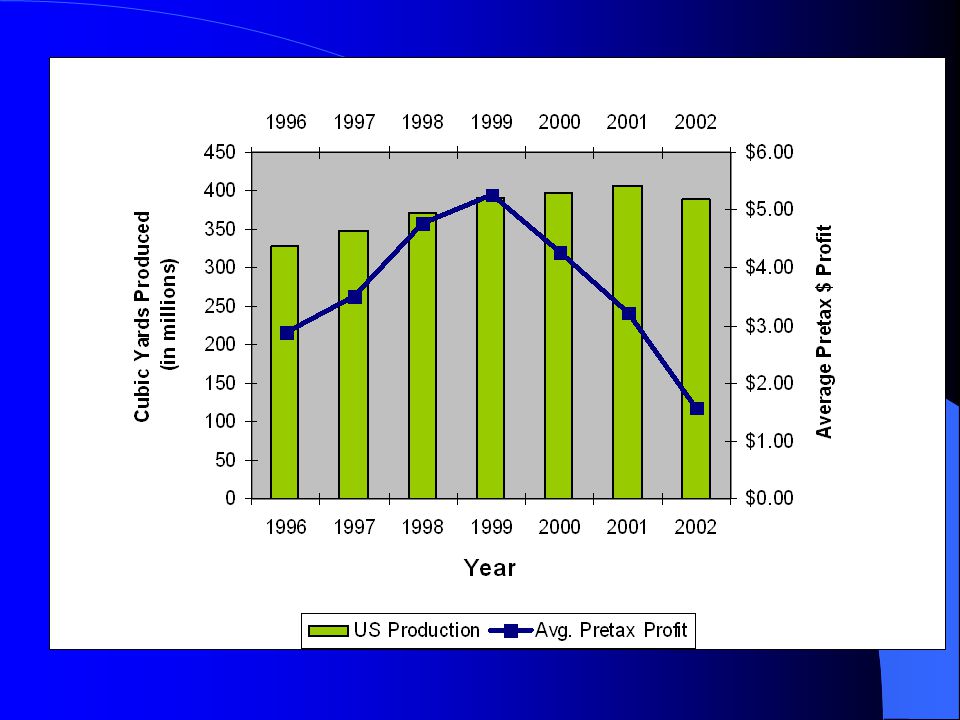
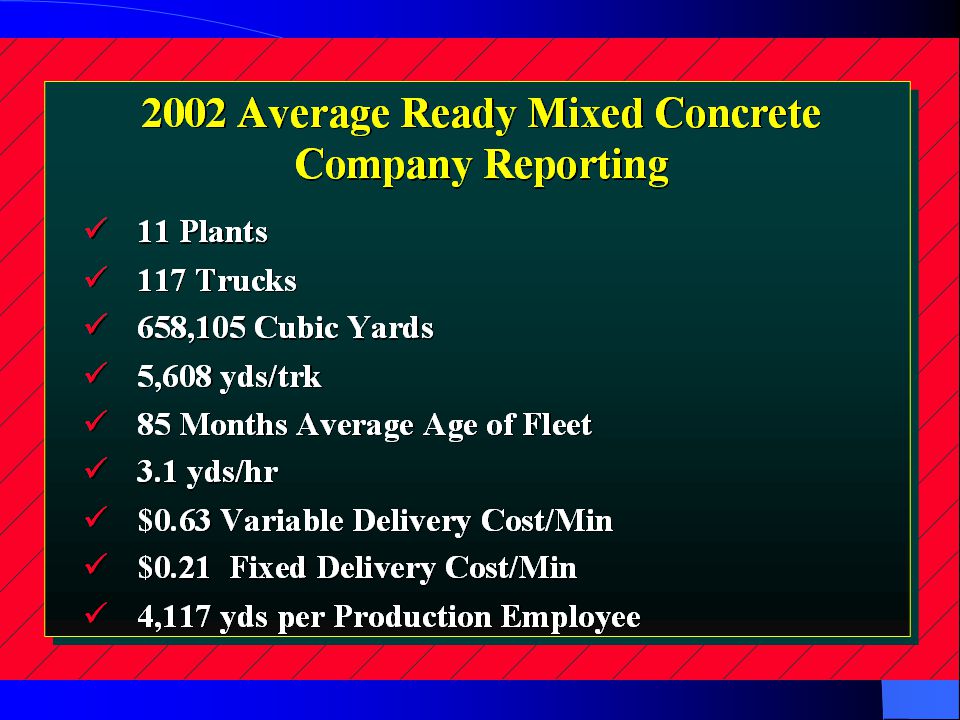
Ready Mix Concrete Production

9
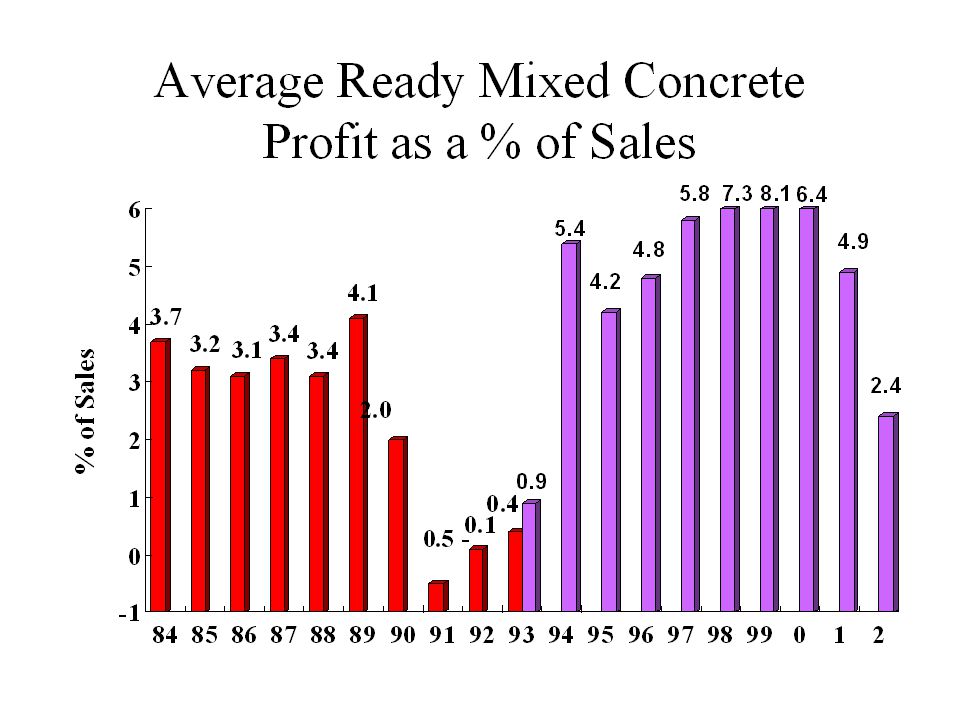
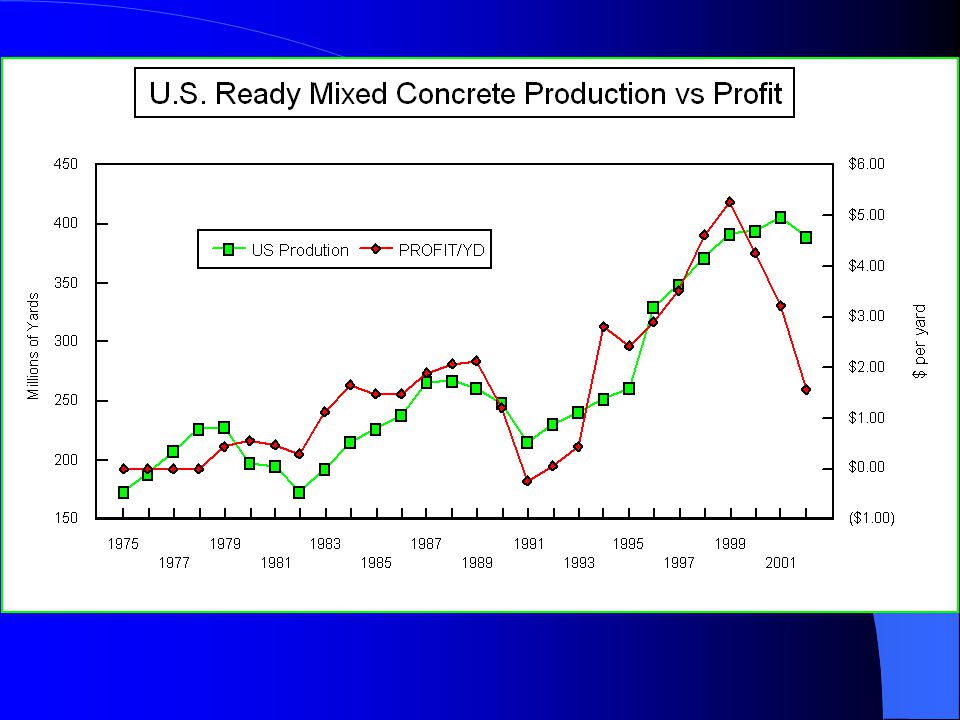
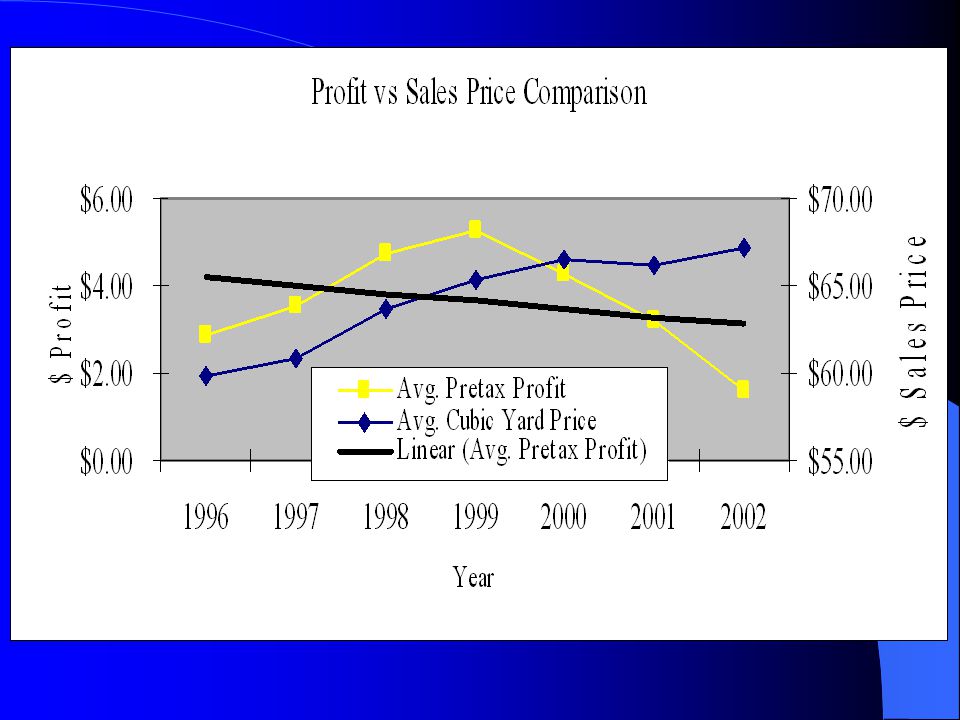
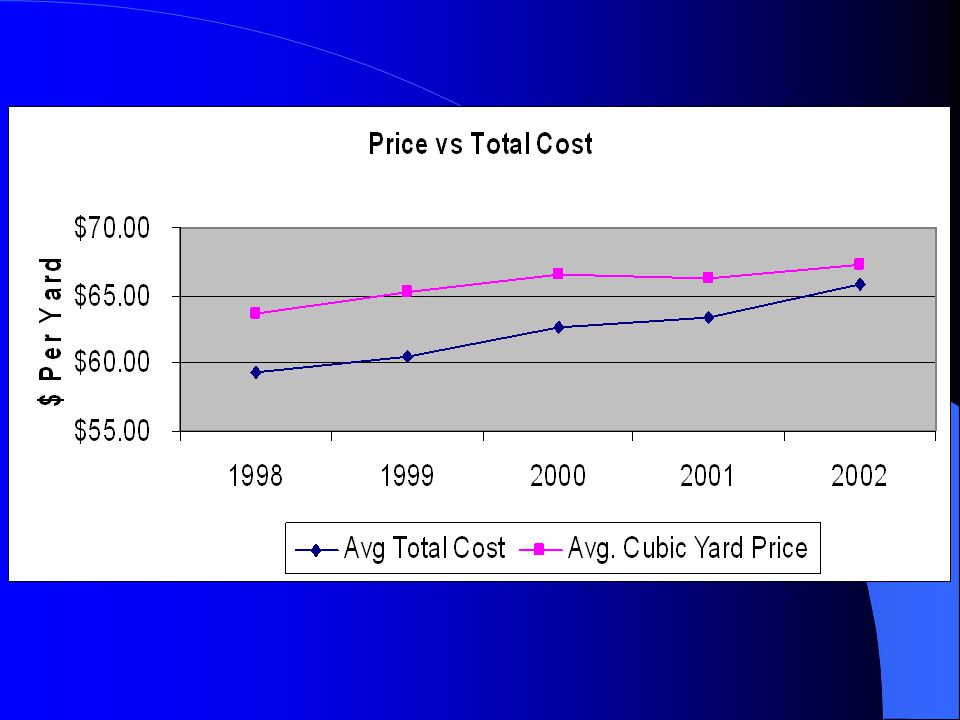
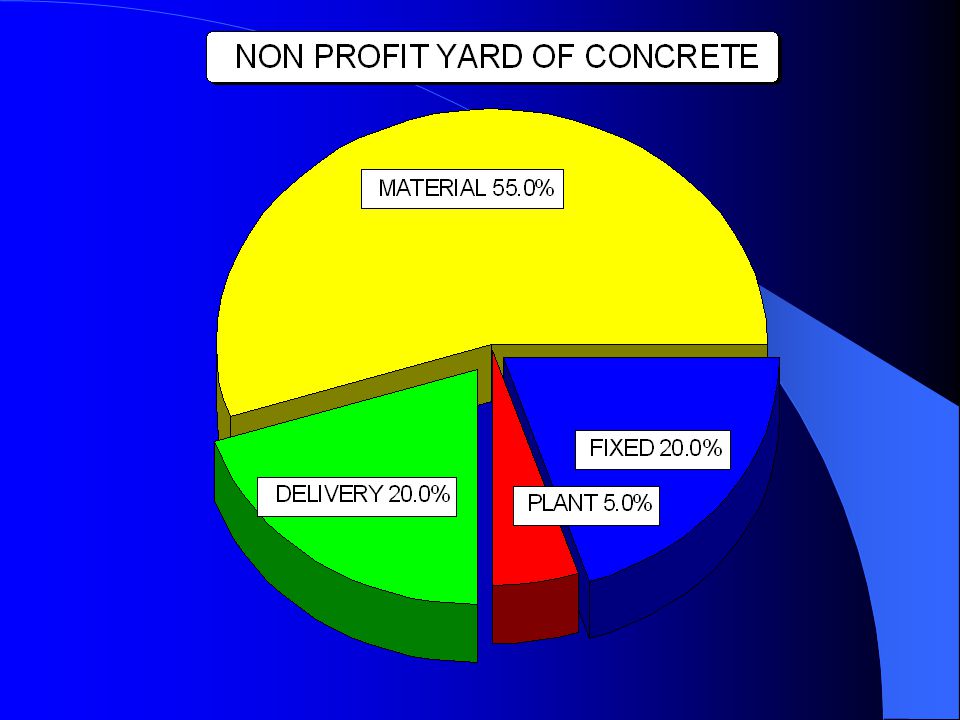
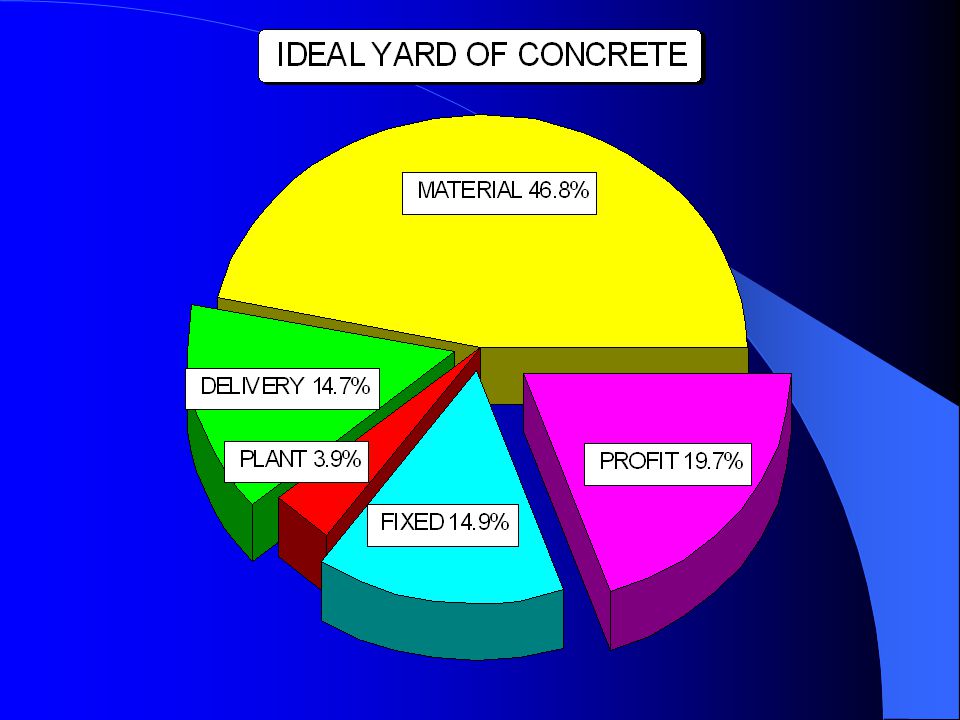
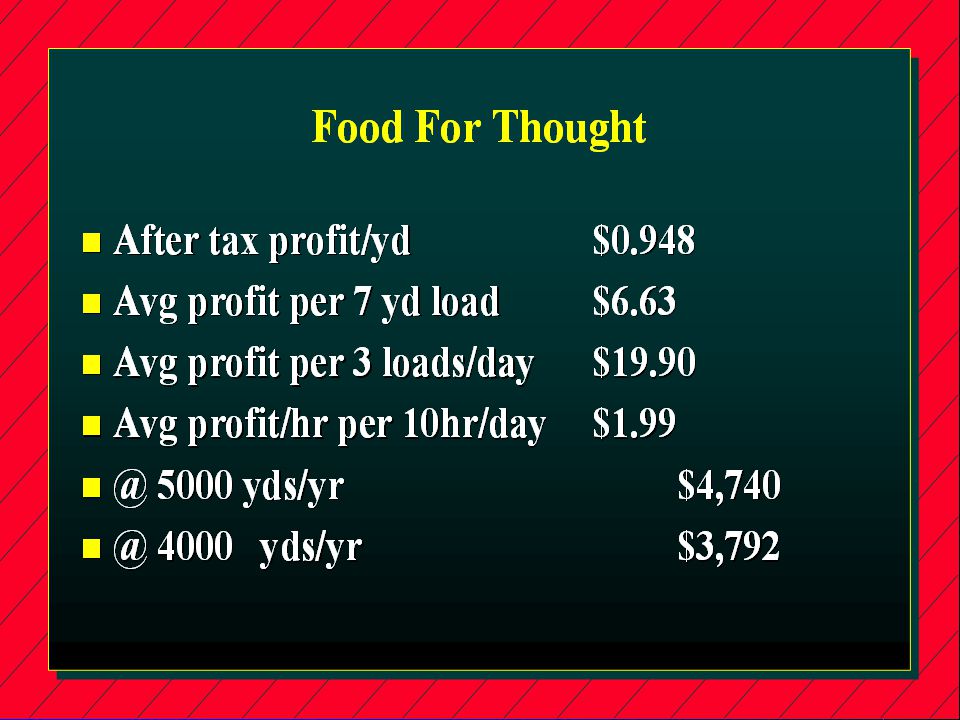
Ready Mixed Concrete Profitability $ Per Yard

12
Growth Comparison YTY % Change

15
Per Capita Consumption of RMC

16
Net Profit as a Percent of Sales by Company Size

17
Chart 7: Return on Net Worth (Equity) (ROE) by Region Net Profit as a Percent of Sales by Region
 (ROE) by Region Net Profit as a Percent of Sales by Region")
18
Return on Assets (ROA) by Company Size
 by Company Size")
19
Return on Assets (ROA) by Regions
 by Regions")
20
Return on Net Worth (Equity) (ROE) by Company Size
 (ROE) by Company Size")
21
Return on Net Worth (Equity) (ROE) by Region
 (ROE) by Region")
42
TABLE 1: Efficiency Ratios by Company Size Item<100K100-299K300-500K>500KTypicalLeader DSO44.955.152.147.348.242.2 Yds/Hour2.22.42.83.23.13.4 Yds/Truck/Yr326845405517583156085989 Sales/Employee154k194k208k233k228k241k VarDel/minute.53.55.59.64.63.67

43
TABLE 2: Efficiency Ratios by Regions ItemNE/MASENCSCGLRMPNWPSWTypicalLeader DSO45.844.428.555.057.557.447.840.448.242.2 Yds/Hour2.72.63.64.12.8 4.54.03.13.4 Yds/Truck/Yr4832575242936423512655384921697356085989 $Sales/Employee236k223k137k217k204k317k194k290k228k241k VarDel/minute.63.45.75.70.68.62.74.86.63.67

44
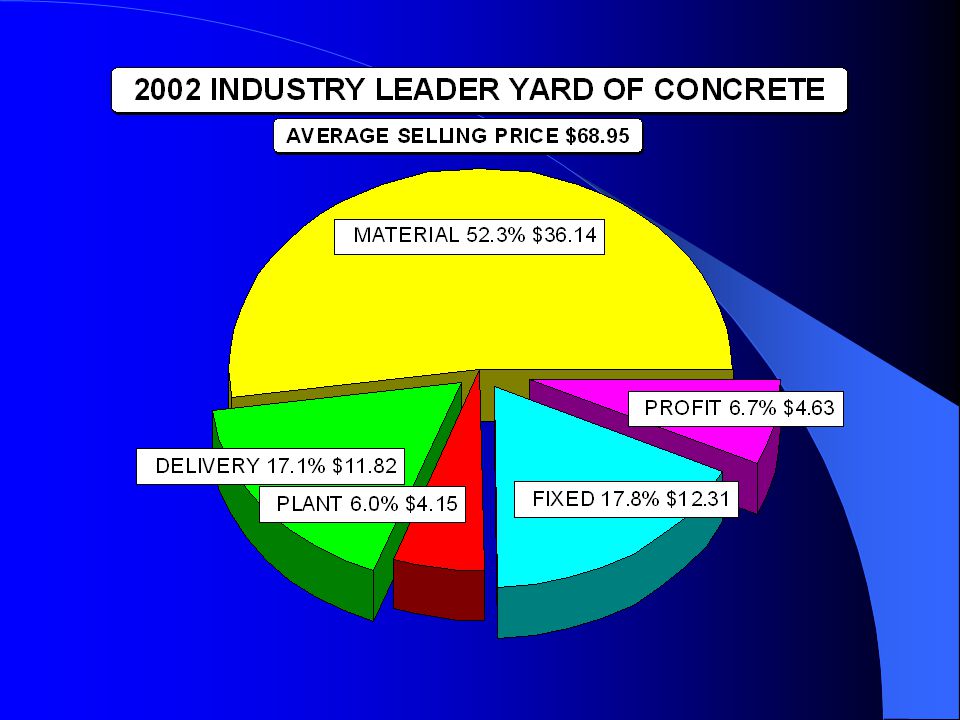
Summary What Can We Do? Compare Strengths & Weaknesses to Peers Improve Your Management Financial Cost Data Know Your Break-even Point Cost Out Jobs Price Jobs Based On A Desired Return

Similar presentations


 n Profitability.>")


>")


>")


