Download presentation
Presentation is loading. Please wait.

2
Statistics and Modelling 3.8 Credits: 4 91580 Internally Assessed

3
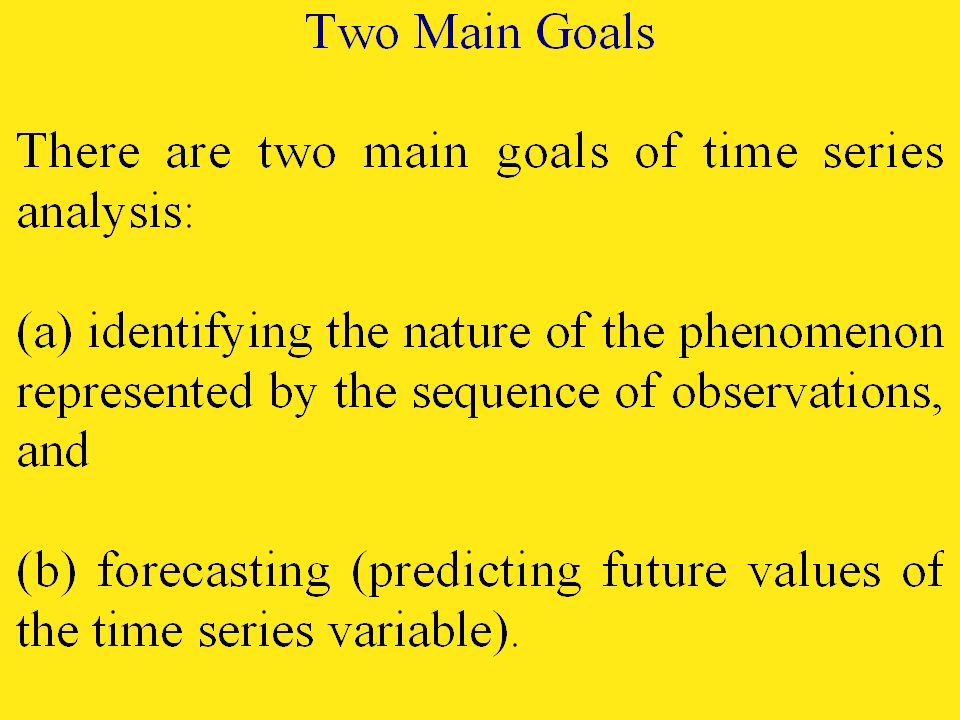
What is time series data? General Introduction In the following topics, we will review techniques that are useful for analyzing time series data, that is, sequences of measurements that follow non-random orders. Unlike the analyses of random samples of observations that are discussed in the context of most other statistics, the analysis of time series is based on the assumption that successive values in the data file represent consecutive measurements taken at equally spaced time intervals.

7
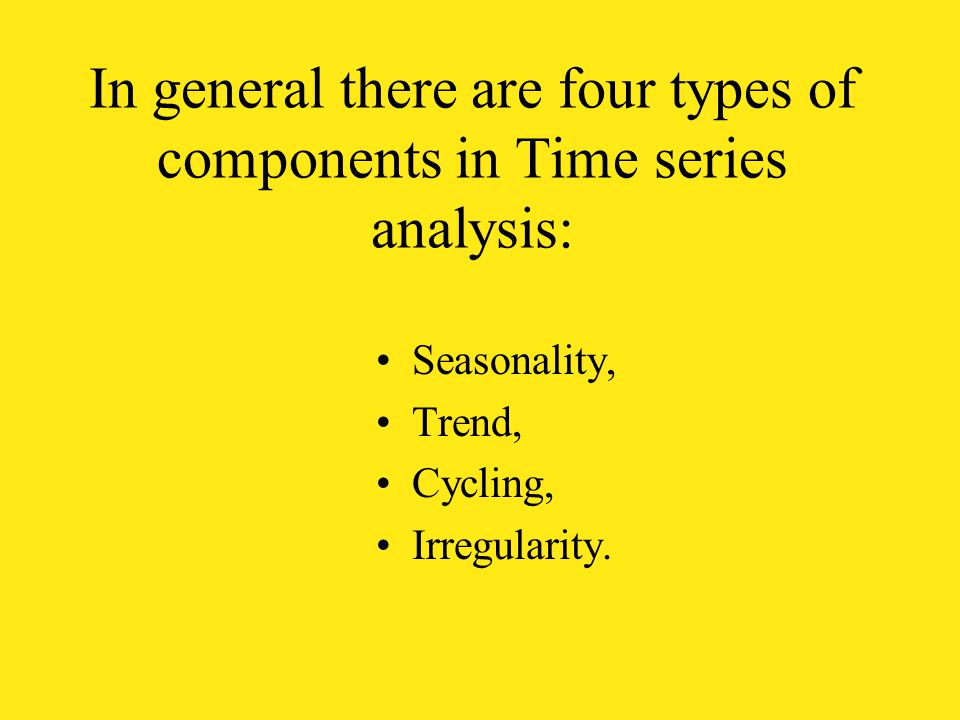
In general there are four types of components in Time series analysis: Seasonality, Trend, Cycling, Irregularity.

8
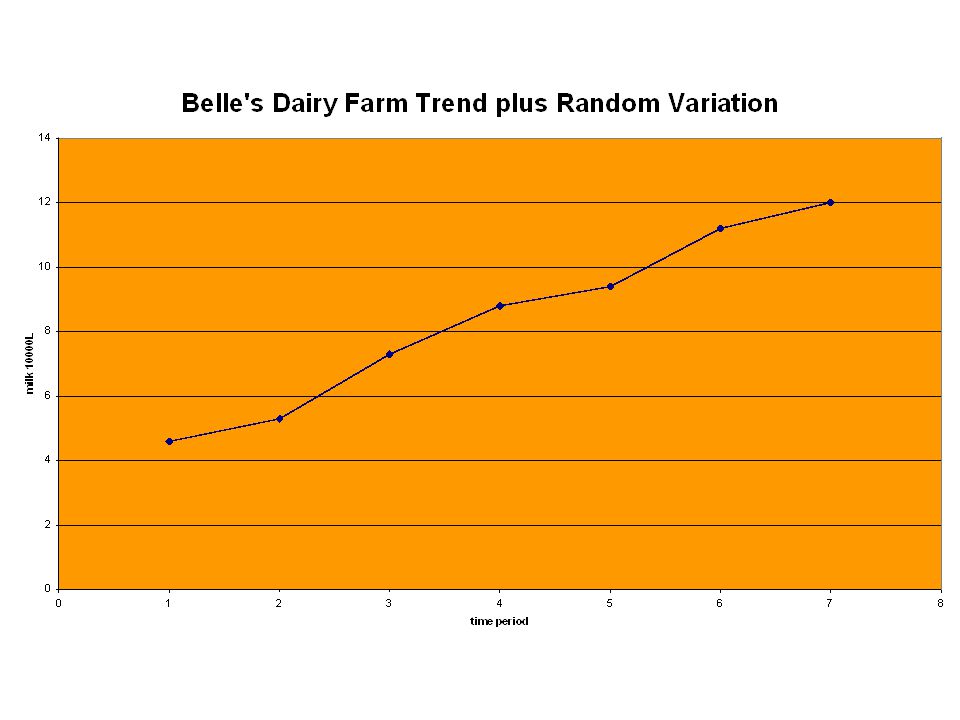
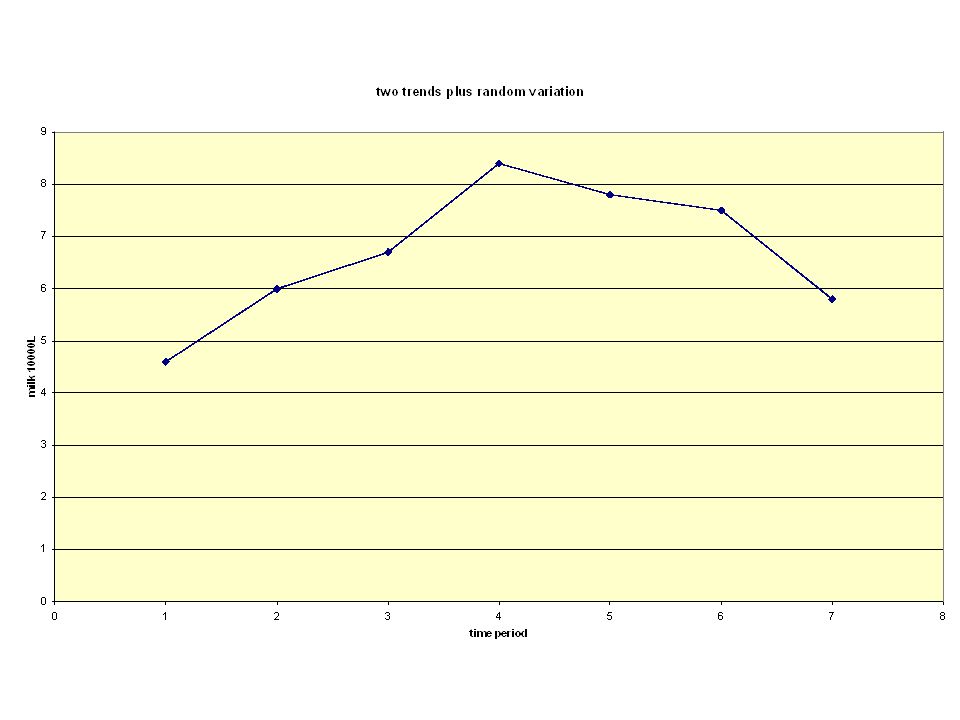
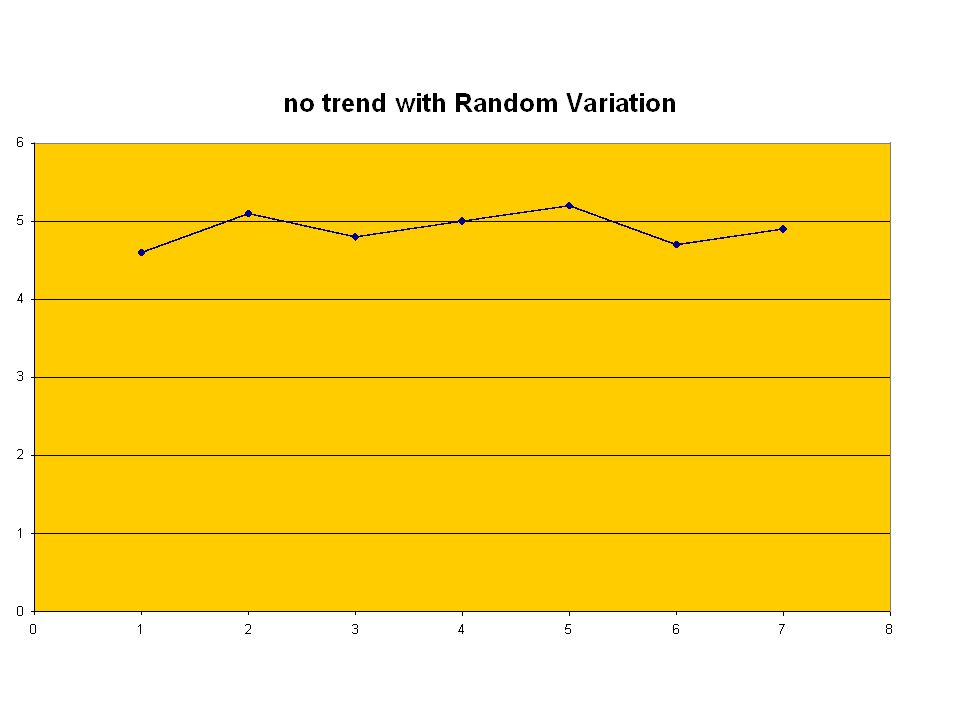
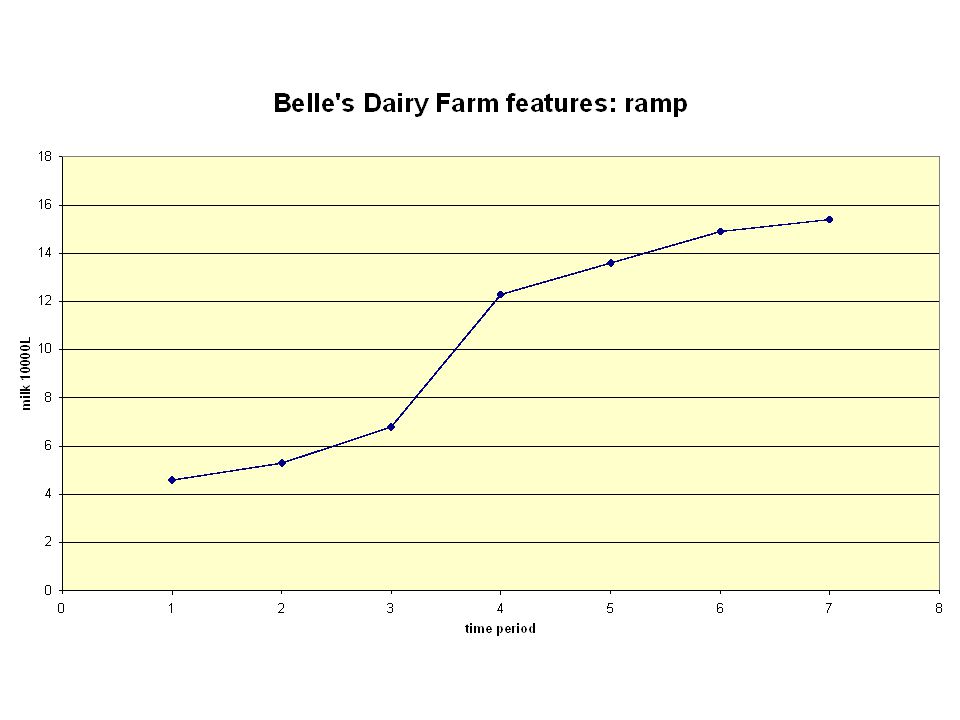
Trend: A time series may be stationary or exhibit trend over time. Long-term trend is typically modelled as a linear, (quadratic or exponential function).
..")
9
Population increases over time price increases over a period of years Production of goods increases over a period of years Upward trends

10
Downward Trends The sales of a commodity may decrease over a period of time because of better products coming on the market.

11
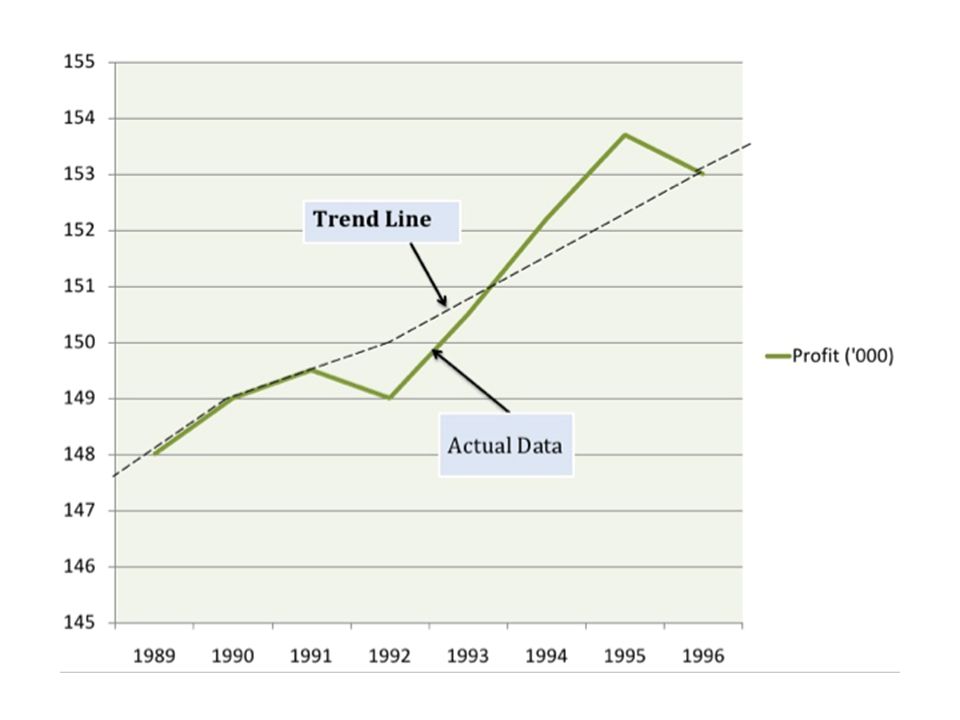
Trend Knowledge of past behaviour Estimation Study of other components

12
Trend estimates reveal the smooth, relatively slowly changing features in a time series. They are usually estimated by applying repeated moving averages.

18
Seasonal variation: When a repetitive pattern is observed over some time horizon, the series is said to have seasonal behaviour. Seasonal effects are usually associated with calendar or climatic changes. Seasonal variation is frequently tied to yearly cycles.

19
Examples Demand for woolen clothes goes up in winter. Spending on credit cards goes up in November/December because of Christmas. Unemployment goes down in March. The main factors are weather conditions and customs of people.

22
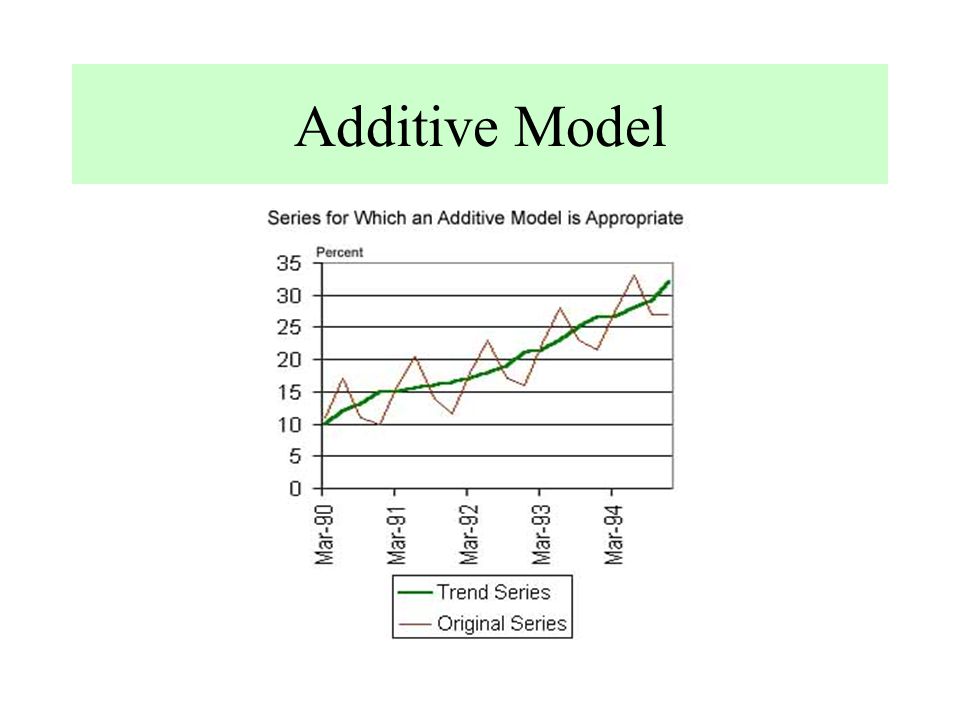
Additive Model

23
Multiplicative Model

24
What is the irregular component? This is the part of the observed value that is not included in the trend cycle or the seasonal effects (or in estimated trading day or holiday effects). Its values are unpredictable as regards timing, impact, and duration.
. Its values are unpredictable as regards timing, impact, and duration..")
25
Also called erratic, random or accidental variations. Do not repeat in a regular pattern. Strikes, famine, war, fire, floods, earthquake. Unpredictable

26
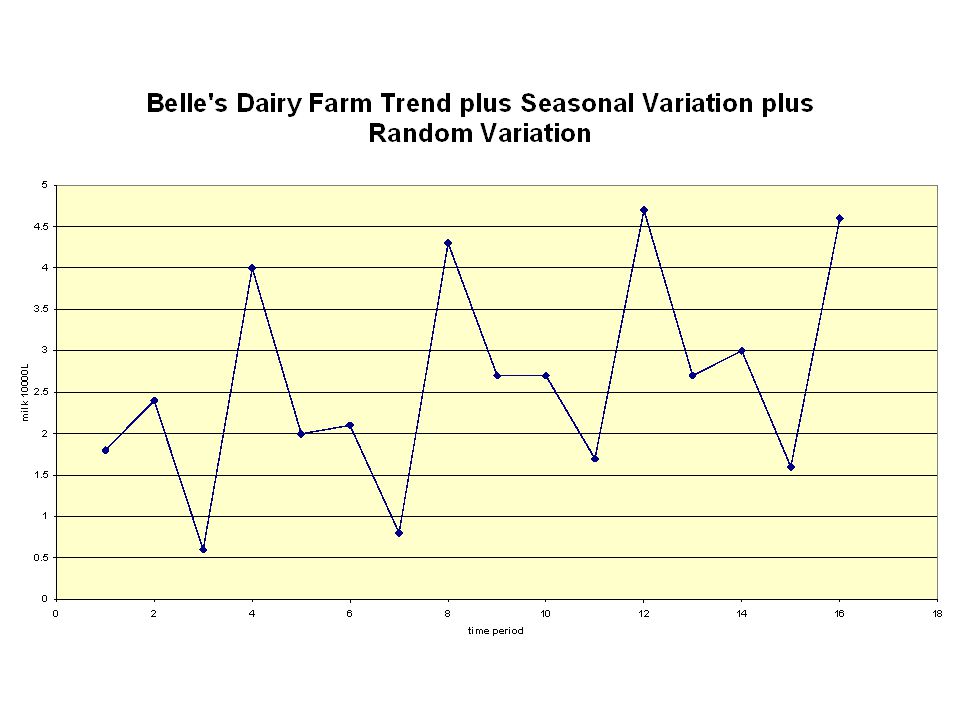
Additive Model A = T + S + C + I Trend + Seasonal Effect + Cycle + Irregularities

27
Multiplicative Model A = T * S * C * I

28
Fortunately, multiplicative models are equally easy to fit to data as additive models! The trick to fitting a multiplicative model is to take logarithms of both sides of the model,

29
After taking logarithms, the four components of the time series again act additively

32
Cyclical variation: An upturn or downturn not tied to seasonal variation. Usually results from changes in economic conditions.

33
Business Cycle Prosperity Decline Depression Recovery

34
Decomposition of a time series Reason for doing this is so we can isolate the influence of each of the components. Decompose to trend Seasonal effects Random variation

Similar presentations


2000 South-Western College Publishing.>")


 Chapter 12 Time-Series Forecasting.>")
