Download presentation
Presentation is loading. Please wait.

1
The All Breast Cancer Report was published in October 2009 http://www.cancerscreening.nhs.uk/ breastscreen/research.html#breast- cancer-report

2
Introduction The ‘All Breast Cancer Report’ brings together information on nearly 50,000 people diagnosed with breast cancer in the UK in 2006. The report analyses the differences in prognosis and clinical outcome for women with breast cancer in relation to route of presentation (i.e. screening or symptomatic), age at diagnosis, tumour characteristics, deprivation status and ethnicity. The NHS Breast Screening Programme audit of screen-detected breast cancers and the Breast Cancer Clinical Outcome Measures (BCCOM) Project which audits symptomatic breast cancers are now well established national audits, but never before have the data included in these audits been analysed as a single cohort with screening and symptomatic breast cancers diagnosed in the UK compared directly. Figure and Table numbers are taken from the ‘All Breast Cancer Report’
, age at diagnosis, tumour characteristics, deprivation status and ethnicity. The NHS Breast Screening Programme audit of screen-detected breast cancers and the Breast Cancer Clinical Outcome Measures (BCCOM) Project which audits symptomatic breast cancers are now well established national audits, but never before have the data included in these audits been analysed as a single cohort with screening and symptomatic breast cancers diagnosed in the UK compared directly. Figure and Table numbers are taken from the ‘All Breast Cancer Report’.")
3
Methodology

4
Data Sources

5
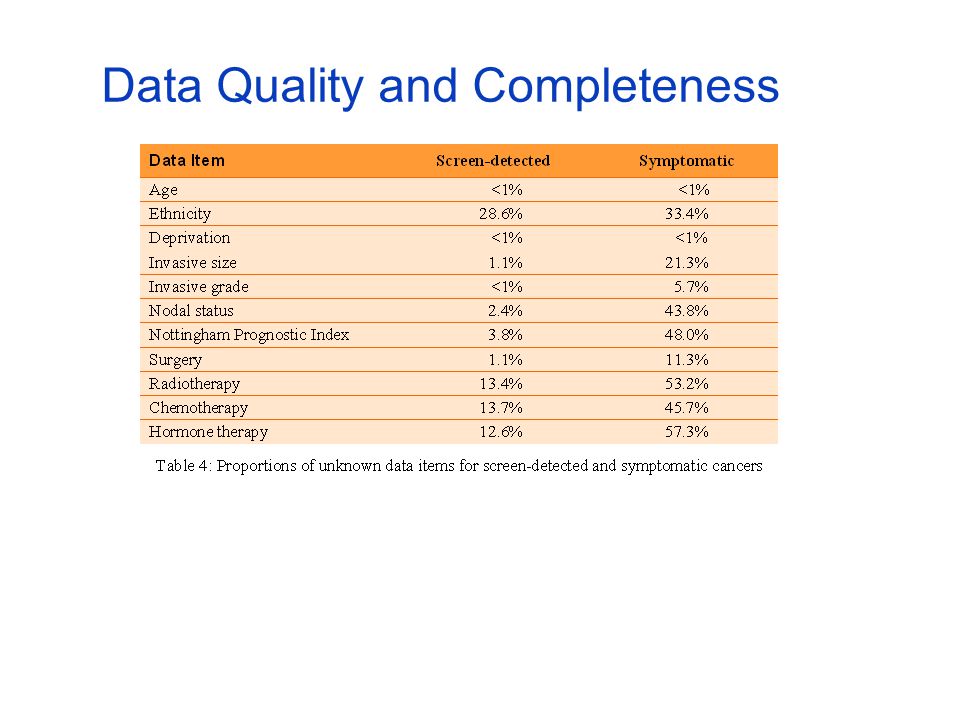
Data Quality and Completeness

7
Cohort Characteristics

8
Age Distribution and Presentation Route Figure 1: UK patients diagnosed with breast cancer in 2006

9
Country Profile and Invasive Status

10
Deprivation and Presentation Route Figure 2: Patients in England diagnosed with breast cancer in 2006

11
Ethnicity and Presentation Route

12
Deprivation and Ethnicity Derived from table in ‘All Breast Cancer Report’

13
Tumour Characteristics

14
Tumour Size and Grade

15
Nodal Status and Receptor Status

16
Nottingham Prognostic Index and Presentation Route NPI = 0.2 X Invasive Size (cm) + Grade + Nodes Groups = Excellent, Good, Moderate 1, Moderate 2, Poor Figure 3: Patients in England diagnosed with breast cancer in 2006
 + Grade + Nodes Groups = Excellent, Good, Moderate 1, Moderate 2, Poor Figure 3: Patients in England diagnosed with breast cancer in 2006")
17
NPI and Ethnicity (all ages) Derived from table in ‘All Breast Cancer Report’
 Derived from table in ‘All Breast Cancer Report’")
18
NPI and Deprivation (all ages) Derived from table in ‘All Breast Cancer Report’
 Derived from table in ‘All Breast Cancer Report’")
19
Surgical Treatment

20
Surgery and Age at Diagnosis Figure 4: Patients in UK diagnosed with breast cancer in 2006

21
Type of Final Operation and Ethnicity Derived from data in ‘All Breast Cancer Report’

22
Type of Final Operation and Deprivation Figure 4: Patients in England diagnosed with breast cancer in 2006

23
Adjuvant Treatment

24
Radiotherapy and Chemotherapy

25
Adjuvant Therapy and Ethnicity and Deprivation Table 17 and Table 19

26
Survival

27
1-year and 5-year Relative Survival

28
Age at Diagnosis and 1-year Relative Survival Figure 6: Patients in England diagnosed with breast cancer in 2001/02 and 2006

29
Relative Survival and Presentation Route and NPI Figure 7: Variation in 1-year survival with presentation route and NPI (50-70 age group)
")
30
Relative Survival, Ethnicity and Deprivation

31
Presentation Route, Relative Survival, Ethnicity and Deprivation Figure 8: Patients in England diagnosed with breast cancer in 2001/02

32
Presentation Route, Relative Survival and Deprivation

Similar presentations


>")


, adults diagnosed 1996-1999, England.>")

 Carolynn Gildea Trent Cancer Registry.>")


 MDT DATA FOR PATIENTS DIAGNOSED in 2009, 2010 and 2011 YSBYTY MAELOR WREXHAM (BCUHB) MDT.>")


