Download presentation
Presentation is loading. Please wait.

1
Geographic Access Gravity Model 1.Statement of Problem (Measurement) 2.The Theory and Method (Potential Accessibility) 3.Applications (Examples -Preliminary Maps) 4.Future Directions (Data & Model Improvements) 5.Feedback from Others (Discussion) 1
 2.The Theory and Method (Potential Accessibility) 3.Applications (Examples -Preliminary Maps) 4.Future Directions (Data & Model Improvements) 5.Feedback from Others (Discussion) 1")
2
The Problem(s) - Measurement How to MEASURE geographic access to health care providers and facilities? The proposed solution - Develop a reliable method to MEASURE (and compare) the distribution of facilities/providers and the population. Reliable MEASUREMENT requires a geographic framework in which to collect and organize observations. 2
 the distribution of facilities/providers and the population. Reliable MEASUREMENT requires a geographic framework in which to collect and organize observations. 2.")
3
The Problem(s) Reliable MEASUREMENT requires a common scale that allows for relative comparison of values. Reliable MEASUREMENT requires a method to handle arbitrary boundaries imposed by a data collection geographic framework. 3

4
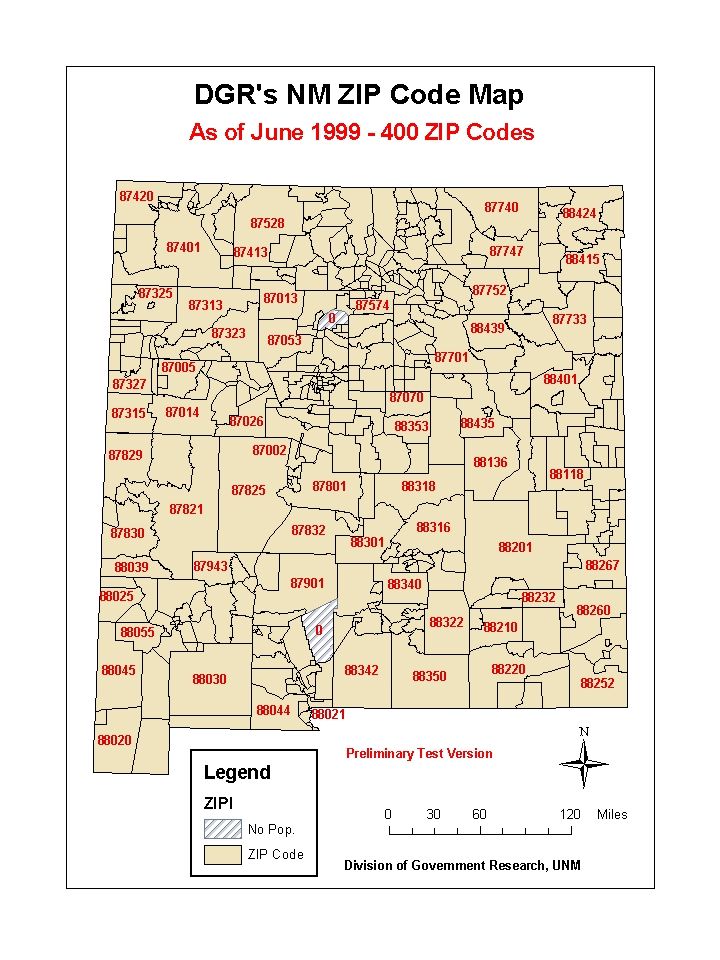
The Geographic Framework - ZIP Codes Health care data (patient, provider, facility, etc.) have many geographic (locational) components. Some geographic components are; geographic coordinates, county, census block and tract, etc.). An address with a ZIP Code is a commonly used geographic component and provides sufficient spatial resolution (many and delineated following population). They are our choice. 4
. An address with a ZIP Code is a commonly used geographic component and provides sufficient spatial resolution (many and delineated following population). They are our choice. 4.")
5
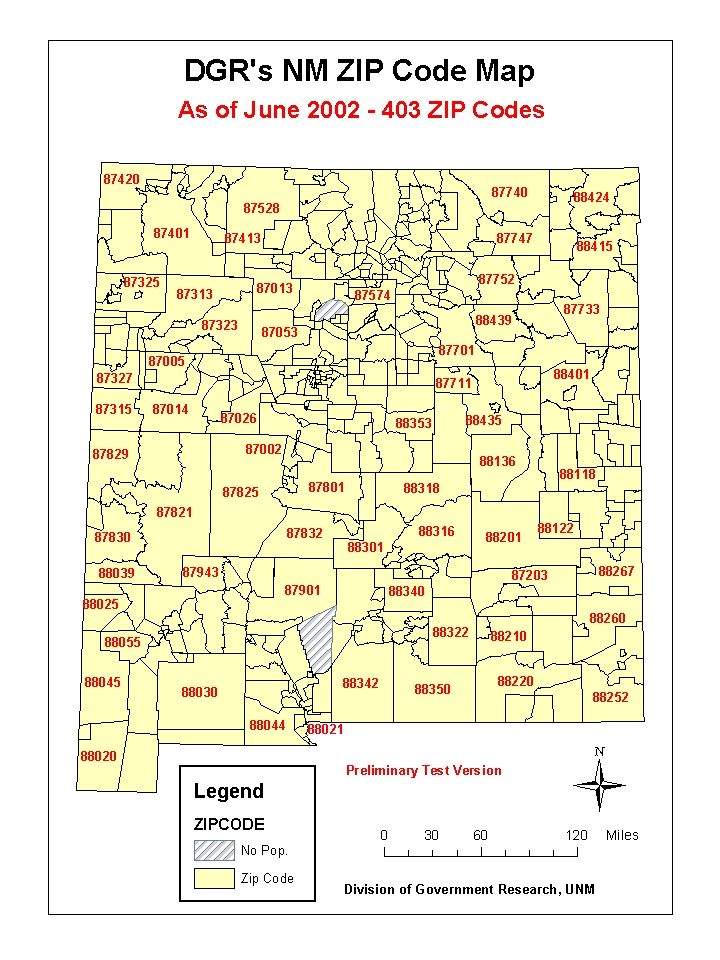
NM ZIP Codes US Postal Service delivery areas. Some ZIP Codes do not have rural delivery and mail is picked up at the Post Office. There can be multiple ZIP Codes per post office (delivery and no delivery). DGR has prepared a ZIP Code base map (coverage) for NM with 400 ZIP Codes for mapping HPC Data (new ZIP Codes are being added - Currently 403). We added (estimated) boundaries for 125 ZIP Codes (USPS review). 5
. DGR has prepared a ZIP Code base map (coverage) for NM with 400 ZIP Codes for mapping HPC Data (new ZIP Codes are being added - Currently 403). We added (estimated) boundaries for 125 ZIP Codes (USPS review). 5.")
9
A Common Measurement Scale Service Capacity Standards (traditional measure - Fed. and State guidelines). Ratio of provider or facilities per population. Can be expressed as either: One M.D. per 1,500 persons (Prov./ Pop.) 1,500 persons per M.D. (POP. / Prov.) What we use. 8
. Ratio of provider or facilities per population. Can be expressed as either: One M.D. per 1,500 persons (Prov./ Pop.) 1,500 persons per M.D. (POP. / Prov.) What we use. 8.")
10
The Boundary Problem Traditional measures (service capacity standards) NOT very good. Problem of arbitrary boundaries. Does NOT consider that people move among communities or political/data collection units to obtain medical services. Nobody pays attention to what ZIP Code their doctor is in. Does NOT consider distance (close or far). 9
. 9.")
12
The Theory Spatial Interaction - The closer together phenomena are the easier it is for interaction to take place and the more similar they are. (Tobler’s Law – 1 st Law of Geography). Spatial Interaction - Assumed to decline with increasing distance. Distance Decay - The result of declining interaction - termed friction of distance. 11
. Spatial Interaction - Assumed to decline with increasing distance. Distance Decay - The result of declining interaction - termed friction of distance. 11.")
13
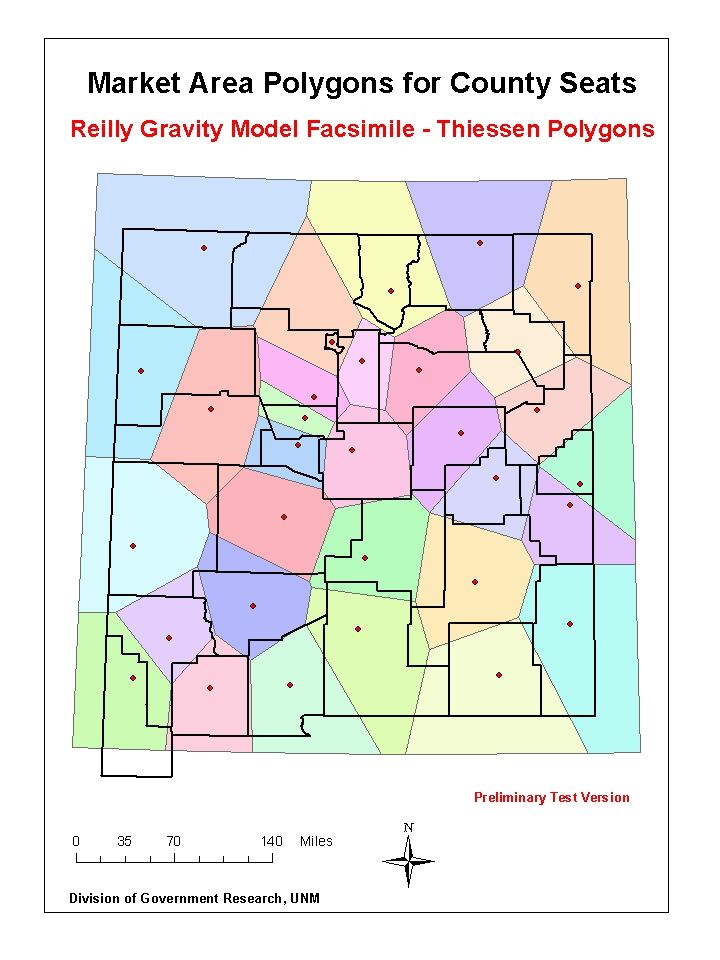
The Method (Spatial Analysis) Gravity Models have been used in economics and social sciences since William Reily (Univ. of Texas) proposed the idea in 1929. Gravity Models have been traditionally used in retail studies, but recently in health care. Gravity Models allow for the measurement of spatial interaction as a function of distance. 12
 proposed the idea in Gravity Models have been traditionally used in retail studies, but recently in health care. Gravity Models allow for the measurement of spatial interaction as a function of distance. 12.")
14
Original (Retail) Gravity Model or Interaction between two areas i and j Population of each area Distance between areas Distance exponent - the higher the greater the friction of distance Market area definition (polygons) 13
 Gravity Model or Interaction between two areas i and j Population of each area Distance between areas Distance exponent - the higher the greater the friction of distance Market area definition (polygons) 13")
16
Potential Accessibility DGR’s Gravity Model PA j = Potential Accessibility for ZIP Code j pop i = Population of ZIP Code i prov i = Number of providers/facilities in ZIP Code i f(d ij ) = 1 for all d ij < 35 f(d ij ) = 1/(d ij - 34) for all 35 < = d ij < = 100 f(d ij ) = 0 for all d ij > 100
 = 1 for all d ij < 35 f(d ij ) = 1/(d ij - 34) for all 35 < = d ij < = 100 f(d ij ) = 0 for all d ij > 100")
17
Distance Decay (Rule-Based Function)
")
18
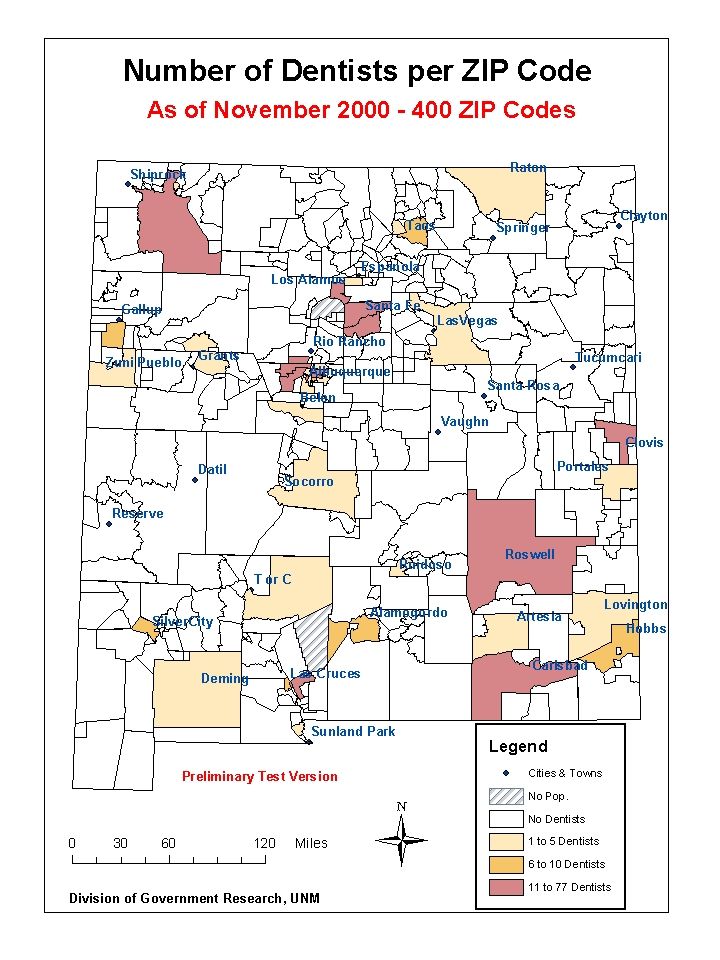
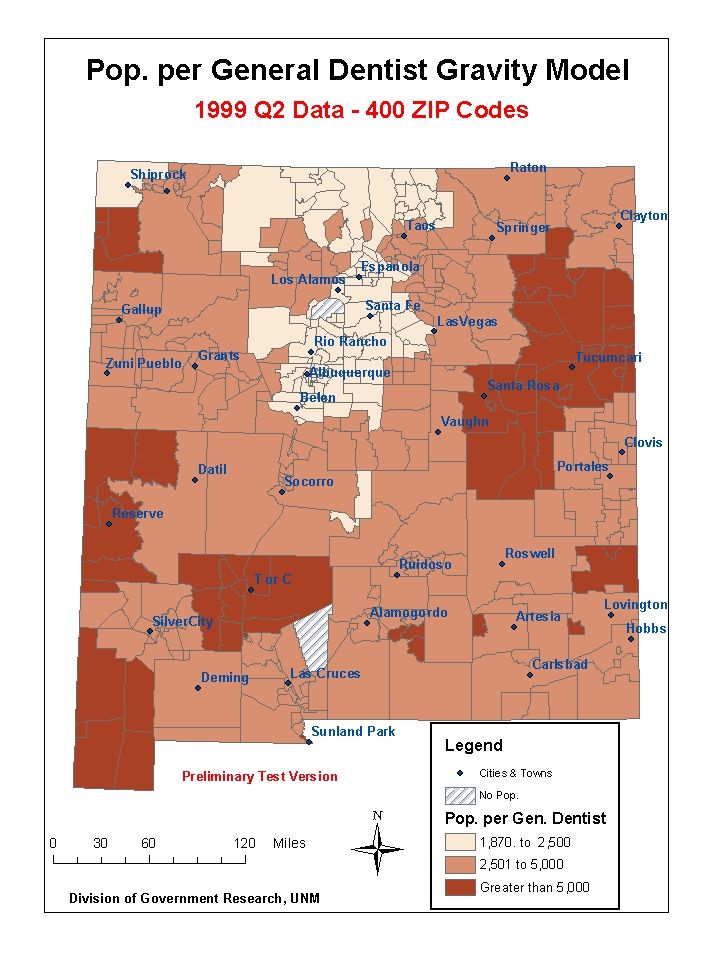
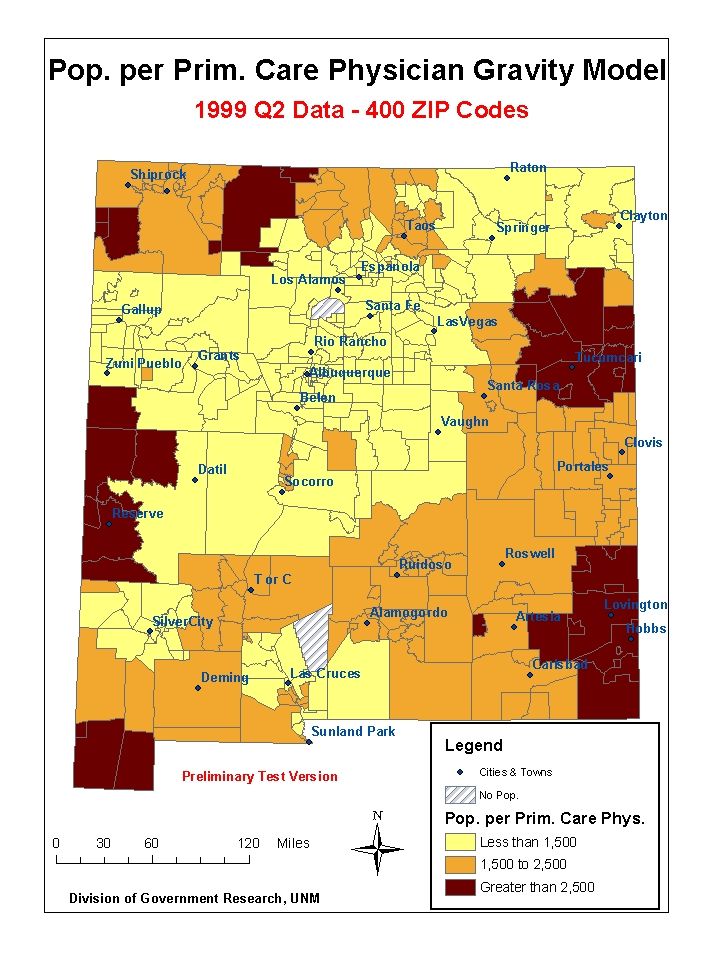
Test Applications Have done initial development and testing. Preliminary survey data used to test gravity model. Also population estimates for ZIP Codes. Test maps for: –Hospital Beds –Primary Care Physicians –Registered Nurses –General Dentists 15

21
Future Directions Use new (improved) data from licensing boards on a quarterly basis. Train HPC staff to use the Excel and SAS based version. Develop with ArcView 3.x and Avenue scripts (was being considered in 1999). Develop a new version using ArcGIS (ArcMap) and ArcObjects (VB/A). Address the “Edge Problem”: -- Peripheral area data (Arizona, Colorado, Texas and Mexico?) 19
. Develop a new version using ArcGIS (ArcMap) and ArcObjects (VB/A). Address the Edge Problem : -- Peripheral area data (Arizona, Colorado, Texas and Mexico ) 19.")
22
Future Directions Enhance gravity model for demographic and risk factor analyses. (multivariate techniques – data available from ESRI BIS/ArcView Business Analyst). Investigate using travel time instead of straight line distance (NM roads Arc/Info network coverage) Review recent literature. Prepare a presentation and publication. 20
. Investigate using travel time instead of straight line distance (NM roads Arc/Info network coverage) Review recent literature. Prepare a presentation and publication. 20.")
23
Questions and Open Discussion 21 Internal Web Page wwwdgr.unm.edu/hpc/hpc_ grav.html Has MORE DETAIL – Was Up to date

Similar presentations


 Overview June 2009.>")


 and Geog. 499 (Python programming) Fall Semester, 2014 Larry.>")


>")


