Download presentation
Presentation is loading. Please wait.

1
Comprehensive Isotopic Composition of Atmospheric Nitrate during CalNex Inferring Sinks and Sources of NO X from Nitrate Stable Isotope Ratios William C. Vicars, Samuel Morin, and Joël Savarino Laboratoire de Glaciologie et Géophysique de l’Environnement Université Joseph Fourier, CNRS, Grenoble, France

2
Stable Isotope Basics Oxygen: 16 O, 17 O, 18 O Nitrogen: 14 N, 15 N Atmospheric nitrate (HNO 3 / NO 3 - ) isotope ratios ( 17 O/ 16 O, 18 O/ 16 O, and 15 N/ 14 N) serve as interpretive tools to quantify NO X sources and removal mechanisms Delta (δ and Δ) values in units of “per mil” (‰) δ 17 O sample = ( 17 O/ 16 O) sample / ( 17 O/ 16 O) standard - 1
 isotope ratios ( 17 O/ 16 O, 18 O/ 16 O, and 15 N/ 14 N) serve as interpretive tools to quantify NO X sources and removal mechanisms Delta (δ and Δ) values in units of per mil (‰) δ 17 O sample = ( 17 O/ 16 O) sample / ( 17 O/ 16 O) standard - 1")
3
Stable Isotope Basics Oxygen: 16 O, 17 O, 18 O Nitrogen: 14 N, 15 N Atmospheric nitrate (HNO 3 / NO 3 - ) isotope ratios ( 17 O/ 16 O, 18 O/ 16 O, and 15 N/ 14 N) serve as interpretive tools to quantify NO X sources and removal mechanisms Delta (δ and Δ) values in units of “per mil” (‰) δ 18 O sample = ( 18 O/ 16 O) sample / ( 18 O/ 16 O) standard - 1
 isotope ratios ( 17 O/ 16 O, 18 O/ 16 O, and 15 N/ 14 N) serve as interpretive tools to quantify NO X sources and removal mechanisms Delta (δ and Δ) values in units of per mil (‰) δ 18 O sample = ( 18 O/ 16 O) sample / ( 18 O/ 16 O) standard - 1")
4
Stable Isotope Basics Oxygen: 16 O, 17 O, 18 O Nitrogen: 14 N, 15 N Atmospheric nitrate (HNO 3 / NO 3 - ) isotope ratios ( 17 O/ 16 O, 18 O/ 16 O, and 15 N/ 14 N) serve as interpretive tools to quantify NO X sources and removal mechanisms Delta (δ and Δ) values in units of “per mil” (‰) δ 15 N sample = ( 15 N/ 14 N) sample / ( 15 N/ 14 N) standard - 1
 isotope ratios ( 17 O/ 16 O, 18 O/ 16 O, and 15 N/ 14 N) serve as interpretive tools to quantify NO X sources and removal mechanisms Delta (δ and Δ) values in units of per mil (‰) δ 15 N sample = ( 15 N/ 14 N) sample / ( 15 N/ 14 N) standard - 1")
5
Stable Isotope Basics Oxygen: 16 O, 17 O, 18 O Nitrogen: 14 N, 15 N Atmospheric nitrate (HNO 3 / NO 3 - ) isotope ratios ( 17 O/ 16 O, 18 O/ 16 O, and 15 N/ 14 N) serve as interpretive tools to quantify NO X sources and removal mechanisms Delta (δ and Δ) values in units of “per mil” (‰) Δ 17 O = δ 17 O - 0.52*δ 18 O
 isotope ratios ( 17 O/ 16 O, 18 O/ 16 O, and 15 N/ 14 N) serve as interpretive tools to quantify NO X sources and removal mechanisms Delta (δ and Δ) values in units of per mil (‰) Δ 17 O = δ 17 O *δ 18 O")
6
The Oxygen Isotope “Anomaly” (Δ 17 O) of Ozone Thiemens, 2006, Annu. Rev. Earth Planet Sci. O 3 tropo. δ 17 O = 0.52*δ 18 O Δ 17 O = 0 Δ 17 O = 20-35 ‰

7
Isotope Transfer During NO X Oxidation NO O3O3 X XO NO 2 RO 2 XO XONO 2 NO 3 N2O5N2O5 O3O3 NO 2 RH OH Nighttime Daytime HNO 3 Lower Δ 17 O Transfer Higher Δ 17 O Transfer time scale: minutes hours to days heterogeneous

8
Δ 17 O of Atmospheric Nitrate as a Useful Tool in Atmospheric Chemistry Morin et al., 2008, Science Seasonal minimum values concurrent with low O 3 (polar day, daytime chemistry) Δ 17 O (NO 3 - ) values higher in winter due to increased interaction with O 3 (polar night) Seasonal maxima reflect interaction of NO x with BrO and are not predicted by O 3 chemistry alone
 Δ 17 O (NO 3 - ) values higher in winter due to increased interaction with O 3 (polar night) Seasonal maxima reflect interaction of NO x with BrO and are not predicted by O 3 chemistry alone")
9
CalNex 2010 High Volume PM sampling 63 sets of samples – coarse and fine fractions (1 μm cut-point) 26 sets from S. Cal. are 12 hour (day and night) collections (May 15 - 28) – daytime vs. nighttime chemistry 34 subsequent sets have lower sampling durations (May 29 - June 7) LA San Francisco San Diego
 collections (May ) – daytime vs. nighttime chemistry 34 subsequent sets have lower sampling durations (May 29 - June 7) LA San Francisco San Diego.")
10
Atmospheric Nitrate Concentration During CalNex LA San Francisco San Diego Ave.Max.Min. Std. Dev. LA 234854754091382 SF 419857178191

11
Air Mass Origins during CalNex

12
O3O3 NONO 2 O 3 and NO X during CalNex

13
Particle Size Distribution of Nitrate LA San Francisco San Diego Ave.Max.Min. Std. Dev. LA- C 186151013301153 LA-F 487280879512 SF-C 2243928797 SF-F 19548142138

14
Oxygen Isotope Anomaly (Δ 17 O) of Atmospheric Nitrate LA San Francisco San Diego Ave.Max.Min. Std. Dev. LA 25.329.221.91.6 SF 21.823.020.51.2

15
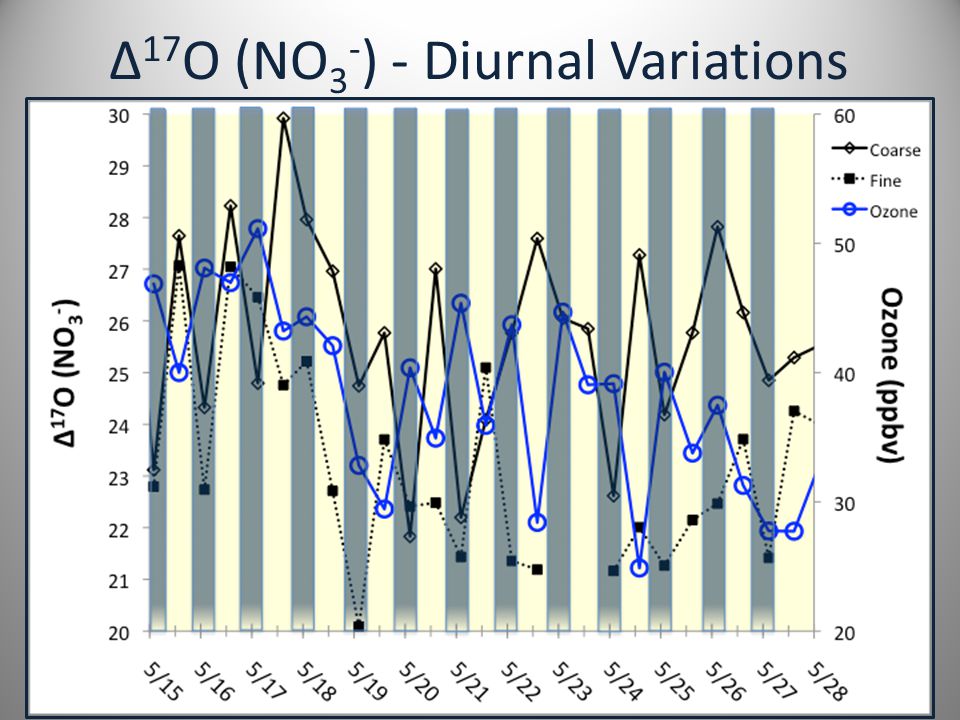
Δ 17 O (NO 3 - ) - Diurnal Variations
 - Diurnal Variations")
17
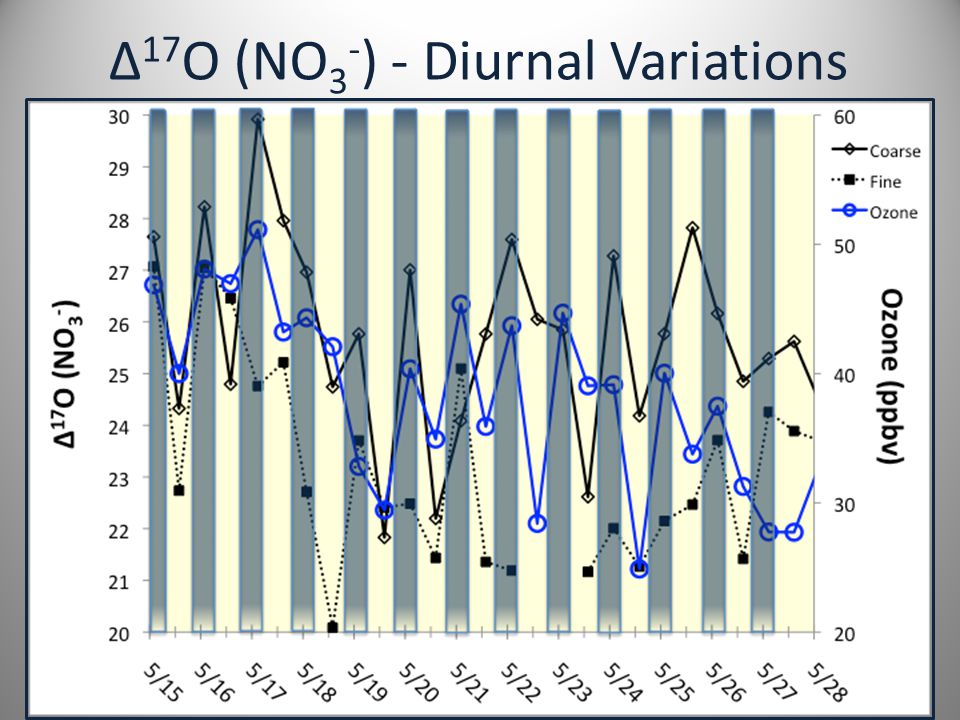
Lifetime Effect of Atmospheric Nitrate Typical atmospheric residence time (τ) of 1 day Function of NO 3 - particle size distribution (i.e., deposition velocity) CalNex May 15-28 samples were collected from approx. 9am - 7pm (“day”) and 7pm - 9am (“night”) Mixing of “daytime” and “nighttime” Δ 17 O signal Morin et al., 2010, EGU Annual Meeting
 and 7pm - 9am ( night ) Mixing of daytime and nighttime Δ 17 O signal Morin et al., 2010, EGU Annual Meeting.")
18
Δ 17 O (NO 3 - ) - Diurnal Variations
 - Diurnal Variations")
20
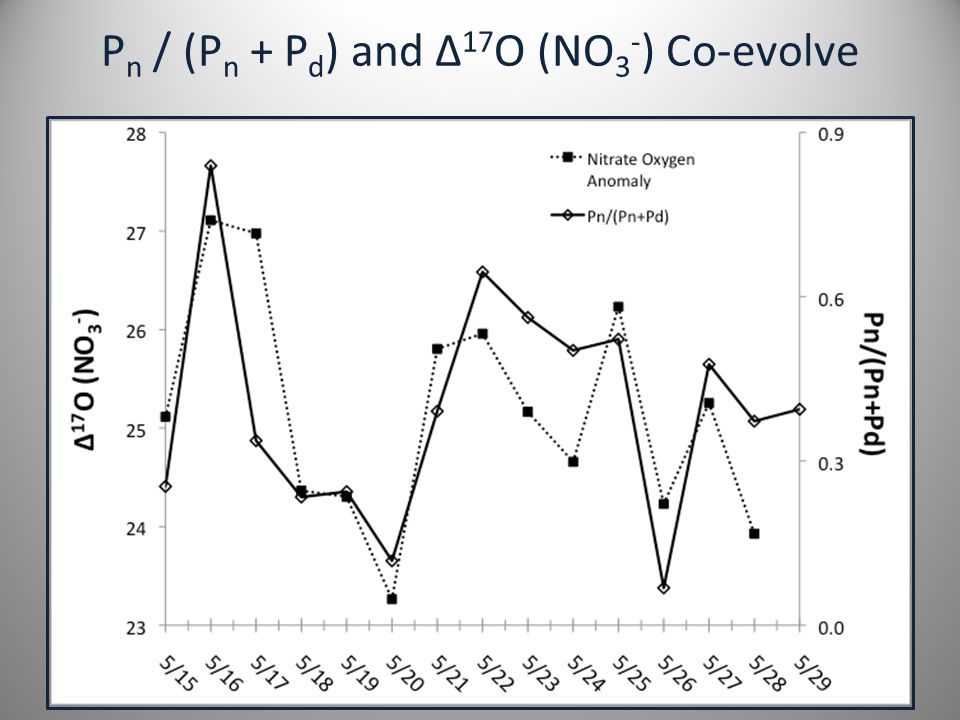
P n and P d A simplified Δ 17 O (NO 3 - ) interpretive framework Based on isotope mass balance, Δ 17 O (NO 3 - ) is expected to be proportional to the the ratio of nighttime to daytime nitrate production P n NO 2 + O 3 NO 3 + O 2 P n α k [NO 2 ] [O 3 ] P d NO 2 + OH HNO 3 P d α k [NO 2 ] [OH] Δ 17 O (NO 3 - ) α P n /(P n + P d ) j(O 3 )
![P n and P d A simplified Δ 17 O (NO 3 - ) interpretive framework Based on isotope mass balance, Δ 17 O (NO 3 - ) is expected to be proportional to the the ratio of nighttime to daytime nitrate production P n NO 2 + O 3 NO 3 + O 2 P n α k [NO 2 ] [O 3 ] P d NO 2 + OH HNO 3 P d α k [NO 2 ] [OH] Δ 17 O (NO 3 - ) α P n /(P n + P d ) j(O 3 )](http://images.slideplayer.com/19/5914201/slides/slide_20.jpg "P n and P d A simplified Δ 17 O (NO 3 - ) interpretive framework Based on isotope mass balance, Δ 17 O (NO 3 - ) is expected to be proportional to the the ratio of nighttime to daytime nitrate production P n NO 2 + O 3 NO 3 + O 2 P n α k [NO 2 ] [O 3 ] P d NO 2 + OH HNO 3 P d α k [NO 2 ] [OH] Δ 17 O (NO 3 - ) α P n /(P n + P d ) j(O 3 )")
21
P n / (P n + P d ) and Δ 17 O (NO 3 - ) Co-evolve
 and Δ 17 O (NO 3 - ) Co-evolve")
23
Towards a Better Understanding of the CalNex Δ 17 O (NO 3 - ) Data P1P1 P2P2 P3P3 NO 2 + OH + M HNO 3 + M NO 2 + O 3 NO 3 + O 2 and NO 3 + RH (DMS) HNO 3 + products NO 2 + NO 3 N 2 O 5 and N 2 O 5 + H 2 O (surface) 2HNO 3(aq) Michalski et al., 2003, Geophys. Res. Lett. Air Mass Chemical Histories 3 days preceding sample collection along air-mass trajectory NO 3 - concentration and residence time (split into size fractions) NO, NO 2, NO 3, N 2 O 5, O 3, HO 2, OH, H 2 O 2 T and P Relative Humidity Agreement between modeled and measured Δ 17 O
 NO, NO 2, NO 3, N 2 O 5, O 3, HO 2, OH, H 2 O 2 T and P Relative Humidity Agreement between modeled and measured Δ 17 O.")
24
δ 15 N and NO X Source Apportionment δ 15 N of atmospheric NO 3 can help elucidate sources of NO X to the atmosphere, but the data is often difficult to interpret – fuel combustion: 6-13 ‰ – soil (biological): < -20 ‰ – lightning: ≈ 0 ‰ Differences in δ 15 N between coarse and fine particles may be useful diagnostic tools δ 15 N sample = ( 15 N/ 14 N) sample / ( 15 N/ 14 N) standard - 1
: < -20 ‰ – lightning: ≈ 0 ‰ Differences in δ 15 N between coarse and fine particles may be useful diagnostic tools δ 15 N sample = ( 15 N/ 14 N) sample / ( 15 N/ 14 N) standard - 1")
25
δ 15 N of Atmospheric Nitrate LA San Francisco San Diego Ave.Max.Min. Std. Dev. LA 0.28.0-4.63.5 SF -0.61.8-6.23.7

26
Average Difference = 2.3 (± 1.5) δ 15 N (NO 3 - ): Coarse vs. Fine Particles 13% Average Difference = 2.7 (± 1.8) 27%
 27%.")
27
Summary Variations in Δ 17 O (NO 3 - ) during CalNex are a function of the relative importance of “daytime” (P 1 ) and “nighttime” (P 2 and P 3 ) reaction mechanisms Offset in data due to residence time effect of NO 3 - A more thorough interpretation of the atmospheric Δ 17 O (NO 3 - ) signal will require detailed modeling of the dominant reaction mechanisms Potential for collaboration, joint publications, etc.
 during CalNex are a function of the relative importance of daytime (P 1 ) and nighttime (P 2 and P 3 ) reaction mechanisms Offset in data due to residence time effect of NO 3 - A more thorough interpretation of the atmospheric Δ 17 O (NO 3 - ) signal will require detailed modeling of the dominant reaction mechanisms Potential for collaboration, joint publications, etc.")
28
Summary Small differences in δ 15 N between coarse and fine particles suggest a common source of NO X in both size fractions Different reaction mechanisms (P 1, P 2, P 3 ) leading to NO 3 - formation are sensitive to particle size Higher δ 15 N in S. Cal. May reflect greater contribution of NO X from fuel combustion The higher Δ 17 O (NO 3 - ) for the samples collected near Los Angeles may be due to the greater abundance of coarse particle mass Greater HNO 3 production via N 2 O 5 hydrolysis in coarse particles?
 for the samples collected near Los Angeles may be due to the greater abundance of coarse particle mass Greater HNO 3 production via N 2 O 5 hydrolysis in coarse particles .")
29
Thank You!

30
δ 18 O and δ 17 O Δ 17 O = δ 17 O - 0.52*δ 18 O = 0 slope = 0.52 Terrestrial Fractionation Line For most oxygen-bearing compounds: δ 17 O = 0.52*δ 18 O

31
The Oxygen Isotope “Anomaly” (Δ 17 O) of Ozone For Ozone (O 3 ): δ 17 O ≠ 0.52*δ 18 O Δ 17 O = δ 17 O - 0.52*δ 18 O = 20-35 ‰ Thiemens, 2006, Annu. Rev. Earth Planet Sci.

32
Isotope Transfer During NO X Oxidation NO 2 + O 3 NO 3 + O 2 N 16 O 18 O + 16 O 18 O 17 O N 16 O 18 O 17 O + 16 O 18 O For Atmospherically-Derived Nitrate (NO 3 - ): Δ 17 O = δ 17 O - 0.52*δ 18 O = 20-30 ‰ (tropospheric O 3 ), 30-40 ‰ (statospheric O 3 ) Important nighttime NO 2 removal mechanism
: Δ 17 O = δ 17 O *δ 18 O = ‰ (tropospheric O 3 ), ‰ (statospheric O 3 ) Important nighttime NO 2 removal mechanism")
33
δ 15 N (NO 3 - ) - Diurnal Variations
 - Diurnal Variations")
Similar presentations


 of atmospheric nitrate Becky Alexander*, Meredith.>")


