Download presentation
Presentation is loading. Please wait.

1
Stem & Leaf diagrams Here are the results that 20 students achieved in a science test. 54 75 63 80 63 77 78 86 72 62 87 66 93 56 80 86 51 78 42 45 Task: Put these numbers in order.

2
Stem & leaf diagram 4 2 5 5 1 4 6 6 2 3 3 6 7 2 5 7 8 8 8 0 0 6 6 7 9 3 Key: 9 3 means ?

3
Stem & leaf diagram 4 2 5 5 1 4 6 6 2 3 3 6 7 2 5 7 8 8 8 0 0 6 6 7 9 3 This part is called the stem This part is called the leaf Key: 9 3 means 93

4
Stem & leaf diagram 4 2 5 5 1 4 6 6 2 3 3 6 7 2 5 7 8 8 8 0 0 6 6 7 9 3 This part is called the stem This part is called the leaf Key: 9 3 means 93

5
Stem and leaf diagrams are useful because they give you an overall picture of your original data showing the shape of the distribution. We can also use them to work out the median and mode

6
Draw a stem & leaf diagram to show the following data. The weight of 15 footballers are show as follows. (The weights are in KG) 67, 58, 85, 88, 77, 90, 75, 82, 85 65, 69, 70, 71, 76, 64
 67, 58, 85, 88, 77, 90, 75, 82, 85 65, 69, 70, 71, 76, 64.")
7
Stem & leaf diagram 5 8 6 4 5 7 9 7 0 1 5 6 7 8 2 5 5 8 9 0

8
These are the times which a team of mechanics take to change the tyres at a pit stop in a Grand Prix. 8.2 7.6 5.7 6.3 4.9 6.6 7.8 6.2 5.3 7.4 5.1 6.5

9
Stem & leaf diagram 4 9 5 1 3 7 6 2 3 5 6 7 4 6 8 8 2 Key: 4 9 means 4.9

10
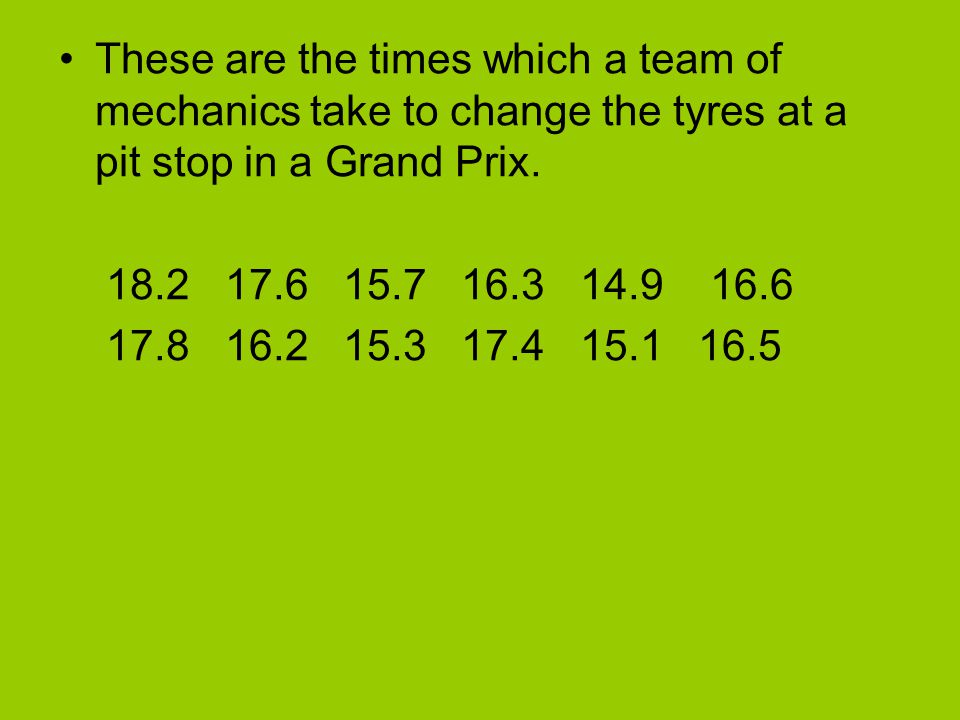
These are the times which a team of mechanics take to change the tyres at a pit stop in a Grand Prix. 18.2 17.6 15.7 16.3 14.9 16.6 17.8 16.2 15.3 17.4 15.1 16.5
11
Stem & leaf diagram 14 9 15 1 3 7 16 2 3 5 6 17 4 6 8 18 2 Key: 14 9 means 14.9

12
A STEM & LEAF DIAGRAM Below are the ages of forty motorists entered for a driving competition, shown in a stem and leaf diagram: 05 19 28869269 384587957786352693 441655 5259 661320 7 81 Represents 81 years (this is the scale)
")
13
BACK-TO-BACK STEM & LEAF DIAGRAM Here are the weights of students from two different tutor groups 9517 2602358 5307125667 97511835 862192

14
Coursework – Word lengths Word LengthFrequency 06 6 6 6 4 0 0 1 1 1 1 7 7 7 7 7 8 8 9 9 0 0 0 1 2 3 8 6 75 8 0 92 10 3 112 122 131

15
06 6 6 6 0 0 1 1 1 1 7 7 7 7 7 8 8 9 9 0 0 0 1 2 3 0 Coursework – Word lengths What is the median? What is the mode?

Similar presentations


 Statistics Tests are to be carried out on a new type of chicken food to see if the new food significantly increases the.>")


