Download presentation
Presentation is loading. Please wait.

1
Catalyst – August 3 3, 2010 FUN GRAPH FRIDAY! HW OUT! 1.What conclusions can you draw from this graph? FYI: The Gallup and Pew polls are surveys that ask people how they feel about politicans

2
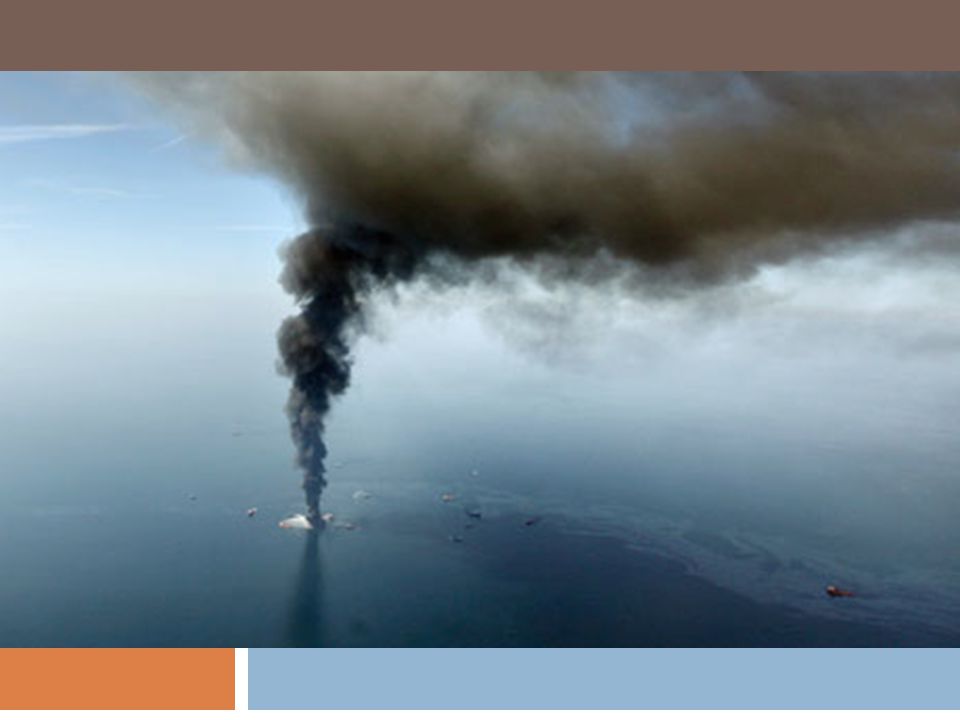
Today’s Agenda Catalyst 2010 Deepwater Horizon Catastrophe – gonna spill some knowledge on ya! Lab Group of the Week! Exit Question FINISH LAB OVER THE WEEKEND IF YOU DON’T FINISH IN CLASS!

3
Today’s Objectives SWBAT explain why the Deepwater Horizon oil spill is so difficult to clean.

7
ABC News http://abcnews.go.com/Blotter/deepwater-horizon- survivors-abc-news-alarm-sounded- blast/story?id=10578389

13
2010 Gulf Oil Spill – Introduction Quick facts British Petroleum (BP) station Deepwater Horizon drilling rig 400 feet long, 250 feet wide Explosion while drilling at depth of 5,000 feet 11 presumed dead Estimated 210,000-1.1 million gallons spilled PER DAY Likely to become the worst oil spill in history
 station Deepwater Horizon drilling rig 400 feet long, 250 feet wide Explosion while drilling at depth of 5,000 feet 11 presumed dead Estimated 210, million gallons spilled PER DAY Likely to become the worst oil spill in history")
14
Open Ocean Oil travels Spreads naturally across the top of water (less dense) Changes direction due to waves, wind, current, tide Potentially large contamination area
 Changes direction due to waves, wind, current, tide Potentially large contamination area")
15
Timeline http://en.wikipedia.org/wiki/Timeline_of_the_Dee pwater_Horizon_oil_spill

16
April 2010 April 1 – Haliburton employee Marvin Volek warns that BP's use of cement "was against our best practices." April 6 - MMS issues permit to BP for the well with the notation, "Exercise caution while drilling due to indications of shallow gas and possible water flow.“ April 14 - Brian Morel, a BP drilling engineer, emails a colleague "this has been a nightmare well which has everyone all over the place."

17
April 20, 2010 – Catastrphe 7 am - BP cancels a recommended cement bond log test. Conducting the test would have taken 9–12 hours and $128,000. By canceling the cement test BP paid only $10,000. Crew leaves on 11:15 am flight. BP officials gather on the platform to celebrate seven years without an injury on the rig. The planned moving of the Deepwater Horizon to another location was 43 days past due and the delay had cost BP $21 million. 9:45 p.m. Gas, oil and concrete from the Deepwater Horizon explode up the wellbore onto the deck and then catches fire. The explosion kills 11 platform workers and injures 17 others; another 98 people survive without serious physical injury.

18
April 21-22, 2010 – The Days After April 21 - Coast Guard log reports “Potential environmental threat is 700,000 gallons of diesel on board the Deepwater Horizon and estimated potential of 8,000 barrels per day of crude oil, if the well were to completely blowout. Most of the current pollution has been mitigated by the fire.” April 22 - 10:21 am - Rig sinks April 27 - Slick grows to 100 miles (160 km) across and 20 miles (32 km) from Louisiana coast April 29 - Louisiana Governor Bobby Jindal declares a state of emergency.
 across and 20 miles (32 km) from Louisiana coast April 29 - Louisiana Governor Bobby Jindal declares a state of emergency..")
19
May 2010 May 2 - Obama meets with fishermen and Coast Guard in Venice, LA. Oil discovered in the South Pass. Transocean's Development Driller III starts drilling a first relief well. May 9 - Tar balls reported on Dauphin Island in Alabama. May 12 - BP releases first public video of leak and others say the leak is significantly higher than what BP has been saying. May 19 - Oil washes ashore on mainland Louisiana. May 26 - BP announces plan to force feed heavy drilling mud in a project called "top kill.”

20
June 2010 June 5 - Obama makes third trip to Louisiana since the disaster began visits Grand Isle, Louisiana for the second time in two weeks. June 25 - Hurricane Alex causes relief rigs to disconnect and let the oil spill unchecked into the ocean.

21
August 2010 August 2 - Reports that the well initially was dumping 62,000 barrels of oil per day initially after the spill and that it dwindled to 53,000 barrels when it was capped as the well was depleted. This means that 4.9 million barrels were dropped into the Gulf. August 2- Environmental Protection Agency releases a study of eight dispersants which concludes that Corexit 9500 "is generally no more or less toxic than mixtures with the other available alternatives" and that "dispersant-oil mixtures are generally no more toxic to the aquatic test species than oil alone.“ August 4 - BP reports that the well achieved “static condition” shortly after midnight after drilling mud is said to now fill the well.

22
Lab! Read ALL directions BEFORE beginning lab Fill in “Materials” and “Safety Methods” sections BEFORE beginning lab Work together in an efficient manner Answer Lab Questions throughout lab Clean up when done Finish Post-Lab Questions for homework over the weekend (if needed)
.")
23
Lab Review Difficult to mechanically separate oil from water As you saw in lab We also use chemicals (“dispersants”) and bacteria to break up and degrade the oil May not be effective depending on type of oil, length of time since spill Chemicals that only break up the oil don’t actually get rid of it… they just spread it out As you saw in lab
 and bacteria to break up and degrade the oil May not be effective depending on type of oil, length of time since spill Chemicals that only break up the oil don’t actually get rid of it… they just spread it out As you saw in lab")
24
Conclusion Can I get a volunteer to remind the class… What was the cause of the Deepwater Horizon (DWH) oil spill? Why can the DWH not be easily shut off? What makes oil spills difficult to clean up, in general? What are impacts of oil spills on The Gulf Coast environment? People living along the Gulf Coast? People living in the rest of the country?

25
Exit Question Describe three reasons why it is difficult to clean up the Deepwater Horizon oil spill. Leave your lab report in the folder IF IT IS FINISHED or finish over the weekend!

Similar presentations


 Covered 68,000 square miles (as a comparison, the state of Colorado is.>")


 Case Study The Deepwater Horizon Accident: What Happened and Why? BY Haitham muhsen: hxm142930@utdallas.edu CS/SE 6361 Executive.>")


>")


