Download presentation
Presentation is loading. Please wait.

1
CDAE 272 International Economic Development Spring 2008

2
Class 16 March 20 Last class Midterm exam Today: Result of the midterm exam 4. International trade theories Next class : 4. International trade theories Group projects Reading: Chapter 4: International trade theories

3
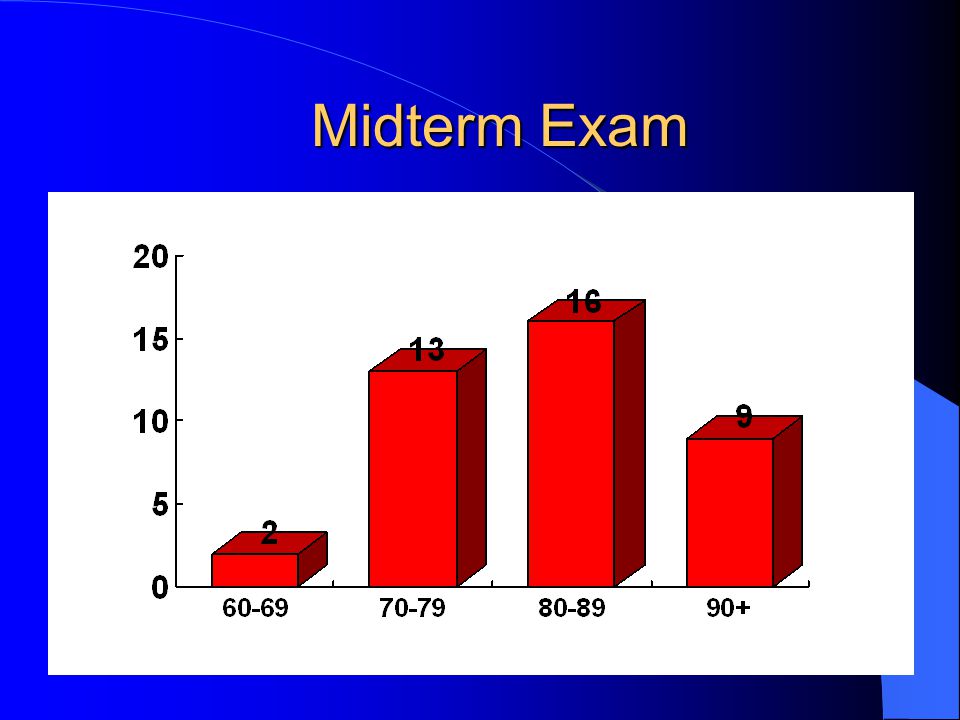
Result of the midterm exam N = 40 Range = 64 - 99 Average = 81.5

4
Midterm Exam

6
Midterm exam How did I grade your exam? Question by question (not student by student) Partial credit for multiple choice questions Partial credit for other questions and problems Comments on selected questions: B3 and B4: GDP and GNP B5: per capita PPP B6: reasons for the increase in U.S. trade deficit C1: ES and ED functions (see Quiz) C4: Applications of PPP: see quiz and class exercises C5: calculate the tax rate
 Partial credit for multiple choice questions Partial credit for other questions and problems Comments on selected questions: B3 and B4: GDP and GNP B5: per capita PPP B6: reasons for the increase in U.S. trade deficit C1: ES and ED functions (see Quiz) C4: Applications of PPP: see quiz and class exercises C5: calculate the tax rate.")
7
Midterm exam Factors for the variation in midterm exam scores: Attitude and preparation: Did you study for the exam? Did you review each quiz? Did you review each exercise? Did you pick up your quizzes and problem sets? Correlation between quiz scores and exam score Class attendance Problem sets Suggestions:

8
Midterm Exam and Quizzes 1-4

9
4. International trade theories 4.1. Simple examples: two-person cases 4.2. Absolute and comparative advantages 4.3. Trade between two countries 4.4. The sources of comparative advantage 4.5. Other explanations for international trade 4.6. Trade between two nations 4.7. Measurement of the gains from trade 4.8. Exchange rate and its determination

10
4.3. Trade between two countries 4.3.1. Wheat and cotton production in Australia and New Zealand (Table 16.2 on p. 3-4) New ZealandAustralia Wheat 6 bu./acre 2 bu./acre Cotton 2 bales/acre6 bales/acre 4.3.2. Absolute advantage Australia: Cotton production New Zealand: Wheat production 4.3.3. Production with no trade (Table 16.3 on p. 3-4) -- How to interpret Figure 16.1 on p. 3-5? -- Production possibility frontier (PPF)
 New ZealandAustralia Wheat 6 bu./acre 2 bu./acre Cotton 2 bales/acre6 bales/acre Absolute advantage Australia: Cotton production New Zealand: Wheat production Production with no trade (Table 16.3 on p. 3-4) -- How to interpret Figure 16.1 on p Production possibility frontier (PPF).")
11
4.3. Trade between two countries 4.3.4. Gains from specialization and trade ( Table 16.4 ) When both countries have absolute advantages, specialization and trade can benefit both nations A strong assumption here: 1 bushel of wheat can be exchanged for 1 bale of cotton How to interpret Figure 16.2 on page 3.6?
 When both countries have absolute advantages, specialization and trade can benefit both nations A strong assumption here: 1 bushel of wheat can be exchanged for 1 bale of cotton How to interpret Figure 16.2 on page")
12
4.3. Trade between two countries 4.3.5. Suppose the wheat and cotton productivity in Australia and New Zealand has changed to: New ZealandAustralia Wheat 6 bu./acre 1 bu./acre Cotton 6 bales/acre3 bales/acre 4.3.6. New Zealand has the absolute advantage in both wheat and cotton production (Australia does not have any absolute advantage) but Australia has the comparative advantage in cotton production (what comparative advantage does New Zealand have?) 4.3.7. Production with no trade (Table 16.6)
 but Australia has the comparative advantage in cotton production (what comparative advantage does New Zealand have ) Production with no trade (Table 16.6).")
13
4.3. Trade between two countries 4.3.8. Gains from specialization and trade ( Table 16.7 ) Although Australia does not any absolute advantage, specialization and trade can benefit both nations because both nations have comparative advantages 4.3.9. Data on production costs: Country ACountry B Wheat $3/bu.$2/bu. Cotton $6/bale$8/bale
 Although Australia does not any absolute advantage, specialization and trade can benefit both nations because both nations have comparative advantages Data on production costs: Country ACountry B Wheat $3/bu.$2/bu. Cotton $6/bale$8/bale.")
14
Take-home exercise Data on production costs: Country C Country D Wheat $3/bu.$2/bu. Cotton $6/bale$5/bale Which country has the absolute advantage in wheat production? Which country has the absolute advantage in cotton production? Which country has the comparative advantage in wheat production? Which country has the comparative advantage in cotton production? Can specialization and trade benefit both countries? If yes, which country is likely to export wheat?

15
4.4. The sources of comparative advantage 4.4.1. What is comparative advantage? 4.4.2. Explanation of the benefit from trade in terms of “opportunity costs” New ZealandAustralia Wheat 6 bu./acre 1 bu./acre Cotton 6 bales/acre3 bales/acre Opportunity cost of wheat Opportunity cost of cotton New Zealand: 1 bale of cotton1 bu. wheat Australia: 3 bales of cotton0.33 bu. wheat

16
4.4. The sources of comparative advantage 4.4.3. Sources of comparative advantage Differences in natural resource endowments Differences in human resource endowments Differences in technology Differences in economic & development policies ….

17
4.5. Other reasons for international trade 4.5.1. Economies of scale -- Returns to scale -- Increasing -- Constant -- Decreasing -- Economies of scale -- Economy of scale: Average cost (AC) decreases when output (Q) increases -- No economy of scale: AC is constant -- Diseconomy of scale: AC increases when Q increases 4.5.2. Political and other factors
 decreases when output (Q) increases -- No economy of scale: AC is constant -- Diseconomy of scale: AC increases when Q increases Political and other factors.")
Similar presentations