Download presentation
Presentation is loading. Please wait.

1
HVACR416 - Design Psychrometrics

2
Definition 23.8.4 Psychrometrics: The study of air and water vapor properties. Psychrometric chart: A graphical representation of moist air’s thermodynamic properties. A thorough knowledge of psychometrics will help technicians to have a better understanding of moist air’s properties and its affect on air conditioning.

3
Psychrometric chart:Where did it come from?
23.8.4 On December 3, 1911, a young engineer by the named of Willis Carrier, presented the most significant documents ever prepared on air conditioning – his "Rational Psychrometric Formulae" – at the annual meeting of the American Society of Mechanical Engineers. It became known as the "Magna-Carta of Psychrometrics."

4
Psychrometric chart:Where did it come from?
23.8.4 This document tied together the concepts of relative humidity, absolute humidity, and dew-point temperature, thus making it possible to design air-conditioning systems to specifically fit the requirements of the load. He was inducted posthumously in the National Inventors Hall of Fame (1985) and the Buffalo Science Museum Hall of Fame (2008).
 and the Buffalo Science Museum Hall of Fame (2008).")
5
Dry Air Atmospheric air with all water vapor and contaminants removed.
The approximate composition by volume of dry air is as follows: 23.8.5 % Helium % Methane % Sulfur Dioxide % Hydrogen % Other (Krypton, Xenon, Ozone, etc.) 78.08 % Nitrogen 20.94 % Oxygen 0.934 % Argon 0.031 % Carbon Dioxide % Neon
 % Nitrogen % Oxygen % Argon % Carbon Dioxide % Neon.")
6
Water Vapor In Earth's Atmosphere
23.8.5 Water vapor is the gaseous phase of water. Water vapor is formed from the evaporation or boiling of liquid water or from the sublimation of ice. Under typical atmospheric conditions, water vapor is continuously generated by evaporation and removed by condensation. Water vapor is lighter or less dense than dry air.

7
Water Vapor In Earth's Atmosphere
23.8.5 Water vapor, as well as carbon dioxide and methane. are effective greenhouse gasses. Each individual water molecule which transitions between the more associated (liquid) and a less associated (vapor/gas) state does so through the absorption or release of kinetic energy. Controlling water vapor and air is a very important concern for the heating, ventilating, and air-conditioning (HVAC) industry.
 and a less associated (vapor/gas) state does so through the absorption or release of kinetic energy. Controlling water vapor and air is a very important concern for the heating, ventilating, and air-conditioning (HVAC) industry.")
8
Water Vapor In Earth's Atmosphere
Approximately 99% of water vapor is contained in the Earth’s troposphere. The condensation of water vapor to the liquid or ice phase is responsible for clouds, fog, rain, snow, and other precipitation. Latent heat released in atmospheric convection is directly responsible for powering destructive storms such as hurricanes or severe thunderstorms. 23.8.5 The percentage water vapor in the atmosphere varies from a trace in desert regions to about 4% over oceans and seas.

9
23.8.5

10
Hot Air Rises 23.8.5 Hot air rises because when heated it expands causing the volume to increase.

11
Earth's Atmosphere Weight of air in the earth’s atmosphere is 14.7 pounds per square inch and will support a column of Mercury inches at sea level. Dry air and moist air when mixed together will follow, Charles and Boyles laws as well as Dalton’s law. P1 X V1 X T2 = P2 X V2 X T1 (All factors must be in absolute) P1 Represents old pressure V1 old volume T1 old temperature P2 represents new pressure V2 new volume T2 new Temperature 23.8.5
 P1 Represents old pressure V1 old volume T1 old temperature. P2 represents new pressure V2 new volume T2 new Temperature")
12
Earth's Atmosphere 23.8.5 Atmospheric water vapor content is expressed using various measures. Such as: Specific humidity, dew point temperature, relative humidity, and vapor pressure

13
Standard Air 23.8.5 For HVAC purposes standard air is established as 68°F and inches of Hg atmospheric pressure. Occupies a space of cubic feet per lb. Has a density of .075 lbs. per cubic foot.

14
Organizes the properties of air into a very useable graph
Psychrometric chart Organizes the properties of air into a very useable graph 23.8.5

15
Breakdown of the Lines 23.8.6

16
Dry Blub Temperature Measured with an ordinary thermometer.
The Units of measurement are Degrees Fahrenheit or Celsius. Does not indicate the amount of moisture or heat in the air. Dry bulb temperatures are represented on the psychrometric chart by vertical lines and can be used to calculate sensible heat. 23.8.6 One of the most important climate variables for human comfort and building energy efficiency. Is not affected by radiation.

17
Dry Blub Temperature 23.8.6 · Travel up or down the temperature remains the same. · Travel to the left temperature decreases. · Travel to the right temperature increases.

18
Wet Blub Temperature The lowest temperature reached by the evaporation of water only. Evaporation of moisture from the wick covered thermometer represents latent heat. Measured using a wet bulb thermometer. The difference between wet and dry bulb temperature is known as (Wet Bulb Depression). Wet bulb temperature is represented by slightly angle lines and are read at the curved saturation line. 23.8.6 Thermometer bulb is wrapped in cotton cloth and kept wet with water via a wicking action. Unit of measurement degrees Fahrenheit and Celsius.
. Wet bulb temperature is represented by slightly angle lines and are read at the curved saturation line Thermometer bulb is wrapped in cotton cloth and kept wet with water via a wicking action. Unit of measurement degrees Fahrenheit and Celsius.")
19
Wet Blub Temperature 23.8.6 20° 30° 40° 50° 60° 70° 80° 90° 100° Sling Psychrometer Traveling up and down along a wet bulb temperature line, temperature does not change. Sling Psychrometer is used to measure dry and web bulb temperatures.

20
Saturation 23.8.6 This state is often referred to as the maximum amount of water vapor in moist air at a given temperature and pressure. The vapor pressure of water and dew point are the influential factors in the evaporation or condensation of water. A state of neutral equilibrium between moist air and the condensed water phase (liquid or solid).
.")
21
Relative Humidity 23.8.6 The amount of water vapor in air compared to the amount of water vapor air can hold at a constant temperature and volume.

22
Relative Humidity 23.8.6 Relative Humidity lines follow the shape of the saturation line and descend in percentage from 100% to 10%.

23
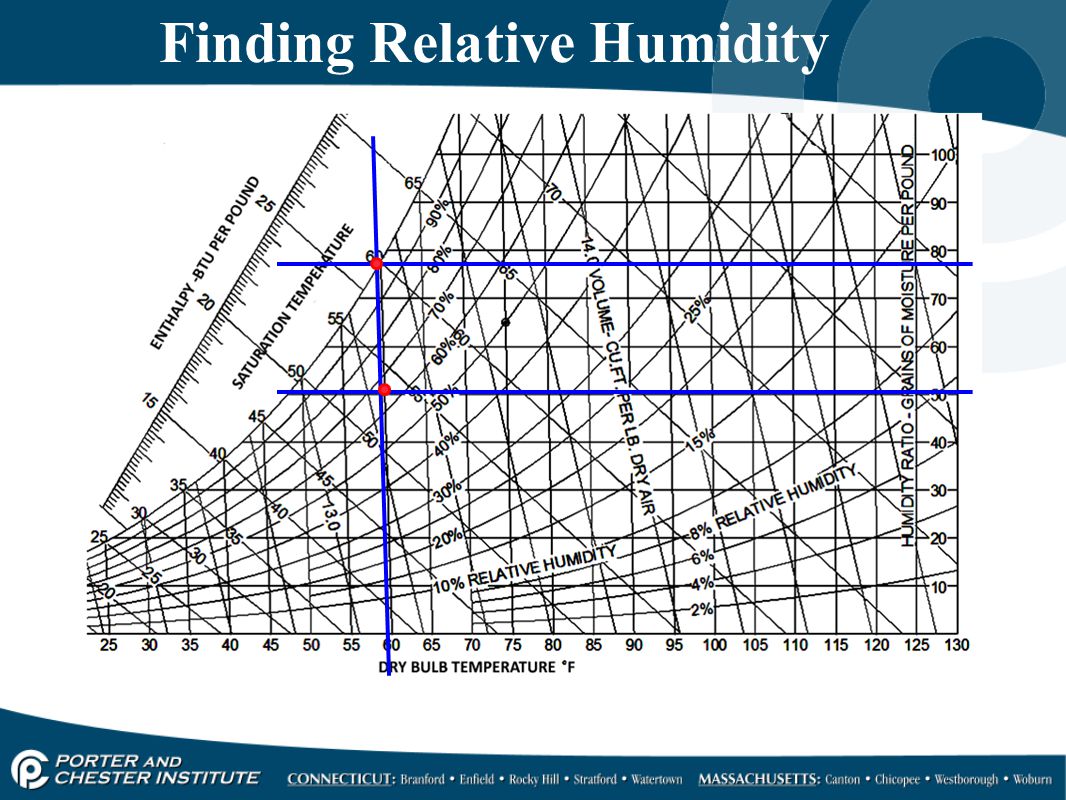
Finding Relative Humidity
23.8.6 Relative humidity is based on the grains at a given point divided by the grains at saturation for that given point. In this example at 60°F DB. there are 50 grains of moisture and at 60°F DB saturated temperature there are grains of moisture. Dividing the 50 grains by 77.5 equals 65% relative humidity.

24
Finding Relative Humidity
23.8.6
25
Relative Humidity & Volume
Each box represents volume at a given temperature and each circle represents relative humidity. 23.8.6 70° 90 % RH 50 % RH 80° 25 % RH 100°

26
Dew Point The temperature which moisture starts to condense out of the air. Dew point is also known as saturation temperature. Dew point temperature is determined by moving from a state point horizontally to the left along lines of constant humidity ratio until the upper, curved, saturation temperature boundary is reached. 23.8.6 To remove moisture from the air, an air conditioner evaporator coil must operate below the dew point temperature. Moisture will collect on the cold surface of an evaporator coil and then drain through the condensate line.

27
Dew Point Saturation Line
Temperatures are read at the Saturation line from a set point to the left along humidity ratio lines. 80° 70° 60° 50° 40° 30°

28
Humidity Ratio Grains of Moisture
Grains of water per pound of air at 100 % humidity, (7007 grains equal 1 pound). This number is commonly rounded to 7000. Humidity ratio is represented by lines of constant humidity running horizontally across the chart to the right from a set point. Grains are represented with the symbol W 23.8.6
. This number is commonly rounded to Humidity ratio is represented by lines of constant humidity running horizontally across the chart to the right from a set point. Grains are represented with the symbol W")
29
Humidity Ratio Grains of Moisture
180 170 160 150 140 130 120 110 100 90 80 23.8.6 Moisture in grains are read from a set point to the right side of the chart. 70 60 50 40 30 20 10 Traveling side to side, moisture content does not change Traveling up, moisture content increases Traveling down, moisture content decreases

30
Humidity Humidity a term for water vapor in the air.
23.8.6 Humidity a term for water vapor in the air. Humidity has many sources, evaporation from oceans, lakes, rivers, and ponds introduces water into the air.

31
Sources of Water Vapor 23.8.6 The following are examples of how water vapor is introduced inside a home. Cooking Showers Humidifier Laundry Condensation Perspiration Firewood Wet clothes / shoes Aquarium Plant Shower Refrigerators

32
Sources of Water Vapor 23.8.6 A variety of household sources release water vapor into the air. When the relative humidity rises and outdoor temperatures fall, the water vapor changes to liquid water a process called condensation. Condensation occurs near the sources of water vapor and in the colder areas of the building. Insulation keeps surfaces warmer, reducing condensation.

33
Enthalpy 23.8.6 The sum of heat energy in moist air. Includes heat of the air (sensible) and water vapor (latent). Symbolized by (h). Unit of measurement is BTU in the US. Enthalpy lines are represented on the chart by extension of wet bulb line beyond saturation but use a different scale.
. Unit of measurement is BTU in the US. Enthalpy lines are represented on the chart by extension of wet bulb line beyond saturation but use a different scale.")
34
Enthalpy 23.8.6

35
Specific Volume 23.8.6 A term used to describe how much space 1 lb of dry air will occupy; this space is measured in cubic feet per pound. The standard is; one pound of dry air will occupy cubic feet. The density of air under these conditions is 1 divided by specific volume; therefore, 1/13.33 would equal .075 pounds per cubic foot.

36
Specific Volume 23.8.6

37
Specific Volume 23.8.6 By heating air from 50⁰F. dry bulb to 90⁰F. dry bulb it oblivious the volume of air increased from 13 cu. Ft. to 14 cu. Ft. per lb.

38
The Comfort Zone 23.8.6 Can be used to compare one comfort situation or condition with another. Shows the different combinations of temperature and relative humidity for summer/winter. Most people are comfortable when the temperatures plotted are in the middle of the chart. Different charts are used for summer and winter conditions.

39
The Comfort Zone Thermal comfort varies based on moist air conditions.
23.8.6 Thermal comfort varies based on moist air conditions. Comfort is a significance part of human comfort, not just the temperature of the ambient air, but also how we cool ourselves by perspiration; drier the air the greater cooling effect, allowing more perspiration to evaporate from our skin.

40
The Comfort Zone A person cutting grass in 95°F and 70% RH enters a house which is at 78°F and 50%RH would be uncomfortable until his/her body adjusts to the inside conditions. Someone working inside the home would be warm under the same conditions as above. 23.8.6

41
Body Temperature The body at rest and in surroundings of 75°F and 50% relative humidity with a slight air movement is normally comfortable. Relative humidity’s affect on Dry Blub is known as effective temperature. (Wind Chill) Most people are comfortable when heat from the body is transferred to the surroundings air at a suitable rate. People transfer (release, absorb) heat by conduction, convection and radiation. Ambient air must be cooler than the body for comfort and for heat transfer. Comfort conditions differ in winter and summer. 23.8.6
 Most people are comfortable when heat from the body is transferred to the surroundings air at a suitable rate. People transfer (release, absorb) heat by conduction, convection and radiation. Ambient air must be cooler than the body for comfort and for heat transfer. Comfort conditions differ in winter and summer")
42
Comfort Level Chart 23.8.6 In the above chart the number in blue represent the comfort zone and it’s effective temperature based on dry bulb temperature and relative humidity.

43
Summary Psychrometrics apply to any physical system containing a gas-vapor mixture, the most common system of interest is the mixture of water vapor and air, because of its application in HVACR. Changes that occur in air are subjective to a specific air conditioning process and can be easily transferred to the psychometric chart which will indicate the relationship of all properties of air and moisture. Many of the basic principles of air conditioning can be traced or understood by plotting the process on the Psychrometric chart. In human terms, our comfort is significant, not just the temperature of the ambient air, but because we cool ourselves by perspiration, understanding that air along with a specific amount of water vapor will affect that comfort. 23.8.6

44
Summary 23.8.6 Comfort is affected by air movement, humidity, air cleanliness, and temperature. Humans are considered to be comfortable when heat is transferred from the body to its surroundings at the proper rate. The body at rest and in surroundings of 75°F and 50% relative humidity with a slight air movement is normally comfortable. The comfort chart is used to compare one comfort situation or condition with another.

Similar presentations


