Download presentation
Presentation is loading. Please wait.

1
X Group: Carlson Pond Physical and Chemical Parameters Fish 415 Rochelle Ochoa, Earl Beasley, Will Kennedy, & Charles Reeves

2
Introduction Carlson Project Objectives: Analysis of the pond Potential for fish stocking Preservation of water level Maintaining Water Clarity Group A Objectives: Physical and Chemical Parameters Bathymetry of Pond Limnological Profiles Chemical Parameters

3
Overview Bathymetry Maximum and average depths Profiles of oxygen, temperature, & conductivity Total Phosphorus Chlorophyll a Summary Recommendations Small Pond

4
Bathymetry Equipment – Boat, depth finder, Global Positioning System (GPS) How it works – Depth finder maps pond floor – The GPS tracks the movements of the boat – Dr. Depth program calculates both together Can calculate average depth…

5
Bathymetry Methods – Trace the shoreline – Paddled a grid type pattern Left depth finder on for the entire time boat in water – Input the measurements in Dr. Depth – Calculate Water volume, map area, maximum, minimum, and average depths – Create map of pond Measured water level Estimated high level

6
Bathymetry Results (Observed Water Level) Observed Water Level H 2 O VolumeMaximum Depth Minimum Depth Average Depth Map Area/Surfac e Area 13,740 cubic feet 3.6 feet0 feet1.8 feet7,772 square feet
 Observed Water Level H 2 O VolumeMaximum Depth Minimum Depth Average Depth Map Area/Surfac e Area 13,740 cubic feet 3.6 feet0 feet1.8 feet7,772 square feet")
7
Bathymetry Results (Estimated High Water Level) Estimate High Water Level Water Volume Maximum Depth Minimum Depth Average Depth Map Area/ Surface Area 59,690 Cubic feet 10.6 feet0 feet5.5 feet10,760 square feet
 Estimate High Water Level Water Volume Maximum Depth Minimum Depth Average Depth Map Area/ Surface Area 59,690 Cubic feet 10.6 feet0 feet5.5 feet10,760 square feet")
8
Bathymetry Sediment Deposition – Calculated by adding core sample depth to measured pond depth – Arc GIS to calculate The volume of sediment layer Volume of sediment layer Volume of just water Subtract the two volumes – Volume of sediment deposited in since pond renovation Results – Sediment Volume – 226.72 cubic feet OR – 8.397 cubic yards

9
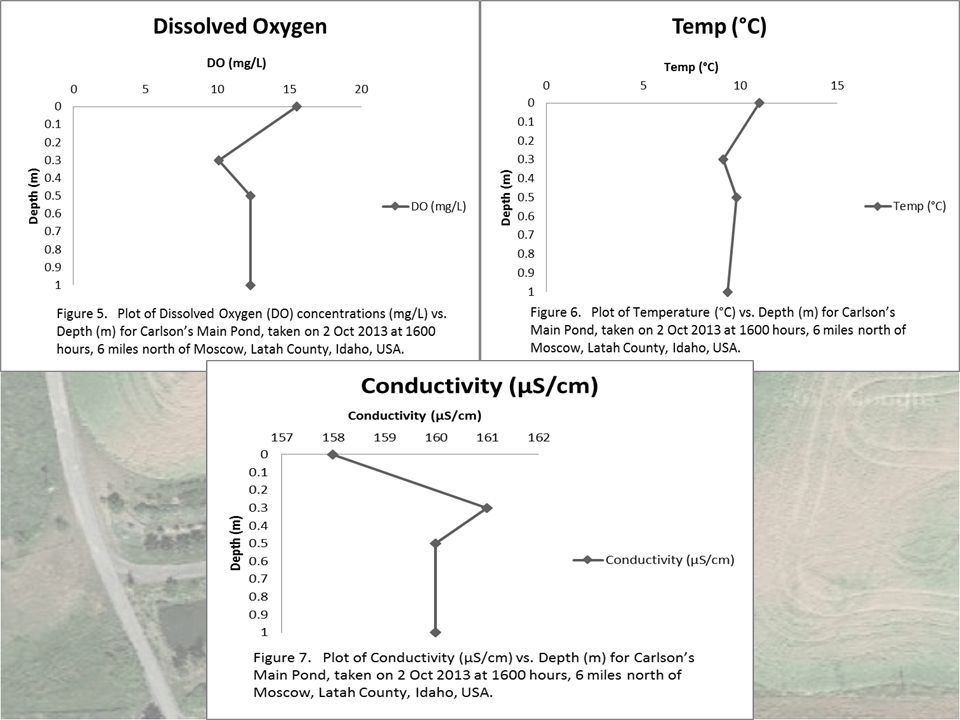
Oxygen, Temperature, & Conductivity Methods – The Carlson’s pond was sampled using a YSI 556 multimeter to measure the oxygen, temperature, and conductivity – The multimeter was lowered into the pond at surface, 0.3meters, 0.5 meters and 1 meter depths to determine the profiles of the pond at its deepest point 1 (middle of pond). 1: Methods taken from Limnology Class note provided on the Fish 415 website.

11
Total Phosphorus Methods – Triplicate Samples taken in 1L dark Nalgene bottles at depths of: Surface 0.5 meters Integrated Sampler – Triplicate samples were taken from three locations: Far right Far left Middle – Laboratory Procedures and Analysis from UI Fish 415 Limnology

12
Total Phosphorus Results Table Total Phosphorus values – Compare to [TP] standard curve – show a decrease on right side and left sections – increase in the middle
![Total Phosphorus Results Table Total Phosphorus values – Compare to [TP] standard curve – show a decrease on right side and left sections – increase in the middle](http://images.slideplayer.com/19/5888533/slides/slide_12.jpg "Total Phosphorus Results Table Total Phosphorus values – Compare to [TP] standard curve – show a decrease on right side and left sections – increase in the middle")
13
Total Phosphorus Main PondDepth[TP]SE Left0386.193.81 0.5404.292.18 Middle0409.056.08 0.5416.197.66 Right0380.486.87 0.5381.431.43 Table 2. Total phosphorus concentration based on depth for Carlson’s Pond taken October 2013. Values show a decrease on right and left sections with an increase in the middle. Figure 3. Main pond TP concentration vs. depth taken from Carlson’s Pond on October 2013 Figure 2. Standard curve for total phosphorus concentration vs. absorbance
![Total Phosphorus Main PondDepth[TP]SE Left Middle Right Table 2.](http://images.slideplayer.com/19/5888533/slides/slide_13.jpg "Total phosphorus concentration based on depth for Carlson’s Pond taken October Values show a decrease on right and left sections with an increase in the middle. Figure 3. Main pond TP concentration vs. depth taken from Carlson’s Pond on October 2013 Figure 2. Standard curve for total phosphorus concentration vs. absorbance.")
14
Chlorophyll a Methods – Triplicate Samples 1L Dark Nalgene Bottles Surface Integrated Sampler 0.5 meters – Three locations Left Middle Right – Laboratory Analysis Procedures established by UI Fish 415 Limnology Class – 750,649, 665 nm

15
Chlorophyll a Table 1. [Chl a] vs. Depth for Carlson’s Pond taken 2 October 2013 Latah County Moscow Idaho. Values show a decrease on right side and middle sections with an increase on the left side due to some possible sediment disturbance from boat oars and the shallow water. Fig. 1 Main pond Chl a concentration (µg/L) vs. depth taken from Carlson’s Pond on 2 October 2013 Latah County, Moscow Idaho. Results Classified as hypereutrophic (>75µg/L) 1 Decline in [Chl a] with depth Possible sediment disturbance from boat oar (Atlas of Alberta Lakes) 1
![Chlorophyll a Table 1. [Chl a] vs.](http://images.slideplayer.com/19/5888533/slides/slide_15.jpg "Depth for Carlson’s Pond taken 2 October 2013 Latah County Moscow Idaho. Values show a decrease on right side and middle sections with an increase on the left side due to some possible sediment disturbance from boat oars and the shallow water. Fig. 1 Main pond Chl a concentration (µg/L) vs. depth taken from Carlson’s Pond on 2 October 2013 Latah County, Moscow Idaho. Results Classified as hypereutrophic (>75µg/L) 1 Decline in [Chl a] with depth Possible sediment disturbance from boat oar (Atlas of Alberta Lakes) 1.")
16
Recommendations Structure: – Small, depth good, Drain pipe Pond Seepage: – Tree roots – Sodium Bentonite Clay O 2 : IMPORTANT – 5-10ppm – Keep nutrients in-check Turbidity: – Field runoff Veg. buffer, Settling pond, North Carolina pH: – 6.5-9 pH optimal – Can lime to lower pH Fish? – 1 sp. – Blue gill, Channel cat, Sun fish Warm water Low O 2 tolerant – 100-150 lbs of fish per surface acre Approximately 25 lbs Permits! Overall Dependent on pH

17
Small Pond Initial measurements using the YSI 556 multimeter – Mean water temp at surface 10.74°C – Mean conductivity 330 µS/cm (almost doubled of Main pond) Water samples were also taken to determine Chlorophyll a and total Phosphorus
 Water samples were also taken to determine Chlorophyll a and total Phosphorus")
18
Small pond recommendations Possible cause increased nutrients Seepage from across driveway – Sewage? Septic lines on other side of driveway – Need to test for optic brighteners, or caffeine to determine if it is sewer overflow – If layer of clay (fragipan) soil layer may cause septic system to function improperly
 soil layer may cause septic system to function improperly.")
19
References Wilhelm, Frank (2013), Sampling Equipment Lab (Spring Valley Reservoir), [online] Available:, August 2013. McDaniel et al. (2007), Linking fragipans, perched water tables, and catchment-scale hydrological processes, USGS (National Agricultural Library digital collection), [online] Available:, Accessed 8 December 2013. Lu et al. (2006), Impact of septic tank systems on local ground water quality and water supply in the Pearl River Delta, China: case study, Hydrological Processes 22, 443-450, 30 July 2007 Private Fish Ponds [PFP]. 2013. Idaho Department of Fish and Game. Boise Idaho, USA. http://fishandgame.idaho.gov/public/fish/?getPage=177 Accessed Nov. 14, 2013. Stocking or maintaining fish in a private pond requires a permit. http://aces.nmsu.edu/pubs/_water/w-104/welcome.html New Mexico State DO, Nutrients… definitions and effects http://aces.nmsu.edu/pubs/_water/w-104/welcome.html http://www.tandfonline.com/doi/abs/10.1577/1548- 8659(1961)90%5B377%3ADROTSO%5D2.0.CO%3B2#preview http://www.tandfonline.com/doi/abs/10.1577/1548- 8659(1961)90%5B377%3ADROTSO%5D2.0.CO%3B2#preview DO requirements for blue gill, large mouth bass, and channel catfish. https://www.noble.org/ag/wildlife/fish-pond-water/ Fish Pond Water Quality: As Simple as Chemistry 101 http://www.ces.ncsu.edu/nreos/wild/fisheries/mgt_guide/chapter1.html Water source quality
![References Wilhelm, Frank (2013), Sampling Equipment Lab (Spring Valley Reservoir), [online] Available:, August 2013.](http://images.slideplayer.com/19/5888533/slides/slide_19.jpg "McDaniel et al. (2007), Linking fragipans, perched water tables, and catchment-scale hydrological processes, USGS (National Agricultural Library digital collection), [online] Available:, Accessed 8 December Lu et al. (2006), Impact of septic tank systems on local ground water quality and water supply in the Pearl River Delta, China: case study, Hydrological Processes 22, , 30 July 2007 Private Fish Ponds [PFP] Idaho Department of Fish and Game. Boise Idaho, USA. getPage=177 Accessed Nov. 14, Stocking or maintaining fish in a private pond requires a permit. New Mexico State DO, Nutrients… definitions and effects (1961)90%5B377%3ADROTSO%5D2.0.CO%3B2#preview (1961)90%5B377%3ADROTSO%5D2.0.CO%3B2#preview DO requirements for blue gill, large mouth bass, and channel catfish. Fish Pond Water Quality: As Simple as Chemistry Water source quality.")
Similar presentations