Download presentation
Presentation is loading. Please wait.

1
Chapter 5: Descriptive Research Describe patterns of behavior, thoughts, and emotions among a group of individuals. Provide information about characteristics about the sample rather than to test hypotheses. 1) Survey: most common type of descriptive research. Select a sample of the population using predetermined questions this allows you to describe attitudes of population from which sample was drawn can compare attitudes of different populations and look for changes in attitudes over time.
 Survey: most common type of descriptive research. Select a sample of the population using predetermined questions this allows you to describe attitudes of population from which sample was drawn can compare attitudes of different populations and look for changes in attitudes over time..")
2
Surveys are usually questionnaires or interviews Cross-sectional survey: survey one more more samples of the population in a single group allows researchers to describe characteristics of a population or the differences between two or more populations Successive independent samples: a series of cross-section series is done. Survey two or more samples at different times with same questions. Allows researcher to study changes in a population over time, but not how individuals change over time. study people’s level of trust in the government at 1972 and 1980.

3
Problems with Successive independent samples: People surveyed at one time are not the same people surveyed at the next time. Noncomparable successive samples: successive samples may not representative of the same population (e.g. could have more poor people in the successive sample). Can only describe changes in population over time if successive samples represent the same population. ACT scores from 1998 through 2002 decreased because more students wrote the ACT in 2002 who had no intention of going to college.
. Can only describe changes in population over time if successive samples represent the same population. ACT scores from 1998 through 2002 decreased because more students wrote the ACT in 2002 who had no intention of going to college..")
4
Longitudinal or panel survey design: same respondents are surveyed over time allows researchers to examine changes in individuals over time. Because it is correlational it is difficult to determine the causes of changes over time Attrition: people may drop out of study over time (move, death etc) and the final sample may not longer be comparable to the original sample. Internet Surveys: can be advantageous inexpensive, can contact people that are hard to reach otherwise, people can respond when they want But, researcher has little control over who responds and people without internet cannot respond.
 and the final sample may not longer be comparable to the original sample. Internet Surveys: can be advantageous inexpensive, can contact people that are hard to reach otherwise, people can respond when they want But, researcher has little control over who responds and people without internet cannot respond..")
5
2) Demographic Research: describes patterns of life events and experiences like birth, marriage, employment etc. 3) Epidemiological Research: study the occurrence of disease in groups of people Psychologists may study how diseases impact people’s behavior and lifestyle. Also study the prevalence of psychological disorders.
 Epidemiological Research: study the occurrence of disease in groups of people Psychologists may study how diseases impact people’s behavior and lifestyle. Also study the prevalence of psychological disorders..")
6
Sampling Selection of people (sample) to participate in research in order to make inferences about a larger group (population). Probability Sampling each member in a population has a specific probability of being chosen. representative sample: is approximately the same as the population in every respect. Researchers can draw unbiased and accurate estimates of the larger population.

7
Sampling error: differences between the sample and the population. Almost inevitable Error of estimation (margin of error): represents how much the data from the sample differ from the population. Estimation of the sampling error. allows researchers to determine how confident they are that the sample results represent the population. 60% of sample chose Tide, accurate within 4% points. 95% probability the true % who chose tide is between 56% and 64%
: represents how much the data from the sample differ from the population. Estimation of the sampling error. allows researchers to determine how confident they are that the sample results represent the population. 60% of sample chose Tide, accurate within 4% points. 95% probability the true % who chose tide is between 56% and 64%.")
8
Error of estimation is influenced by: Sample size: the larger the sample to more similar the sample is to the population. Economical sample: a reasonable estimate of the population. Size of population: sample of 100 is more representative if population is 500 rather than 5000. Variability: the larger the variability, the more difficult it is to estimate population values, and the larger the sample must be.

9
Probability sample: sample for which the researchers knows the probability that an individual is included in the sample. Epsem design (equal probability selection method): used so all individuals in population have an equal probability of being chosen.
: used so all individuals in population have an equal probability of being chosen..")
10
Ways to obtain a probability sample: Simple random sampling: each person in the population has an equal chance of being selected. Researcher must have a complete list (sampling frame) of all the people in the population. Randomly select from the sample frame If you want to select sample of 100 students from a school with 5000 students. –You would get list of all 5000 students and number each from 1 to 5000. –Use a table of random numbers to produce 100 numbers that fall between 1 and 5000 and select those 100 students to be in your sample.
 of all the people in the population. Randomly select from the sample frame If you want to select sample of 100 students from a school with 5000 students. –You would get list of all 5000 students and number each from 1 to –Use a table of random numbers to produce 100 numbers that fall between 1 and 5000 and select those 100 students to be in your sample..")
11
Stratified random sampling: because there may be different subgroups within your population (age, gender, ethnicity) you may want to choose people from each subgroup (stratum). Cases are randomly selected from each strata ensures you have an adequate number of participants from each stratum. Proportionate sampling: cases are drawn from each strata in proportion to their prevalence in the population. If population is 70% men and 30% women, then sample proportionately to ensure 70% men in sample

12
Cluster Sampling: used if you cannot obtain a sampling frame list of the entire population Difficult to get a list of all health care workers in Alberta. Break the population into smaller groups (clusters) for which there are sampling frames and then randomly choose some of the clusters for inclusion the sample. Clusters are usually locations or institutions –Randomly choose different counties in Alberta and then get a list of all workers in those counties Multistage sampling: begin sampling large clusters, then smaller and smaller clusters
 for which there are sampling frames and then randomly choose some of the clusters for inclusion the sample. Clusters are usually locations or institutions –Randomly choose different counties in Alberta and then get a list of all workers in those counties Multistage sampling: begin sampling large clusters, then smaller and smaller clusters.")
13
Sampling Problems Nonrepsonse: if not all people respond to survey, then those that do respond may have different characteristics than those that did not. If return rate is less that 100% the data may be biased in some way. Researchers try to increase response rates with follow up calls Try to determine whether respondents and nonrepsondents differ in particular ways. Misgeneralization: occurs when a researcher generalizes to a population that differs from the sample.

14
Nonprobability Samples Occurs when a researcher does not know the probability of their sample In many cases it is very difficult to obtain a probability sample. Much of psychological research in conducted on samples that are not representative whole population (e.g. undergrads, rats, kids in daycare). This is OK because behavioral research usually describes how variables are related to each other to support a theory, regardless of the nature of the sample. This is why replication (with different samples) is important to improve generalizability of findings.
. This is OK because behavioral research usually describes how variables are related to each other to support a theory, regardless of the nature of the sample. This is why replication (with different samples) is important to improve generalizability of findings..")
15
Convenience sampling: using a sample of individuals that is readily available. –E.g. Schools nearby, autism clinic, undergrads. Quota sampling: convenience sampling, but you ensure that you get particular proportions of certain individuals. –Half boys and half girls; 20 4-, 6-, and 8-year-olds Purposive sampling: researcher decides which individuals are included to get a representative sample. Snowball sampling: one or more individuals for a population are contacted, and these individuals are used to lead the researchers to other members.

16
Describing and Presenting Data Frequency Distributions Table that indicates how many, and is some cases the %, of individuals in the sample that fall into different categories. Simple frequency distribution: If using numbers (scores) possible scores are arranged from lowest to highest and then the frequency of each score is shown.
 possible scores are arranged from lowest to highest and then the frequency of each score is shown..")
17
Frequency Table: Number of Movies Seen in the Last 6 Months Reported by Psychology Students

18
Grouped frequency distribution: combine values into a set of equal class intervals. Relative frequency: proportion of the total number of scores that fall into each interval class interval must be mutually exclusive class intervals must encompass all scores all class intervals should be the same size

19
Histogram

20
Frequency Polygon

21
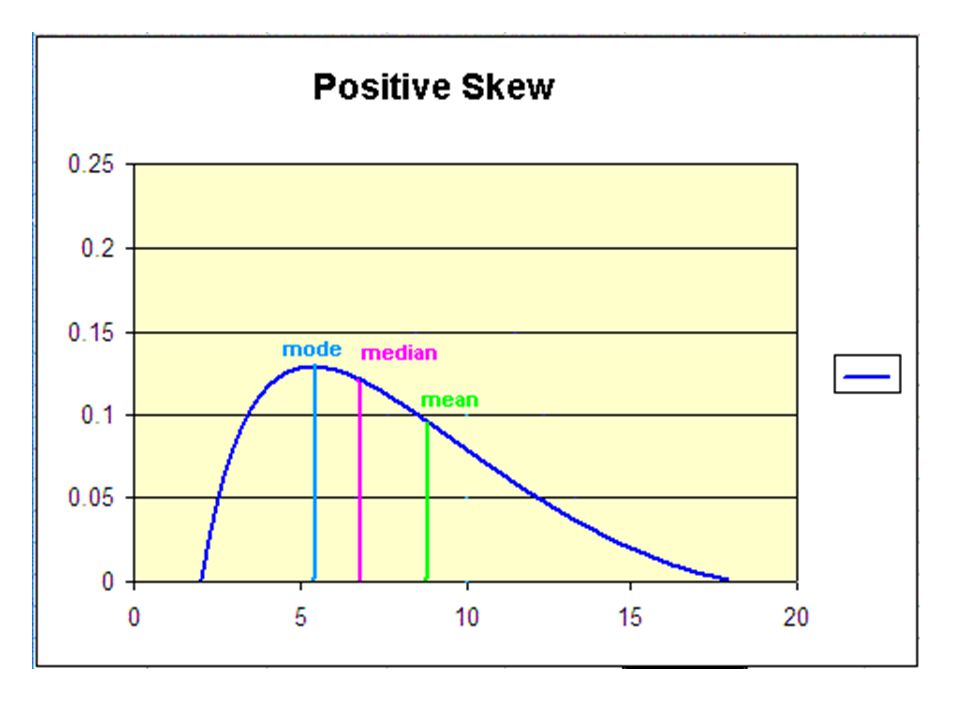
Measures on Central Tendency Gives information about the distribution Mean: average, most common mean is easily influenced by outliers Median: score in the center of the distribution less influenced by outliers Mode: most frequent score can have more than one mode

25
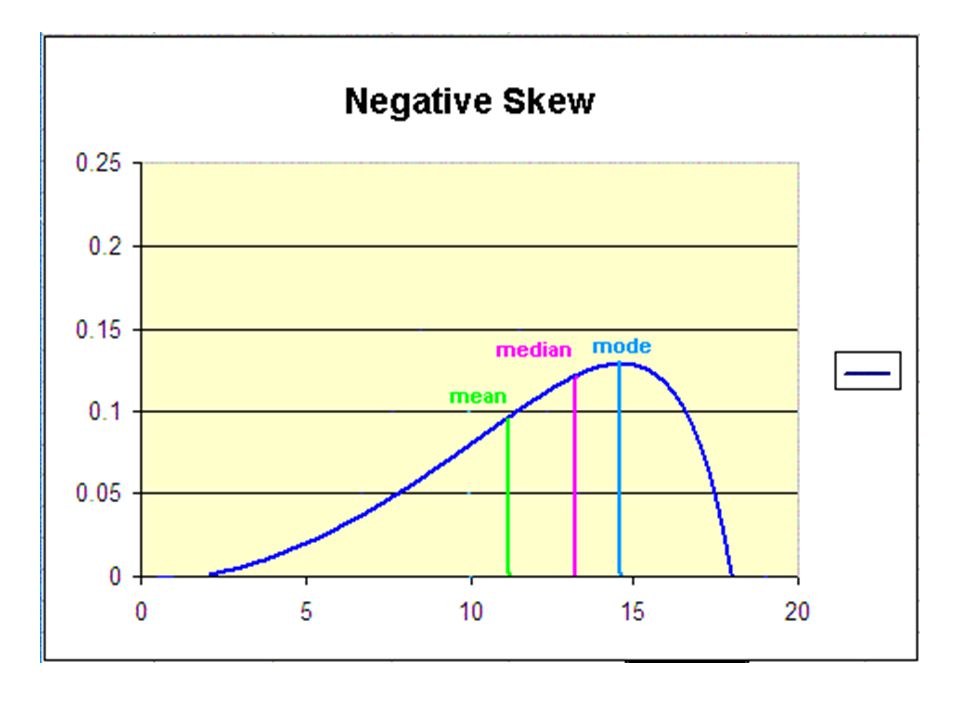
Measures on Variability Descriptive stats that provide information about about the dispersion of scores. range variance (s 2 ) and standard deviation (s) standard deviation represents variability using the original units, not squared units as in variance most data roughly fall into the normal distribution however, in skewed distributions most scores falls toward one end of the distribution
 and standard deviation (s) standard deviation represents variability using the original units, not squared units as in variance most data roughly fall into the normal distribution however, in skewed distributions most scores falls toward one end of the distribution.")
26
Normal Distribution

27
Z score: represents how one score is relative to the rest of the data. Indicates how far the score is from the mean in standard deviations. Z scores can help to identify outliers.

Similar presentations