Download presentation
Presentation is loading. Please wait.

1
Ms. Crystal J. Woods, Algebra I Teacher, Emmett J. Conrad STEM Academy High School, Dallas, TX Dr. Haiyan Wang, Assistant Professor, Electrical and Computer Engineering, TAMU E3 Teacher Summer Research Program Dr. Xinghang Zhang, Assistant Professor, Mechanical Engineering, TAMU

2
Let’s Make a Connection Thin Film Processvs. Growing Crystal Rock Candy

3
E3 Summer Research: My Perspective In Dr. Haiyan Wang’s lab, parameters of thin film growth are being changed. Graduate students are changing either the temperature, material of substrate, deposition material, and/or pressure in order to evaluate the effects of these changes. I’ve been exposed to the high temperature superconductor, thin film deposition using a different deposition material, and the process of vertical line growth deposition. Through each research project, the measurement of thickness is being used. I plan on translating the “idea” of growing thin film and evaluating its thickness in my classroom. I will be able to cover identifying variables, functional relationships, the concept of slope “rate of change”, analyzing, interpreting, making decisions and predictions of data (given in a table or graph), and review measurement concepts. Students will be given several different parameters and will be able to make decisions that will aid them in producing crystal rock candy. Through this lab experience, students will be able to analyze data that has been collected and draw conclusions.
, and review measurement concepts. Students will be given several different parameters and will be able to make decisions that will aid them in producing crystal rock candy. Through this lab experience, students will be able to analyze data that has been collected and draw conclusions..")
4
Pertinent TEKS:

5
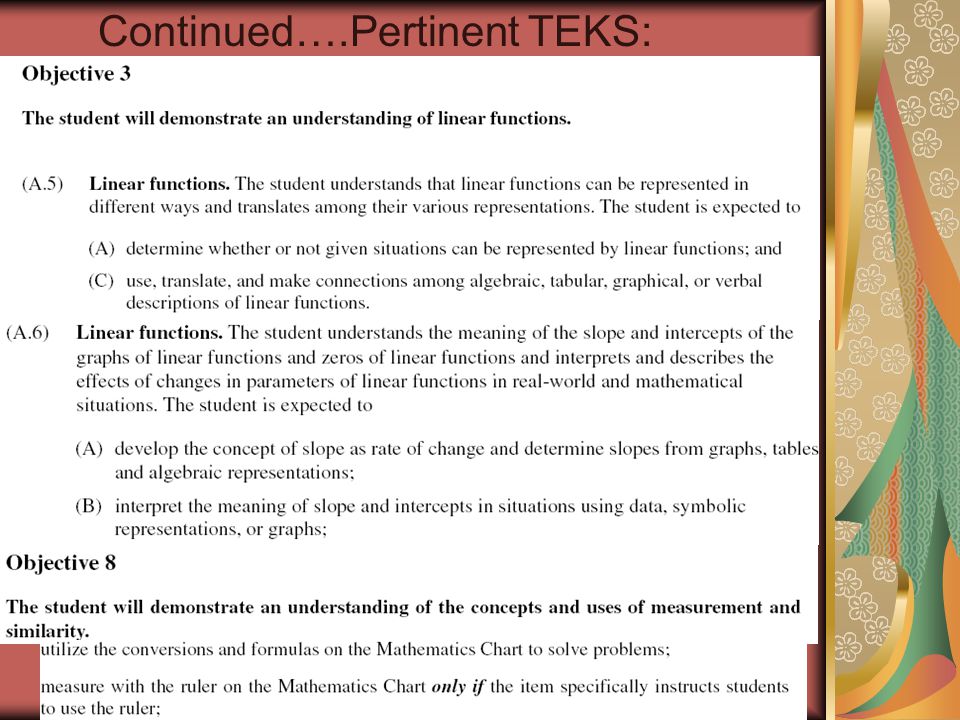
Continued….Pertinent TEKS:

7
Okay, Let’s get “Crystallized” Introduction: Discussion of why crystals are important? Why are they used? How does the real world use them? What devices students use that involves the use of a crystal?

8
Driving Question: A competition: Why should we buy your crystals? Each group will have to present all data (measurements used and why, graphs, tables, equations, and verbal description) and create an advertising ad as to why their product should be used? How can the solubility chart help you produce cost effective crystals?
 and create an advertising ad as to why their product should be used. How can the solubility chart help you produce cost effective crystals .")
9
Objective: Students will be able to describe and understand a functional relationship in a variety of ways; analyze data from graphs to make predictions and decisions; measure the growth of the crystals; connect the growth rate of crystals to slope (rate of change); and make predictions and decisions regarding the growth of the rock candy. Solubility chart of sugar

10
Parameters of Experiment: Temperature Amount of sugar (According to solubility chart) Type of sugar: White, granulated sugar (sucrose) Brown, packaged (sucrose) Sweetener, sugar substitute (dextrose) Corn syrup (fructose) Type of substrate Wood Yarn Materials Required: Water Salt Sugar ( white, brown, sugar substitute) Food coloring Glass jar or Beaker Bowl (ice) Skewer stick Yarn Wooden Clothespin Hot plate Paper towels Measuring cups Solubility chart for sugar Thermometer Calipers
 Type of sugar: White, granulated sugar (sucrose) Brown, packaged (sucrose) Sweetener, sugar substitute (dextrose) Corn syrup (fructose) Type of substrate Wood Yarn Materials Required: Water Salt Sugar ( white, brown, sugar substitute) Food coloring Glass jar or Beaker Bowl (ice) Skewer stick Yarn Wooden Clothespin Hot plate Paper towels Measuring cups Solubility chart for sugar Thermometer Calipers")
11
Engagement Sequence and Time Expectations: Day 1 Introduction, Discuss Competition, Discuss solubility chart of sugar, Supersaturated, and Review Crystal Growing Process

12
Engagement Sequence and Time Expectations: Day 2 Students will start crystal growing process (Teacher will assist with using boiling water). Prepare container to grow crystals. Skewer stick coated with sugar: represents substrate (baser layer of thin film)
.")
13
Day 2 Continued Trick: Place hot solution in freezing water crystals will grow immediately!

14
Day 2 Continued. Adding food coloring adds excitement! Both of these are Corn Syrup (Fructose) This is Sugar Substitute (Dextrose)
 This is Sugar Substitute (Dextrose).")
15
Day 3 – Day 7 Students will individually record the assigned parameters of experiment. This was unsuccessful. Incorrect use of solubility chart! Day 1 Brown Sugar, Sucrose White granulated sugar, Sucrose Yeah! My Crystals are growing: This represents the layer of thin film growth. I tried using a ruler. Need a caliper!

16
Continued Observations: Day 1 Sweetener, Dextrose Sweetener stayed in this form. Sugar did not stick to skewer stick. This would not be good material to use for growing thin film layers!

17
Continued Observations: Corn Syrup, Fructose The Corn Syrup did not crystallize.

18
Day 3No caliper yet! Continued Observations: Brown sugar, Sucrose Crystallizing a little bit. Most of the crystals are at the bottom of cup. Maybe by Friday, you think I will have a larger crystal? My crystals are getting larger.

19
Pre-measure skewer stick Continued Observations: Yeah! I finally got it. Now I can get an accurate measurement of growth. Day 4 Day 0: 4 mm Day 4: 12 mm Had to back track on this step, but hey now I can be accurate!

20
Day 8-11 Students prepare presentation Within their assigned group, students will need to discuss each individual’s data collected and discuss how they are going to present the following: Day 12-14 Presentations will include: Group of 4 (Required documents at the end of Crystal Growing Process) Journal Entries Day 1 through Day 7 (Monitoring Growth of Crystals) Collected data as a table Collected data as a graph Collected data as a functional relationship All justifications of measurements, predictions, and decisions made according to measurements and solubility chart of sugar Advertisement for their product Discoveries made during experiment
 Journal Entries Day 1 through Day 7 (Monitoring Growth of Crystals) Collected data as a table Collected data as a graph Collected data as a functional relationship All justifications of measurements, predictions, and decisions made according to measurements and solubility chart of sugar Advertisement for their product Discoveries made during experiment")
21
Extensions: All groups will analyze and determine what factors they can change to improve their product (i.e.…speeding up the growth of crystals) Each group will conduct a “world tour” of the other crystal products, analyze growth rate, and compare/contrast the results using the different parameters.
 Each group will conduct a world tour of the other crystal products, analyze growth rate, and compare/contrast the results using the different parameters.")
22
Pre-Test and Post-Test will include: Identifying variables Develop & interpret the meaning of slope (rate of change) Describing functional relationships
 Describing functional relationships")
23
Pre-Test and Post-Test will include: Analyzing & Inteterpret tables and graphs Making predictions, decisions, and judgments based on tables and graphs Representing relationships using tables, graphs, and verbal descriptions

24
Kudos! to my wonderful Thin Film Research Team Jie (Joyce) Wang, Ph.D. Candidate Roy Araujo, Ph.D. Candidate Zhenxing Bi, Ph.D. Candidate Sungmee Cho, Ph.D Candidate Ick-Chan Kim, Ph.D. Candidate Joon Hwan Lee, MS Candidate Jongsik Yoon, Ph.D. Candidate Harrison Tsai, MS Candidate Dr. Haiyan Wang Dr. Xinghang Zhang

25
Arun Srinivasa, Associate Professor, Mechanical Engineering, TAMU Andrew Conkey, Lecturer, Mechanical Engineering, TAMU

26
The National Science Foundation! E 3 Teacher Summer Research Program The “Foxes and Hounds” Gang My Thin Film partner, David, for helping me brainstorm about growing crystals and all of your assistance this summer. Alisha Mike Carlos Audrey Troy. Shervada, for assisting with tips and assisting me during my experiment.

Similar presentations


 by Jenny Douglas, Janet Troy and Vanessa Keenan-Boldt G R O W Y O.>")


 Why? I thought it would be fun.>")


