Download presentation
Presentation is loading. Please wait.

1
Your LogoYour own footer

2
Production & Operations Management Chapter : The Role of Operations Management Business Process Reengineering Inventory Management Operations Strategy Total Quality Management Supply Chain Management ✓ Planning & Control Analyzing Operations New Product/process development Project Management Issues For International Operations Time Based Competition Cost Elements 8 8 9 9 10 11 12 13

3
What is inventory Inventory & SCM : Supply Chain Management Inventory Costs Inventory & Quality Management in the Supply Chain Types of Inventory Elements of Inventory Management Inventory Control Systems Economic Order Quantity Models Quantity Discounts Reorder Point Order Quantity for a Periodic Inventory System Lecture Outlines

4
What IsInventory? Stock of items kept to meet future demand Purpose of inventory management: –How many units to order ? –When to order ?

5
Inventory andSupply Chain Management Bullwhip effect –Demand information is distorted as it moves away from the end-use customer –Higher safety stock inventories are stored to compensate Seasonal or cyclical demand Inventory provides independence from vendors Take advantage of price discounts Inventory provides independence between stages and avoids work stoppages

6
Inventory andQuality Management In the Supply Chain Customers usually perceive quality service as availability of goods they want when they want them Inventory must be sufficient to provide high-quality customer service in QM

7
Types of Inventory Raw materials Purchased parts and supplies Work-in-process (partially completed) products (WIP) Items being transported Tools and equipment
 products (WIP) Items being transported Tools and equipment")
8
Two Forms of Demand Dependent –Demand for items used to produce final products –Tires stored at a Goodyear plant are an example of a dependent demand item Independent –Demand for items used by external customers –Cars, appliances, computers, and houses are examples of independent demand inventory

9
Inventory Costs Carrying cost –Cost of holding an item in inventory Ordering cost –Cost of replenishing inventory Shortage cost –temporary or permanent loss of sales when demand cannot be met

10
ABC Classification Class A –5-15 % of units –70 – 80 % of value Class B –30 % of units –15 % of value Class C –50-60 % of units –5-10 % of value

11
ABC Classification: Example

12
ABC Classification: Example (Cont)
")
13
Economic Order Quantity (EOQ) Models EOQ –optimal order quantity that will minimize total inventory costs Basic EOQ model Production quantity model
 Models EOQ –optimal order quantity that will minimize total inventory costs Basic EOQ model Production quantity model")
14
Assumptions of Basic EOQ Model Demand is known with certainty and is constant over time No Shortages are allowed Lead time for the receipt of orders is constant Order quantity is received all at once

15
Inventory Order Cycle

16
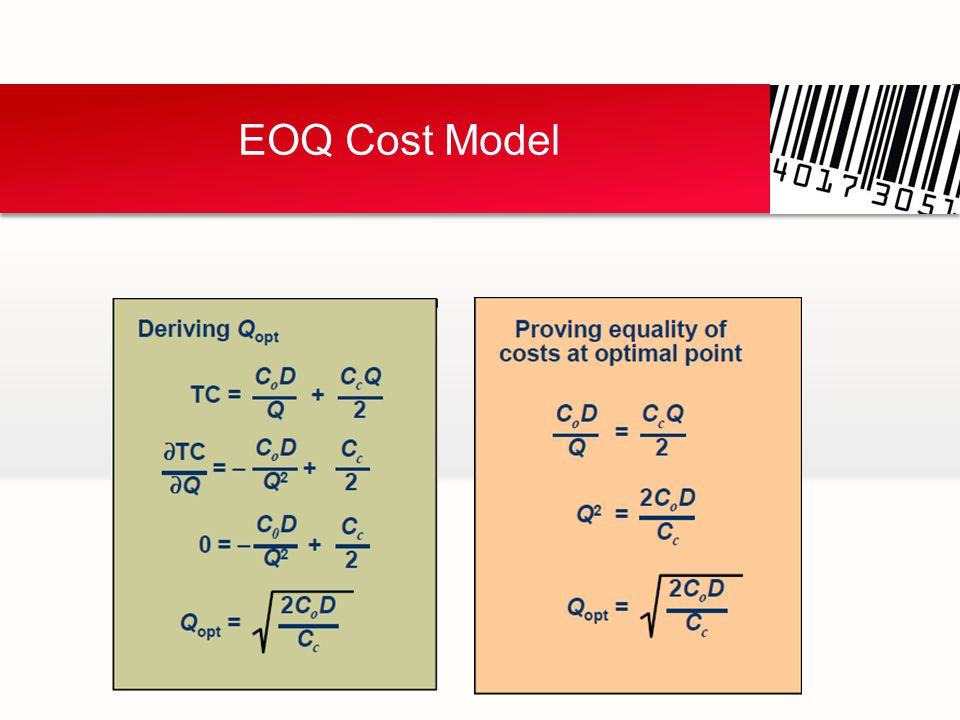
EOQ Cost Model

18
EOQ Cost Model (Cont.)
")
19
EOQ Example

20
Production Quantity Model An inventory system in which an order is received gradually, as inventory is simultaneously being depleted –AKA non-instantaneous receipt model –Assumption that Q is received all at once is relaxed p-daily rate at which an order is received over time, a.k.a. production rate d-daily rate at which inventory is demanded

21
Production Quantity Model (Cont.)
")
23
Production Quantity Model :Example

24
Production Quantity Model :Example (Cont.)
")
25
Solution of EQO Models with Excel

26
Solution of EQO Models with Excel (Cont.)
")
27
Solution of EQO Models with OM Tools

28
Quantity Discounts

29
Quantity Discounts Model (cont.)
")
30
Quantity Discounts Example

31
Quantity Discounts Example with Excel

32
Reorder Point

33
Reorder Point : Example Demand = 10,000 gallons/year Store open 311 days/year Daily demand = 10,000 / 311 = 32.154 gallons/day Lead time = L = 10 days R = dL = (32.154)(10) = 321.54 gallons
(10) = gallons")
34
Safety Stock Safety stock –buffer added to on hand inventory during lead time Stock-out –an inventory shortage Service level –probability that the inventory available during lead time will meet demand

35
Variable demand with a Reorder Point

36
Variable demand with a Safety Stock

37
Variable demand with a Variable Demand

38
Variable demand for a Service Level

39
Variable demand for Variable Demand

40
Determining Reorder Point with Excel

41
Order Quantity for a Periodic Inventory System

42
Periodic Inventory System

43
Fixed-Period Model with Variable Demand

44
Fixed-Period Model with Excel

45
THANK YOU! Ahmed BELAFQUIH

Similar presentations


, PFC.>")