Download presentation
Presentation is loading. Please wait.

1
1.2 CONTINUED.... Drawing and Interpreting Graphs

2
Scientific Graphs: Most scientific graphs are made as line graphs. The lines on scientific graphs are usually drawn either straight or curved. These lines do not have to touch all the data points, but they should at least get close to most of them. These lines are called the best-fit lines. Drawing and Interpreting Graphs

3
Best-Fit Line #1 Best-Fit Line #2 Here are two examples of best-fit graph lines. One is drawn correctly, the other is not. Drawing and Interpreting Graphs

4
Best-Fit Line #1 Best-Fit Line #2 WHICH GRAPH IS DRAWN CORRECTLY??? Drawing and Interpreting Graphs

5
Scientific Graphs: Independent and Dependant variables Drawing and Interpreting Graphs

6
Time (min)Mass (grams) 02.5 14.7 25.6 36.9 47.3 58.9 69.5 This is data I obtained when I performed a certain chemical reaction. I observed and measured the change in mass of a chemical during 6 minutes. Time (min) Mass (grams) Drawing and Interpreting Graphs
 Mass (grams) Drawing and Interpreting Graphs.")
7
Time (min)Mass (grams) 02.5 14.7 25.6 36.9 47.3 58.9 69.5 What is the dependant and what is the independent variable? Time (min) Mass (grams) Drawing and Interpreting Graphs
 Mass (grams) Drawing and Interpreting Graphs.")
8
Time (min)Mass (grams) 02.5 14.7 25.6 36.9 47.3 58.9 69.5 independent variable: it is controlled by the experimenter (a person who does the experiment) dependent variable: it changes with the independent variable Time (min) Mass (grams) Drawing and Interpreting Graphs
Mass (grams) independent variable: it is controlled by the experimenter (a person who does the experiment) dependent variable: it changes with the independent variable Time (min) Mass (grams) Drawing and Interpreting Graphs")
9
Time (min)Mass (grams) 02.5 14.7 25.6 36.9 47.3 58.9 69.5 independent variable: Time (goes on x – axis) dependent variable: Mass (goes on y – axis) Time (min) Mass (grams) Drawing and Interpreting Graphs
Mass (grams) independent variable: Time (goes on x – axis) dependent variable: Mass (goes on y – axis) Time (min) Mass (grams) Drawing and Interpreting Graphs")
10
Graphing Practice Problem #1 Ethylene (C 2 H 4 ) is a plant hormone that causes fruit to mature. The data above concerns the amount of days (from the spraying until maturity of the fruit) versus the amount of ethylene that was used. 1.) Make a graph of the data 2.) What is the dependant variable? 3.) What is the independent variable?
 versus the amount of ethylene that was used. 1.) Make a graph of the data 2.) What is the dependant variable. 3.) What is the independent variable .")
11
Graphing Practice Problem #1 Number of days = dependent variable Amount of ethylene = independent variable

12
Scientific Graphs: Extrapolation and Interpolation Drawing and Interpreting Graphs

13
Extrapolation and Interpolation Graphs are a useful tool in science Graphs can "predict" data which are not measured

14
Extrapolation and Interpolation Extrapolation: extending the graph, along the same slope, above or below measured data.

15
Interpolation: predicting data between two measured points on the graph. Extrapolation and Interpolation

16
Graphing Practice Problem #2 The volume of a gas decreases as the temperature of the gas decreases. A sample of a gas was collected at 100 degrees Celsius and then cooled down. The changes in the volume of the sample are shown below... 1.) Make a graph of the data 2.) Make a second graph which will allow you to extrapolate data to reach a gas volume of 0 ml. 3.) The temperature at which the volume of the gas reaches zero is the theoretical temperature of Absolute Zero. From this graph, what is the Celsius Temperature for Absolute Zero Volume?
 Make a graph of the data 2.) Make a second graph which will allow you to extrapolate data to reach a gas volume of 0 ml. 3.) The temperature at which the volume of the gas reaches zero is the theoretical temperature of Absolute Zero. From this graph, what is the Celsius Temperature for Absolute Zero Volume .")
17
The volume of a gas decreases as the temperature of the gas decreases. A sample of a gas was collected at 100 degrees Celsius and then cooled down. The changes in the volume of the sample are shown below... 1.) Make a graph of the data 2.) Make a second graph which will allow you to extrapolate data to reach a gas volume of 0 ml. 3.) The temperature at which the volume of the gas reaches zero is the theoretical temperature of Absolute Zero. From this graph, what is the Celsius Temperature for Absolute Zero Volume?
 Make a graph of the data 2.) Make a second graph which will allow you to extrapolate data to reach a gas volume of 0 ml. 3.) The temperature at which the volume of the gas reaches zero is the theoretical temperature of Absolute Zero. From this graph, what is the Celsius Temperature for Absolute Zero Volume .")
18
T (˚C) V (mL)
 V (mL)")
19
T (˚C) V (mL)
 V (mL)")
20
T (˚C) V (mL) ≈ -270 ˚C
 V (mL) ≈ -270 ˚C")
21
Drawing and Interpreting Graphs Slope of The Line

22
Slope of the line

23
What is the rise? What is the Run? What is the slope? Is this a positive or negative slope? Slope of the line

24
What is the rise? What is the Run? What is the slope? Is this a positive or negative slope? Slope of the line

25
Graphing Practice Problem #4

26
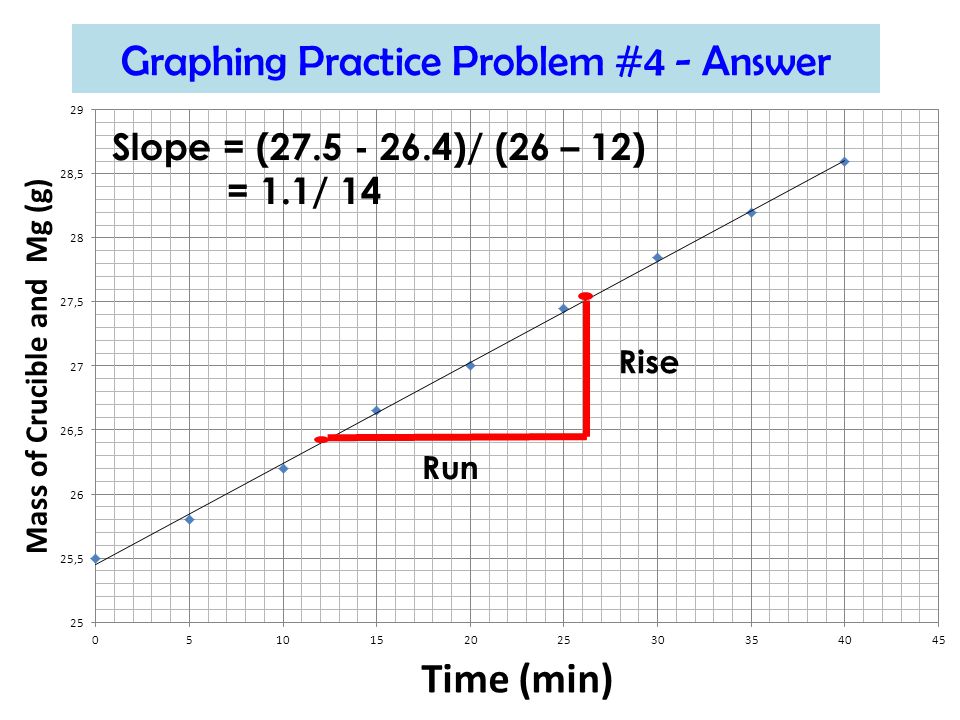
Graphing Practice Problem #4 - Answer 1. Sketch a line with a negative slope a)negative slope b) positive slope c) zero slope
negative slope b) positive slope c) zero slope.")
27
1. Sketch a line with a negative slope a)negative slope Graphing Practice Problem #4 - Answer
negative slope Graphing Practice Problem #4 - Answer")
28
1. Sketch a line with a negative slope b) positive slope Graphing Practice Problem #4 - Answer
 positive slope Graphing Practice Problem #4 - Answer")
29
1. Sketch a line with a negative slope c) zero slope Graphing Practice Problem #4 - Answer
 zero slope Graphing Practice Problem #4 - Answer")
30
2. A student weighs an empty crucible. Its mass is 20.50 g. She adds some pieces of magnesium and then she weighs the crucible again. Its new mass is 25.50 g. She heats the crucible and its contents and weighs it every 5 minutes. She obtains the following data: Time (min)Mass of Crucible and magnesium (grams) 525.80 1026.20 1526.65 2027.00 2527.45 3027.85 3528.20 4028.60 Plot the mass of the crucible's contents and calculate the slope. What do you think is the significance of the slope? Graphing Practice Problem #4 - Answer
Mass of Crucible and magnesium (grams) Plot the mass of the crucible s contents and calculate the slope. What do you think is the significance of the slope. Graphing Practice Problem #4 - Answer.")
37
What do you think is the significance of the slope? It shows us a relationship between the change in mass of a product and time (every minute, the mass of a product increased by about 0.08g) Graphing Practice Problem #4 - Answer
 Graphing Practice Problem #4 - Answer.")
38
Bonus Question: Why was the mass of a crucible and Magnesium increasing when you burned magnesium? The reaction was: 2 Mg (s) + O 2(g) 2 MgO (s) MgO is heavier than Mg!!! That is why the mass of the crucible was increasing Graphing Practice Problem #4 - Answer
 + O 2(g) 2 MgO (s) MgO is heavier than Mg!!. That is why the mass of the crucible was increasing Graphing Practice Problem #4 - Answer.")
39
Labeling the graph Drawing and Interpreting Graphs

40
Scientific Graphs have to be labeled! You MUST label: a)Y and X - axis (what you are measuring + units) FOR EXAMPLE Drawing and Interpreting Graphs
Y and X - axis (what you are measuring + units) FOR EXAMPLE Drawing and Interpreting Graphs.")
42
Scientific Graphs have to be labeled! You MUST label: a)Y and X - axis(what you are measuring + units) b)Y and X - axis(put numbers on them) Drawing and Interpreting Graphs
Y and X - axis(what you are measuring + units) b)Y and X - axis(put numbers on them) Drawing and Interpreting Graphs.")
44
Scientific Graphs have to be labeled! You MUST label: a)Y and X - axis(what you are measuring + units) b)Y and X - axis(put numbers on them) c)The graph (give name to your graph) Drawing and Interpreting Graphs
Y and X - axis(what you are measuring + units) b)Y and X - axis(put numbers on them) c)The graph (give name to your graph) Drawing and Interpreting Graphs.")
45
Change in Mass vs. Time of reaction

46
Scientific Graphs have to be labeled! You MUST label: a)Y and X - axis(what you are measuring + units) b)Y and X - axis(put numbers on them) c)The graph (give name to your graph) d)Any lines which you might have on the graph Drawing and Interpreting Graphs
Y and X - axis(what you are measuring + units) b)Y and X - axis(put numbers on them) c)The graph (give name to your graph) d)Any lines which you might have on the graph Drawing and Interpreting Graphs.")
47
Increase in Mass vs. Time of reaction Student 1 Student 2

48
Graphing Practice Problem #5 Ethylene (C 2 H 4 ) is a plant hormone that causes fruit to mature. The data above concerns the amount of days (from the spraying until maturity of the fruit) versus the amount of ethylene that was used. Take a graph from Practice Problem #1 and label it correctly as we just discussed!!! Amount of ethylene (ml/m 2 ) Wine sap Apples (Days to Maturity) Golden Apples (Days to Maturity) Gala Apples (Days to Maturity) 1014 15 12 13 2011910 251079 30878 35877
 versus the amount of ethylene that was used. Take a graph from Practice Problem #1 and label it correctly as we just discussed!!. Amount of ethylene (ml/m 2 ) Wine sap Apples (Days to Maturity) Golden Apples (Days to Maturity) Gala Apples (Days to Maturity)")
49
Graphing Practice Problem #5

50
Amount of ethylene (ml/m 2 ) Days to maturity (days) The number of days to the maturity of the apples vs. amount of ethylene used

51
Graphing – Pictorial Representation of Data as x increases, y increases as x increases, y decreases as x increases, y increases very quickly

52
1.Calculate slope NOT using data points 2.Write the equation of the line

53
1.2 Activity: Graphing Relationship Page 26

54
1.2 Activity: Graphing Relationship 1.Linear relationship 2.4˚C/min 3.42 ˚C 4.Temperature = (4˚C/min) time + 22 ˚C 5. 14.5 min (use graph or the equation) 6.Temperature of water at the beginning (room temperature) 7.Uneven heating etc…
 6.Temperature of water at the beginning (room temperature) 7.Uneven heating etc….")
55
HOMEWORK 1.2 Review Questions Problems: 11 and 12

56
Interpreting Data it is also important that you be able to interpret data that are represented by a graph.

57
Example# 1 Identify the graph that matches each of the following stories: I had just left home when I realized I had forgotten my books so I went back to pick them up. Interpreting Data

58
Example # 2: Identify the graph that matches each of the following stories: Things went fine until I had a flat tire. Interpreting Data

59
Example # 3: Identify the graph that matches each of the following stories: I started out calmly, but sped up when I realized I was going to be late Interpreting Data

60
Graphing Practice Problem #3 How well can you read a graph problems?

61
1. The graph at the right represents the typical day of a teenager. Answer these questions: a.What percent of the day is spent watching TV? b.How many hours are spent sleeping? c.What activity takes up the least amount of time? d.What activity takes up a quarter of the day? e.What two activities take up 50% of the day? f.What two activities take up 25% of the day 13 33 Sleeping Going to school Talking on the phone, sleeping Phone, eating Graphing Practice Problem #3

62
2. Answer these questions about the graph a.How many sets of data are represented? b.On approximately what calendar date does the graph begin? c.In what month does the graph reach its highest point? 2 ≈ April 10 July Graphing Practice Problem #3

63
3.Answer these questions 4.a) How many total miles did the car travel? b) What was the average speed of the car for the trip? c) Describe the motion of the car between hours 5 and 12? d) What direction is represented by line CD? e) How many miles were traveled in the first two hours of the trip? f) Which line represents the fastest speed? 260 10.4 miles/hour The car was stopped Going back to the origin About 20 DE ≈ 200 – 20 = 180 ≈ 50 – 20 = 30 0 50 Graphing Practice Problem #3
 What was the average speed of the car for the trip. c) Describe the motion of the car between hours 5 and 12. d) What direction is represented by line CD. e) How many miles were traveled in the first two hours of the trip. f) Which line represents the fastest speed miles/hour The car was stopped Going back to the origin About 20 DE ≈ 200 – 20 = 180 ≈ 50 – 20 = Graphing Practice Problem #3.")
64
4. Answer these questions about the graph a. How much rain fell in Mar of 1989? b. How much more rain fell in Feb of 1990 than in Feb of 1989? c. Which year had the most rainfall? d. What is the wettest month on the graph? About 5 inches 2 more inches 1989 June 1990 Graphing Practice Problem #3

Similar presentations


>")


