Download presentation
Presentation is loading. Please wait.

1
DBI303

2
SELECT COUNT(*) FROM ParkingLot WHERE type = ‘AUTO’ AND color = ‘RED’ SELECT COUNT(*) FROM ParkingLot WHERE type = ‘AUTO’ AND color = ‘RED’
 FROM ParkingLot WHERE type = ‘AUTO’ AND color = ‘RED’ SELECT COUNT(*) FROM ParkingLot WHERE type = ‘AUTO’ AND color = ‘RED’")
3
Doesn’t seem like a great solution…

4
This is the streaming data paradigm in a nutshell – ask questions about data in flight.

6
Present Time of interest Web Analytics – Ad placement, Financial Services, Smart Grids, Monitoring – Systems mgmt, Health Care, Manufacturing, etc. years monthsdayshrsminsec $ value of analytics Forecasting in Enterprises Historical Trend Analysis

7
Sources Devices, Sensors Web servers Stock tickers & News feeds Data Bus Caching Processing Visualization Distribution Static Reports Mining, Validation, “What-If” Scenarios Operational Dashboard (Ticking - Snapshot) Reporting Dashboard (Refreshed) Message Bus Operational Analytics Automated Decisions Relational Database Intra-Day Cubes Historic Cubes ETL Reference Data Refresh (Push) Cache Refresh (Push) Re-compute (Pull) Service Broker Microsoft StreamInsight
 Reporting Dashboard (Refreshed) Message Bus Operational Analytics Automated Decisions Relational Database Intra-Day Cubes Historic Cubes ETL Reference Data Refresh (Push) Cache Refresh (Push) Re-compute (Pull) Service Broker Microsoft StreamInsight")
8
Analytical results need to reflect important changes in business reality immediately and enable responses to them with minimal latency Database ApplicationsEvent-driven Applications Query ParadigmAd-hoc queries or requestsContinuous standing queries LatencySeconds, hours, daysMilliseconds or less Data RateHundreds of events/secTens of thousands of events/sec or more Query SemanticsDeclarative relational analyticsDeclarative relational and temporal analytics request response Event output stream input stream

9
Relational Database Applications Financial trading Applications Aggregate Data Rate (Events/sec.) Latency 010100100010000100000~1million Months Days hours Minutes Seconds 100 ms < 1ms Operational Analytics Applications, e.g., Logistics, etc. Manufacturing Applications Monitoring Applications StreamInsight Target Scenarios Data Warehousing Applications Web Analytics Applications

10
Standing Queries Query Logic Event sources Event targets Devices, Sensors Web servers Event stores & Databases Stock ticker, news feeds Event stores & Databases Pagers & Monitoring devices KPI Dashboards, SharePoint UI Trading stations Input Adapters Output Adapters StreamInsight Engine Query Logic StreamInsight Application Development StreamInsight Application at Runtime

11
Industry trends Data acquisition costs are negligible Raw storage costs are small and continue to decrease Processing costs are non-negligible Data loading costs continue to be significant Manage business via KPI-triggered actions Mine historical data Devise new KPIs Monitor KPIs Record raw data (history) CEP advantage Process data incrementally, i.e., while it is in flight Avoid loading while still doing the processing you want Seamless querying for monitoring, managing and mining
 CEP advantage Process data incrementally, i.e., while it is in flight Avoid loading while still doing the processing you want Seamless querying for monitoring, managing and mining")
12
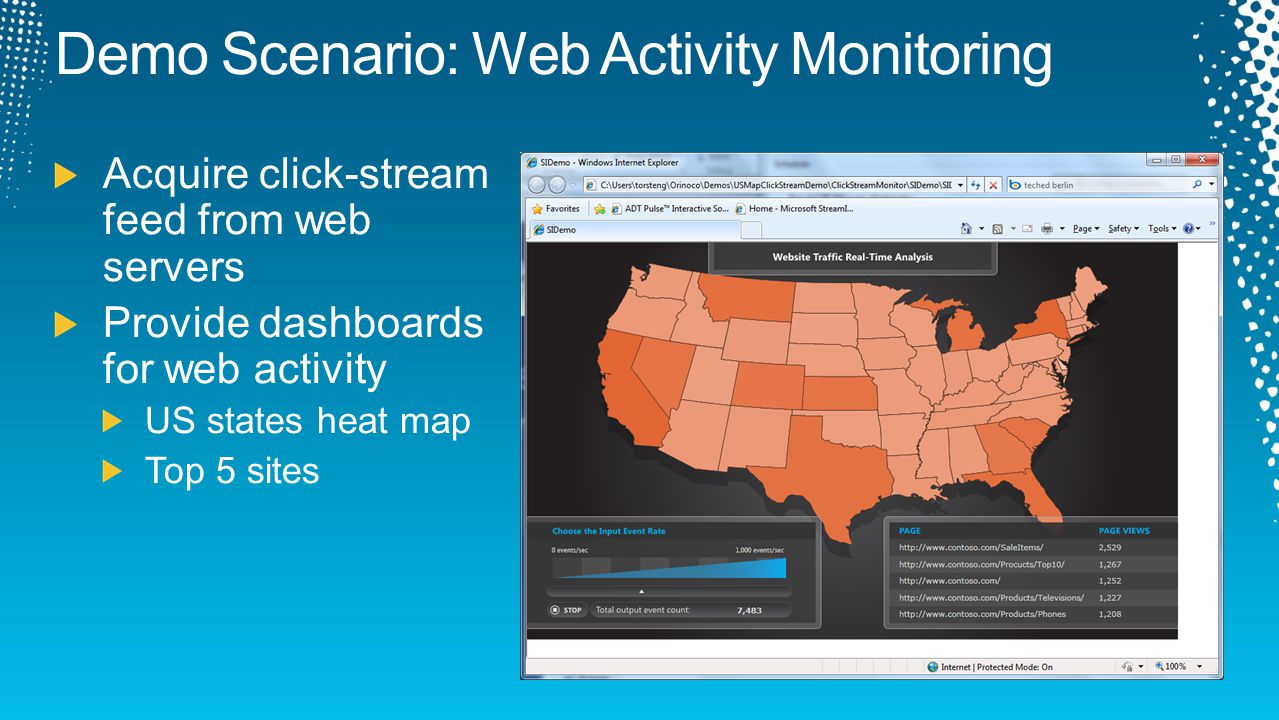
Data Stream Stream Data Store & Archive Event Processing Engine Data Stream Asset Specs & Parameters Power Utilities: Energy consumption Outages Smart grids 100,000 events/sec Visual trend-line and KPI monitoring Batch & product management Automated anomaly detection Real-time customer segmentation Algorithmic trading Proactive condition-based maintenance Visual trend-line and KPI monitoring Batch & product management Automated anomaly detection Real-time customer segmentation Algorithmic trading Proactive condition-based maintenance Web Analytics: Click-stream data Online customer behavior Page layout 100,000 events /sec Manufacturing: Sensor on plant floor React through device controllers Aggregated data 10,000 events/sec Threshold queries Event correlation from multiple sources Pattern queries Threshold queries Event correlation from multiple sources Pattern queries Lookup Asset Instrumentation for Data Acquisition, Subscriptions to Data Feeds Financial Services: Stock & news feeds Algorithmic trading Patterns over time Super-low latency 100,000 events /sec

14
demo

15
Market Feed: -MSFT -IBM -etc. Market Feed: -MSFT -IBM -etc. StreamInsight Output Adapters Input Adapters Grouping Aggregati on Grouping Aggregati on Asset Class TickerExchangeSUM Volume SUM Bid SUM Ask StockMSFTNASDAQ100 StockIBMNASDAQ200 Push Pull Push Pull

16
announcement

19
demo

21
announcement

24
demo

29
LINQ Example – GROUP&APPLY, WINDOW: from e3 in MyStream3 group e3 by e3.i into SubStream from win in SubStream.HoppingWindow( FiveMinutes,ThreeSeconds) select new { i = SubStream.Key, a = win.Avg(e => e.f) }; LINQ Example – GROUP&APPLY, WINDOW: from e3 in MyStream3 group e3 by e3.i into SubStream from win in SubStream.HoppingWindow( FiveMinutes,ThreeSeconds) select new { i = SubStream.Key, a = win.Avg(e => e.f) }; LINQ Example – JOIN, PROJECT, FILTER: from e1 in MyStream1 join e2 in MyStream2 on e1.ID equals e2.ID where e1.f2 == “foo” select new { e1.f1, e2.f4 }; LINQ Example – JOIN, PROJECT, FILTER: from e1 in MyStream1 join e2 in MyStream2 on e1.ID equals e2.ID where e1.f2 == “foo” select new { e1.f1, e2.f4 }; Join Filter Project Grouping Window Project & Aggregate
 select new { i = SubStream.Key, a = win.Avg(e => e.f) }; LINQ Example – GROUP&APPLY, WINDOW: from e3 in MyStream3 group e3 by e3.i into SubStream from win in SubStream.HoppingWindow( FiveMinutes,ThreeSeconds) select new { i = SubStream.Key, a = win.Avg(e => e.f) }; LINQ Example – JOIN, PROJECT, FILTER: from e1 in MyStream1 join e2 in MyStream2 on e1.ID equals e2.ID where e1.f2 == foo select new { e1.f1, e2.f4 }; LINQ Example – JOIN, PROJECT, FILTER: from e1 in MyStream1 join e2 in MyStream2 on e1.ID equals e2.ID where e1.f2 == foo select new { e1.f1, e2.f4 }; Join Filter Project Grouping Window Project & Aggregate")
30
Data Sources Aggregation & Correlation Stream- Insight CEP for lightweight processing and filtering CEP for aggregation and correlation CEP for complex analytics including historical data Devices Sensors Web servers Feeds Stream- Insight Complex Analytics & Mining Stream- Insight Event processing engines are deployed at multiple places on different scales: At the edge close to the data source In the mid-tier consolidate related data sources In the data center historical archive, mining, large scale correlation

31
Custom/Packaged OLTP Apps 4 procs, 64GB RAM, Backup Compression 8 procs, 2TB RAM, Adv. Security, Backup Compression >8 procs, OS Max, Adv. Security, Backup Compression N/A Server Consolidation1 VM/license 4 VMs/license, Resource Governor App & Multi-Server Mgmt (up to 25 instances) Unlimited Virtualization, Resource Governor, App & Multi-Server Mgmt (> 25 instances) N/A Data Warehousing Scale-Up DW, Data Compression 10s of TBs, Up to 30 TB with FastTrack Scale-Up DW, Data Compression 10s of TBs Scale-Out DW 10s - 100s of TBs Business IntelligenceDept/Team BI Enterprise-Scale BI, Master Data Services, PowerPivot Mgmt Enterprise-Scale BI, Master Data Services, PowerPivot Mgmt Integrated with SSIS, SSAS and SSRS Complex Event Processing (StreamInsight) 5 sec latency <5000 events/sec & > 5 s latency >5000 events/sec & < 5 s latency Future coverage
 Unlimited Virtualization, Resource Governor, App & Multi-Server Mgmt (> 25 instances) N/A Data Warehousing Scale-Up DW, Data Compression 10s of TBs, Up to 30 TB with FastTrack Scale-Up DW, Data Compression 10s of TBs Scale-Out DW 10s - 100s of TBs Business IntelligenceDept/Team BI Enterprise-Scale BI, Master Data Services, PowerPivot Mgmt Enterprise-Scale BI, Master Data Services, PowerPivot Mgmt Integrated with SSIS, SSAS and SSRS Complex Event Processing (StreamInsight) 5 sec latency <5000 events/sec & > 5 s latency >5000 events/sec & < 5 s latency Future coverage.")
32
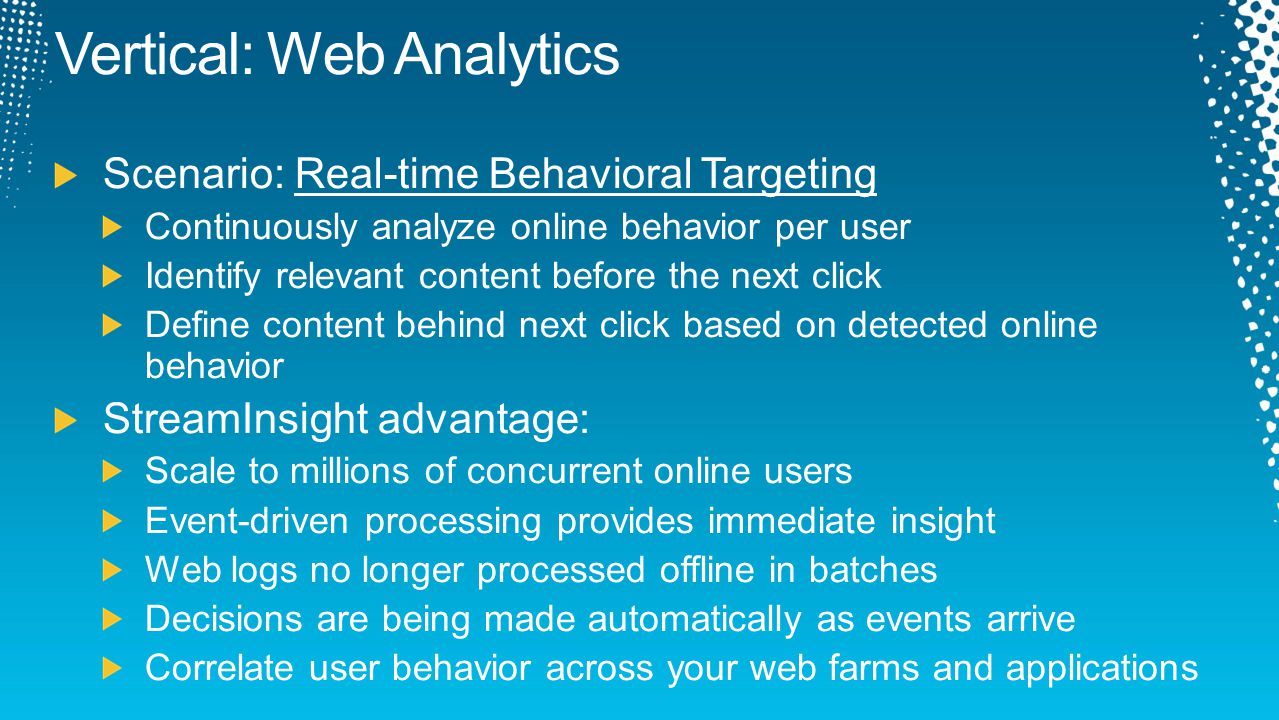
ManufacturingUtilitiesOil & GasFinancial Services Web AnalyticsTelco Scenarios:Alarming Notifications Real-Time Analysis AMI/SmartGrid Outage Management Well Monitoring Operational Intelligence Risk Management Market Monitoring Behavioral Targeting Load Monitoring CDR Aggregation ISV:OSIsoft Matrikon ICONICS OSIsoft Matrikon Telvent ICONICS OSIsoft Matrikon Lab49 IMGroup MSFT AdCenter XBox DPE SI:Logica Hitachi Consulting Lab49 IMGroup MSFT AdCenter XBox DPE

33
Standing Queries Query Logic Event sources Event targets Devices, Sensors Web servers Event stores & Databases Stock ticker, news feeds Event stores & Databases Pagers & Monitoring devices KPI Dashboards, SharePoint UI Trading stations Input Adapters Output Adapters StreamInsight Engine Query Logic StreamInsight Application Development StreamInsight Application at Runtime Support for.NET sequences as sources and sinks; Flexible adapter SDK to connect to other event sources and sinks Event-driven applications are fundamentally different from traditional database applications: queries are continuous, consume and produce streams, and compute results incrementally The CEP platform does the heavy lifting for you to deal with temporal characteristics of event stream data Development experience with.NET, C#, LINQ and Visual Studio 2008 and 2010 CEP platform from Microsoft to build event-driven applications

35
Required Slide Speakers, please list the Breakout Sessions, Interactive Discussions, Labs, Demo Stations and Certification Exam that relate to your session. Also indicate when they can find you staffing in the TLC.

36
Resources www.microsoft.com/teched Sessions On-Demand & CommunityMicrosoft Certification & Training Resources Resources for IT ProfessionalsResources for Developers www.microsoft.com/learning http://microsoft.com/technet http://microsoft.com/msdn http://northamerica.msteched.com Connect. Share. Discuss.

38
Scan the Tag to evaluate this session now on myTechEd Mobile

Similar presentations
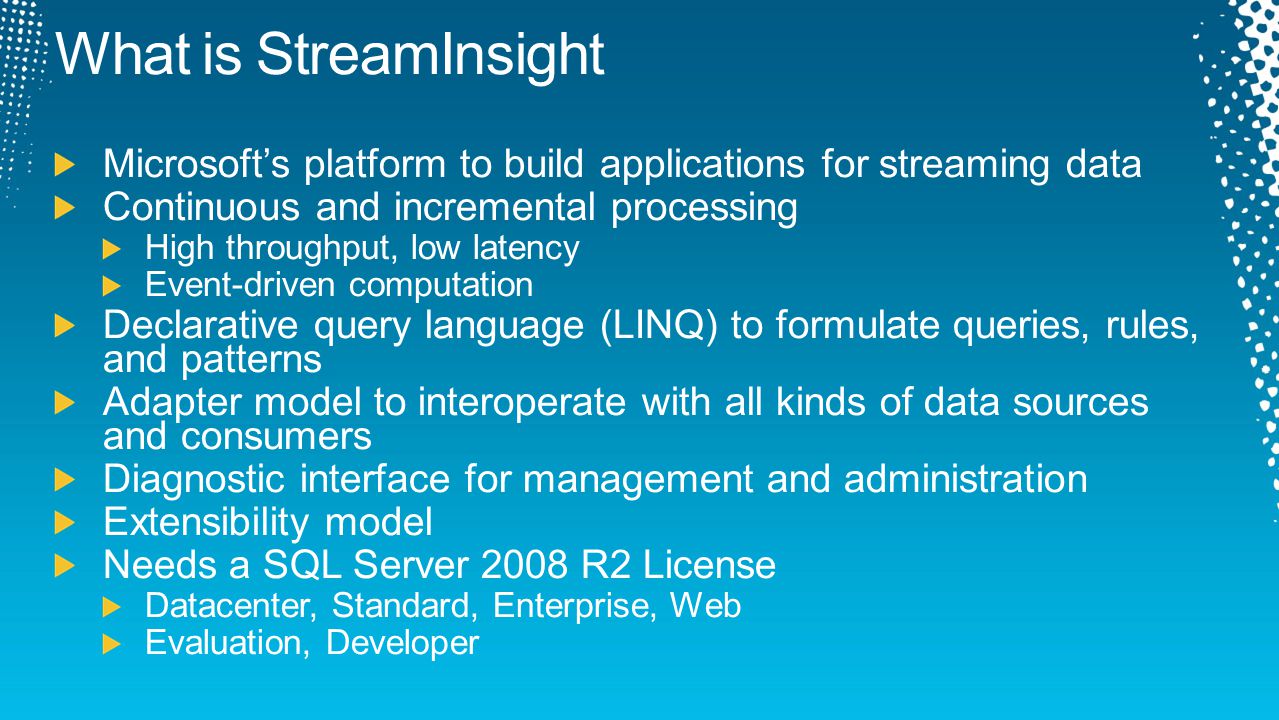


 is the continuous and incremental processing of event streams from multiple sources based on declarative query.>")
 Amit Bansal (PeoplewareIndia.com)>")


