Download presentation
Presentation is loading. Please wait.

1
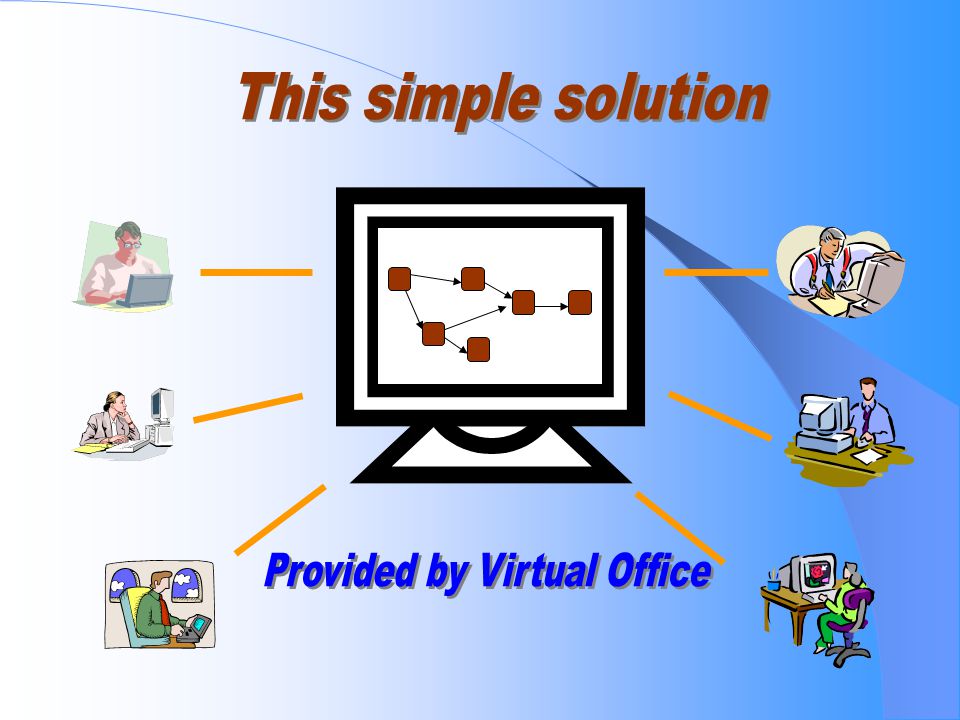
Distributed, Collaborative Processing System (COBRA Virtual Office)
")
3
Distributed, Collaborative Processing Systems –Some Prospects E-Commerce B2B and B2C -Collaborative Product design -Collaborative Product decision Software Engineering Environments -Distributed Collaborative system design space Group communication -Net meeting -PDA, PCS etc -Virtual class rooms Personal entertainment -On-line video games

4
Multiple users at different locations can work on one design collaboratively and simultaneously. No travel and no delay. Higher Productivity, Lower cost, Better Traceablity.

5
COBRA= Collaborative behavioral Requirement and Architecture FOR Modeling requirements Designing architecture Evaluating existing architectures/components if they can meet new requirements Monitoring projects

6
The System Provides Communication of Knowledge Simulation Project Management Traceability

7
History of COBRA Started in 1994 as a research prototype Initial implementation in c/c++ and tc/tlk Current implementation in Java

8
Main Challenges seen previously Poor documentation of the system Insufficient communication when projects passed from semester to semester. Poor communication among members resulting in integration problem Reinventing the wheel due to poor code comments.

9
The system is implemented using Java/JavaBeans so as to enhance platform-independence, interoperability, composability (plug-and-play), and distributability. Platform Independency

10
The system will be used to model the behavior of a variety of system types, including a mobile communication system. Hence, we will be using a particular scenario for the particular system chosen to be modeled. System Applications

11
Usecase for COBRA system

12
Cobra Virtual Office Functionalities Constructing Augmented Petri-Net (FSM) for System Behavior Modeling Constructing PERT Chart for Project Scheduling and management
 for System Behavior Modeling Constructing PERT Chart for Project Scheduling and management")
13
As a test-bed, we are working on the modeling and analysis of system behavior using Augmented Petri Net (APN), a formalism which is expressively more powerful than Finite State Machines. Constructing Augmented Petri-Net

14
More about Augmented Petri-Net A form of FSMs, first proposed by C. A. Petri in 1962 A notation for defining abstract concurrent processes Primitives: Place Transition Token T When all input places of a transition are enabled (i.e., with a token) and the external stimulus associated with the transition occurs, the tokens move from the input places to output places
 and the external stimulus associated with the transition occurs, the tokens move from the input places to output places.")
15
Fundamental notions: Sequencing T2 T1 T2T1 Concurrency T2 T3 Synchronization T1 T3

16
ONTARIO Site TEXAS Site NORTH CAROLINA Site

17
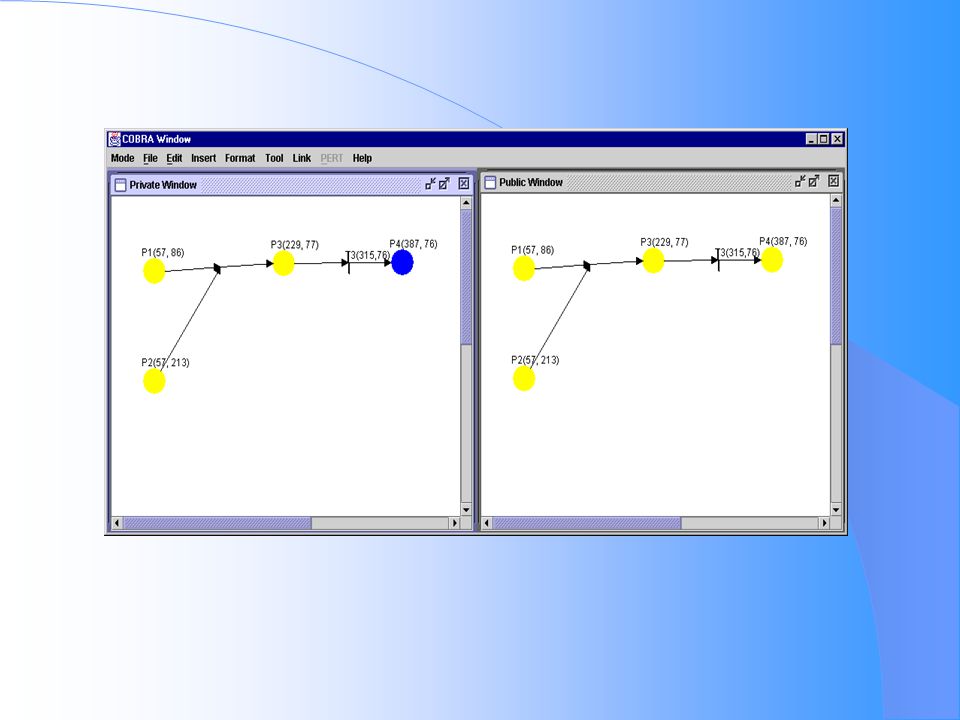
Collaborative Processing (view from Texas) Public Window TX Window
 Public Window TX Window")
18
Collaborative Processing (view from Ontario) Public Window ON Window
 Public Window ON Window")
19
Collaborative Processing (view from North Carolina) Public Window NC Window
 Public Window NC Window")
20
Simulation The system’s simulation functionality represent the behavior of Petri-net

21
Simulation (Cont’)
")
22
Another Aspect of the Virtual Office Monitoring and Scheduling Projects Using PERT Chart

25
Why Do We Need PERT Chart Allows users to express time dependencies for project tasks Analyze the project critical path Tracks project progress to ensure that delay is recognized Provides a road map for a project manager

26
How to Represent a PERT Chart in This System The COBRA Virtual Office has functionality of constructing Augmented Petri-Net (APN), and allows system behavior simulation Traditional PERT Chart representation lacks dynamic functionality to monitor project progress A mapping from PERT chart to Augmented Perti-Net is proposed for the ease of project progress simulation
, and allows system behavior simulation Traditional PERT Chart representation lacks dynamic functionality to monitor project progress A mapping from PERT chart to Augmented Perti-Net is proposed for the ease of project progress simulation")
27
Figure 1: PERT Chart Representation Numbered rectangles are nodes that represent events or milestones Directional arrows represent tasks that must be completed sequentially Diverging arrow directions indicate possibly concurrent tasks Dotted lines indicate dependent tasks that do not require resources 1 2 3 4 5 6 7 8 9 10 11 Create Schedule Buy Hardware Programming Installation Test Code Write Man Conversion Test System TrainingUser Test 10 20 10 5 15 5 510 An Example

28
Numbered rectangles are nodes that represent states of a project Directional arrows represent moving from one state to another Vertical bars represent transitions from one state to another 1 1’ 2 3 4 5 5’6 7 8 9 10 11 Schedule done @now>=t0+9 ۸ ~done /reminder Hardware bought @now>=t0+4 ۸ ~done /reminder Programming done @now>=t0+18 ۸ ~done /reminder @now>=t0+13 ۸ ~done /reminder Installation done @now>=t0+13 ۸ ~done /reminder man done @now>=t0+4 ۸ ~done /reminder conversion done @now>=t0+4۸ ~done /reminder Training done @now>=t0+9 ۸ ~done /reminder User test done @now>=t0+18 ۸ ~done /reminder Code test done @now>=t0+9 ۸ ~done /reminder system test done Figure 2: APN Representation An Example (Cont’)
")
30
COBRA architecture

Similar presentations


 tasks that transforms a set of input to a set of output. Inputs Outputs Design Process.>")


 Places P = { p 1, p 2, p 3, …, p n } Transitions T = { t 1, t 2, t 3, …, t n } Input.>")


 Charts,>")


