Download presentation
Presentation is loading. Please wait.

1
Performance Metrics University of Kansas – UKANS & KURES Report Period: FY15 Q1 – Q3 Date: 4/17/2015

2
*This analysis only includes requisitions with static cart assignment date **Calculation between workflow steps “Cart Assignment Date” and “Account Validation Response 1” 84% of the requisitions were processed at departmental level within one day. Going from Q2 to Q3, same- day processing was improved by 8%.

3
*This analysis only includes KU Central Purchasing reviewed requisitions **Calculation between workflow steps “Account Validation 1” and “Account Validation Response 2” KU Purchasing reviewed 71% requisitions. 78% of these central-reviewed requisitions were processed within one day. Same-Day processing had a 5% improvement in Q3.

4
FY15TD, UKANS and KURES had combined 57K PO’s with a total spend of $225M.

5
FY15 Q1 – Q3, there were 20K PO’s, with a total spend of $70M. Going from Q2 to Q3, Punchout transactions increased by 2%; Check Request decreased by 3%.

6
FY15TD, E-Invoice utilization was at 35%, or 8% of total spend. E-Invoice increased by 2% from Q2 to Q3.

7
In this report period, there were 115K transactions, totaling in $315M. Pcard had the highest transaction count; KUPPS Non-Catalog PO Voucher was the highest in spend.

8
54% transactions or 69% spend of FY15TD was via KUPP, including Punchout, Non-Catalog orders and Check Requests.

10
There were 52K Pcard transactions in this report period with total a spend of $15M. Average transaction cost was $291. Pcard transactions peaked in Q3 of FY15 84% of Pcard transactions were under $500 purchases High $ transactions includes Food, Rental, Subscription, Membership, and Travel… etc.

11
ARSP 113 – RGS had the highest Pcard usage – 20% of transactions or 19% of total spend.

12
ARSP 118 – Operations: Pcard Spend by Account & Vendor

13
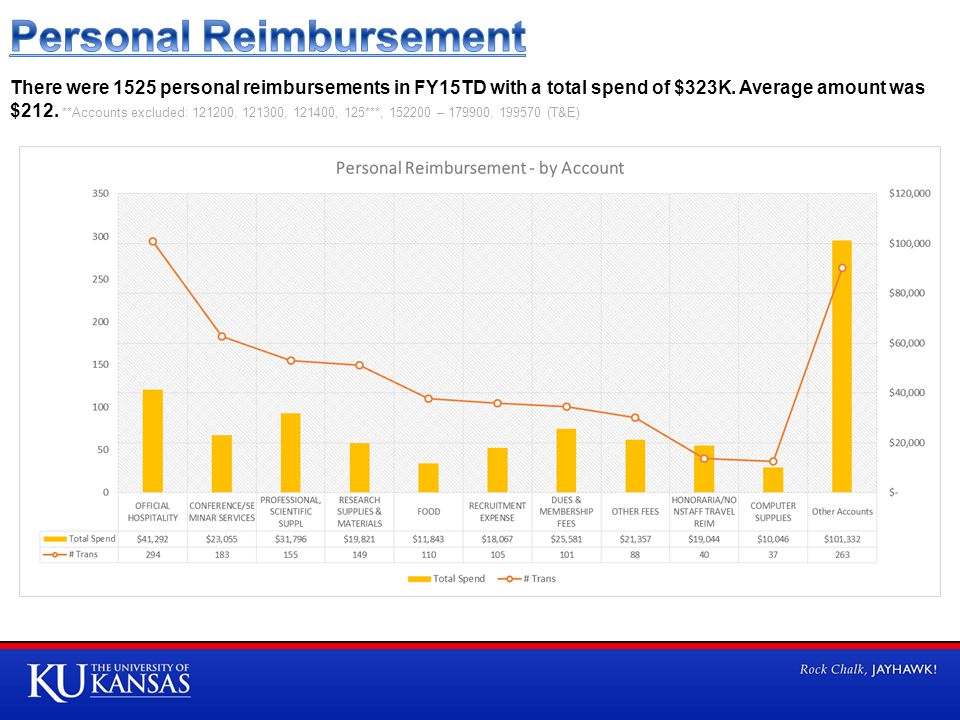
There were 1525 personal reimbursements in FY15TD with a total spend of $323K. Average amount was $212. **Accounts excluded: 121200, 121300, 121400, 125***, 152200 – 179900, 199570 (T&E)
.")
Similar presentations
 for approvals. User – Single person set up in the.>")


>")


 Barbara Moser - Purchasing Joanne Webb - Accounts Payable Welcome.>")

 PROCESS ENHANCEMENTS STATUS REPORT THROUGH APRIL 2007.>")


. If purchasing did not enter a legacy.>")


