Download presentation
Presentation is loading. Please wait.

1
Jonathan Edwards-Opperman

2
Importance of climate-weather interface ◦ Seasonal forecasting Agriculture Water resource management

3
Climate Data – Monthly Indexes ◦ PNA,PDO,ENSO,NAO,AO ◦ Climate Prediction Center (NOAA) Temporal Coverage – 1955 to present Temporal Resolution - Monthly Precipitation Data ◦ NOAA's PRECipitation REConstruction Dataset (PREC) Temporal Coverage – 1948 to present Temporal Resolution - Monthly Spatial Coverage – Global Spatial Resolution – 2.5° latitude x 2.5° longitude
 Temporal Coverage – 1955 to present Temporal Resolution - Monthly Precipitation Data ◦ NOAA s PRECipitation REConstruction Dataset (PREC) Temporal Coverage – 1948 to present Temporal Resolution - Monthly Spatial Coverage – Global Spatial Resolution – 2.5° latitude x 2.5° longitude")
4
Precipitation data split into six regional datasets which cover the Northwest, Southwest, North-central, South-central, Northeast, and Southeast United States Grid points in each region are summed to obtain a single monthly precipitation anomaly for each region

5
LocationPNAPDOSOINino-4Nino-3NAOAO Northwest-0.0409 0.1223-0.0182-1.37e-4-0.01440.02930.0537 Southwest-0.0892 0.00702.54e-4-0.0277-0.0137-0.00670.0131 North-Central0.06310.0862-0.10980.11830.06720.03470.0185 South-Central-0.0604-0.0014-0.00520.03190.0121-0.1185-0.0287 Northeast-0.03940.0019-0.0045-0.0085-0.02370.03110.0594 Southeast0.0383-0.02700.00390.01030.0249-0.0304-0.0586

6
LocationPNAPDOSOINino-4Nino-3NAOAO Northwest-0.07440.0833-0.02690.0023-0.02190.07000.1190 Southwest-0.1642-0.11700.0060-0.0368-0.05460.07120.0815 North-Central0.10860.2759-0.18660.30300.30370.11020.0750 South-Central-0.12390.1013-0.00880.04560.0503-0.0466-0.0794 Northeast-0.06810.1019-0.0214-0.0023-0.02330.06800.1198 Southeast0.06810.05070.02150.00310.0250-0.0678-0.1196 LocationPNAPDOSOINino-4Nino-3NAOAO Northwest-0.22210.0673-0.11160.0818-0.04320.19950.0539 Southwest-0.2425-0.1270-0.0113-0.2467-0.12540.07270.0399 North-Central0.14530.2052-0.09950.22140.04860.0218-0.0122 South-Central-0.00990.0678-0.05190.11740.1329-0.0554-0.0109 Northeast0.01020.0456-0.00630.00950.06360.03864.133e-4 Southeast-0.0528 0.0502-0.02800.07580.06890.12180.1817

7
LocationPNAPDOSOINino-4Nino-3NAOAO Northwest-0.1739-0.0161-0.19260.08210.01650.16170.0873 Southwest-0.1704-0.0586-0.0664-0.0608-0.01310.05790.0576 North-Central0.09990.0719-0.21380.26390.21790.10890.1035 South-Central-0.08570.0669-0.09760.11800.0848-0.1554-0.0124 Northeast-0.0142-0.1722-0.10550.10690.12060.04440.0241 Southeast-0.1068-0.0422-0.05110.1146-0.03130.02590.0630 LocationPNAPDOSOINino-4Nino-3NAOAO Northwest-0.11840.2124-0.18920.17780.15580.0074-0.1861 Southwest-0.10910.01790.0195-0.0946-0.00620.0051-0.1302 North-Central0.05740.1226-0.02930.10250.03190.10610.0313 South-Central-0.03840.00160.0616-0.0365-0.0256-0.0993-0.0062 Northeast0.05020.1832-0.04490.13340.2259-0.0255-0.0359 Southeast-0.0636-0.01460.00420.0139-0.0505-0.04500.0771

8
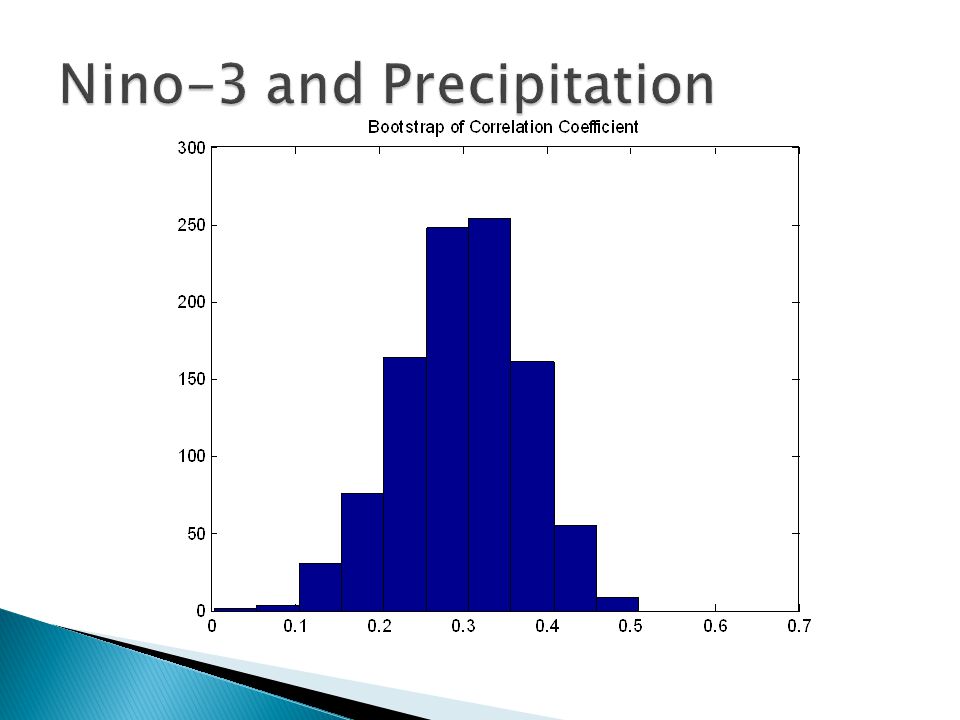
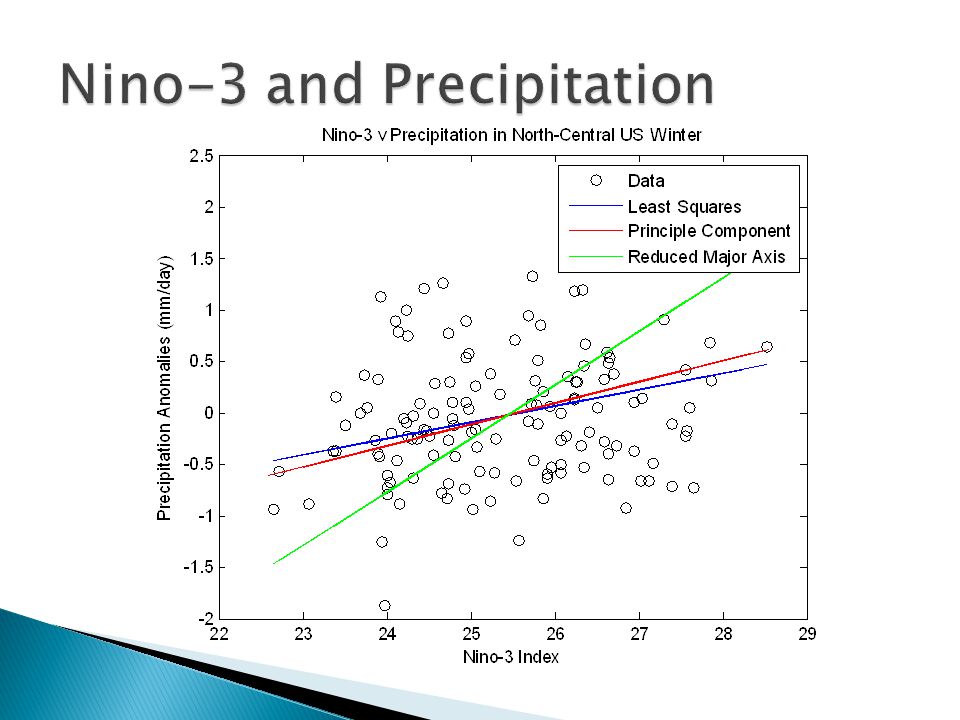
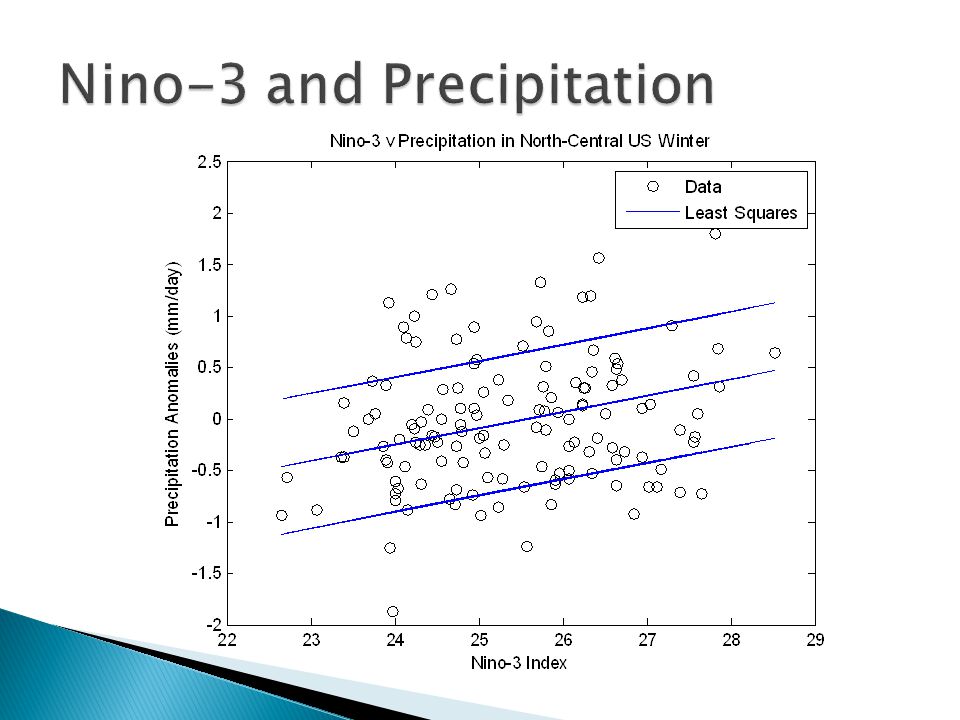
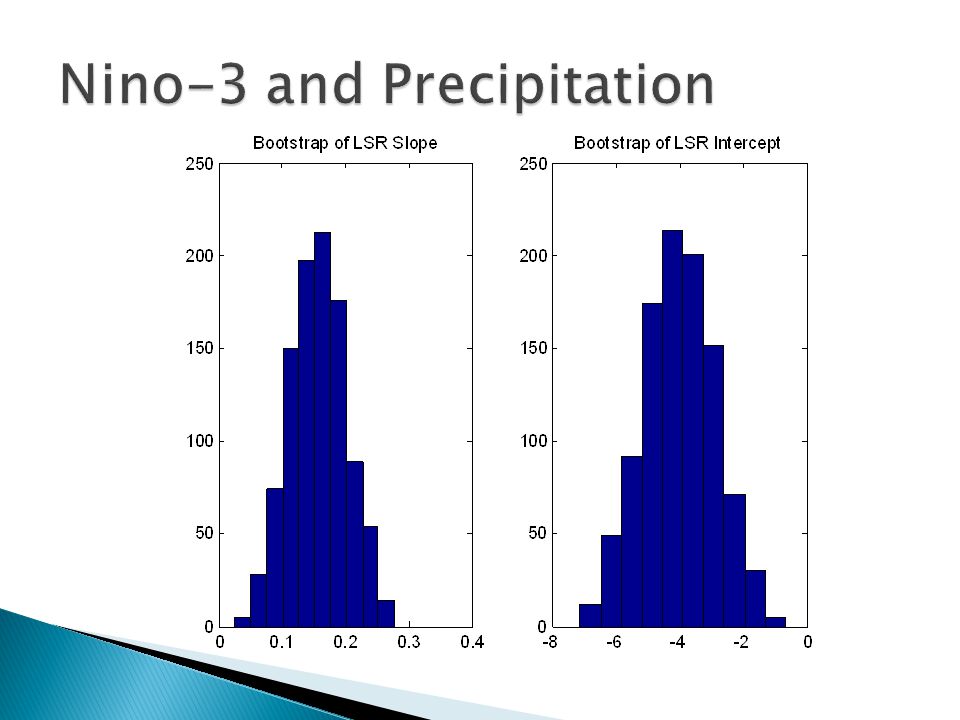
The largest correlations were found during the winter months (DJF) LocationPNAPDOSOINino-4Nino-3NAOAO Northwest-0.07440.0833-0.02690.0023-0.02190.07000.1190 Southwest-0.1642-0.11700.0060-0.0368-0.05460.07120.0815 North-Central0.10860.2759-0.18660.30300.30370.11020.0750 South-Central-0.12390.1013-0.00880.04560.0503-0.0466-0.0794 Northeast-0.06810.1019-0.0214-0.0023-0.02330.06800.1198 Southeast0.06810.05070.02150.00310.0250-0.0678-0.1196 The following analyses will cover the relationship between Nino-3 and precipitation over the North-Central United States
 LocationPNAPDOSOINino-4Nino-3NAOAO Northwest Southwest North-Central South-Central Northeast Southeast The following analyses will cover the relationship between Nino-3 and precipitation over the North-Central United States")
13
Some significant correlations between precipitation and teleconnection patterns Better spatial resolution of the analysis might improve results ◦ Perform correlations and regressions at each gridpoint

Similar presentations


 Winter Weather Forecast Conference OMSI / Oregon Chapter of the AMS 29 October 2011 Winter Weather Forecast Conference OMSI.>")


 on Washington DC Winters Winter Media Workshop 12/9/2011 Jared Klein LWX Climate Program Leader.>")
>")
