Download presentation
Presentation is loading. Please wait.

1
SUMMARY OF BENEFITS AND RETURN ON INVESTMENT GPS FLEET TRACKING

2
Overview As of April 2014, approximately 380 County vehicles have been outfitted with GPS units Of the 3,900 vehicles in the County fleet, only 2,420 would be eligible for GPS program - law enforcement vehicles would be not be included GPS implementation started in FY 2008-09, all AWM and DAS fleet and some vehicles in other departments GPS data from November 2012 through October 2013 was used for this study

3
GPS Program Benefits Quantifiable Benefits (this study will only focus on these benefits as we can validate with GPS data and other reliable resources) Eliminate Smog Certification Requirements Increase Fuel Economy Reduce Idling Reduce Speeding Decrease in Greenhouse Gas Emissions Difficult to Quantify Benefits (this study will not include an analysis of these areas as there is no supporting documentation at this time) Enhance Safety Improve Customer Service Reduce Vehicle Maintenance Costs Increase Employee Productivity through route planning
 Eliminate Smog Certification Requirements Increase Fuel Economy Reduce Idling Reduce Speeding Decrease in Greenhouse Gas Emissions Difficult to Quantify Benefits (this study will not include an analysis of these areas as there is no supporting documentation at this time) Enhance Safety Improve Customer Service Reduce Vehicle Maintenance Costs Increase Employee Productivity through route planning")
4
Benefits from Continuous Monitoring Public Fleets that utilize approved continuous monitoring GPS programs are currently exempt from the traditional California State smog certification program. A total savings of $108,900 could be realized annually: $60,500 for staff time to deliver and pick up the vehicle $48,400 for the smog check

5
Benefits from Fuel Economy – Reduce Idling Based on a review of GPS data... There are over 860,000 operating hours each year for light-duty, non-law enforcement vehicles Of this, approximately 300,000 hours or 35% is spent idling Industry standard is a 20% idling rate which includes time spent at red lights, stop signs and warming up engine At a consumption rate of 0.4 gallons per hour, the County is spending over $464,000 annually on idling. The table on the next slide details the financial and environmental impacts of our current driving behavior.

6
Benefits from Fuel Economy – Reduce Idling Current Scenario # of Operating Hours 860,605 Projection based on GPS data from November 2012 through October 2013 # of Idling Hours 301,586 Projection based on GPS data from November 2012 through October 2013 Gallons of Fuel Consumed While Idling (per hour) 0.4 Per County Green Fleet Action Plan # of Gallons of Fuel Consumed 120,635 # of Idling Hours x Gallons of Fuel Consumed While Idling Factor (301,586 x.4) Average Cost per Gallon of Fuel $ 3.85 Based on data in the FY 12/13 & FY 13/14 Fuel Cost Comparison Reports Amount Spent on Idling $ 464,443 # of Gallons of Fuel Consumed x Average Cost per Gallon of Fuel (120,635 x $3.85) Idling Ratio (% of operating time spent idling) 35% # Idling Hours / # of Operating Hours (301,586/860,605) Greenhouse Gas Emissions (per Metric Ton) 1,072 Per EPA website GHG Equivalencies Calculator
 0.4 Per County Green Fleet Action Plan # of Gallons of Fuel Consumed 120,635 # of Idling Hours x Gallons of Fuel Consumed While Idling Factor (301,586 x.4) Average Cost per Gallon of Fuel $ 3.85 Based on data in the FY 12/13 & FY 13/14 Fuel Cost Comparison Reports Amount Spent on Idling $ 464,443 # of Gallons of Fuel Consumed x Average Cost per Gallon of Fuel (120,635 x $3.85) Idling Ratio (% of operating time spent idling) 35% # Idling Hours / # of Operating Hours (301,586/860,605) Greenhouse Gas Emissions (per Metric Ton) 1,072 Per EPA website GHG Equivalencies Calculator")
7
Benefits from Fuel Economy – Reduce Idling Significant savings could be realized if we reduced the number of idling hours. The table below shows the total reductions calculated for the three different scenarios. The industry standard for idling is 20%. 10% Reduction25% Reduction50% Reduction # of Gallons of Fuel Saved 12,06330,15960,317 Savings/Cost Avoidance $ 46,444 $ 116,111 $ 232,221 Idling Ratio (% of operating time spent idling) 31.5%26.3%17.5% Greenhouse Gas Emissions (per Metric Ton) 107268536
 31.5%26.3%17.5% Greenhouse Gas Emissions (per Metric Ton)")
8
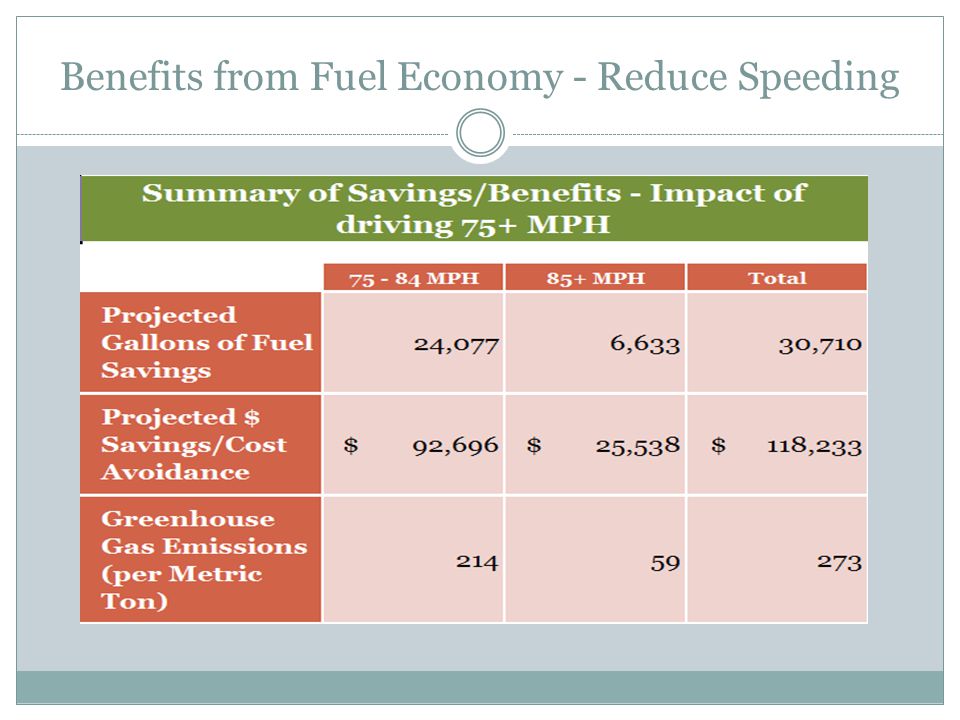
Benefits from Fuel Economy - Reduce Speeding From November 2012 through October of 2013, vehicles equipped with GPS showed a total of 6,571 vehicle miles traveled (VMT) hours at speeds exceeding 75 MPH. It is estimated that the total VMT hours traveling in excess of 75 MPH for the entire non-law enforcement fleet is 42,713. According to recent studies, fuel economy declines by 14% on average for each 10MPH increase in speed. The next few slides detail the financial and environmental impact of our current driving behavior.

9
Benefits from Fuel Economy - Reduce Speeding

12
Summary of Benefits

13
Assumptions The financial savings and environmental benefits are based on the following assumptions: GPS policy and procedures will be finalized and approved (DHR Labor Relations) to provide standards and expectations Department Vehicle Coordinators and supervisors will run reports and monitor notifications/violations from the NetworkFleet Services application on a regular basis and provide feedback to drivers Employees will change their driving behavior and will reduce idling and speeding to comply with policy
 to provide standards and expectations Department Vehicle Coordinators and supervisors will run reports and monitor notifications/violations from the NetworkFleet Services application on a regular basis and provide feedback to drivers Employees will change their driving behavior and will reduce idling and speeding to comply with policy")
14
Cost of GPS Implementation The total cost of implementing GPS is approximately $1.4 million. This includes the one-time purchase of $847,000 for the GPS units and total ongoing annual costs of $580,800 ($20 monthly charge per vehicle for 2,420 vehicles) for Network Fleet Services subscription. The next slide shows the return on investment over a 5 year period.
 for Network Fleet Services subscription. The next slide shows the return on investment over a 5 year period..")
15
Return on Investment – Scenario 1

16
Return on Investment – Scenario 2

Similar presentations