Download presentation
Presentation is loading. Please wait.

1
Knowledge for Equity Conference (K4E) November 13, 2012 Breanna Morrison, MPL CHC Policy Analyst COMMUNITY HEALTH COUNCILS LOS ANGELES, CA
 November 13, 2012 Breanna Morrison, MPL CHC Policy Analyst COMMUNITY HEALTH COUNCILS LOS ANGELES, CA")
2
Introduction to CHC CHC Model for Social Change The Role of Data in Changing the Environment The Role of Data in Changing Access to Healthcare

3
COMMUNITY HEALTH COUNCILS A non-profit, community based health policy and advocacy organization dedicated to improving the health of underserved communities.

4
COMMUNITY HEALTH COUNCILS POLICY AREAS Nutrition & Physical Activity Access and Quality of Healthcare Expansion of Healthcare Coverage Environmental Health

5
CHC MODEL FOR SOCIAL CHANGE

7
QUANTIFYING HEALTH INEQUITY The Reality of Racial Ethnic Health Disparities

8
DEMOGRAPHCS BY AREA OF COMPARISON

9
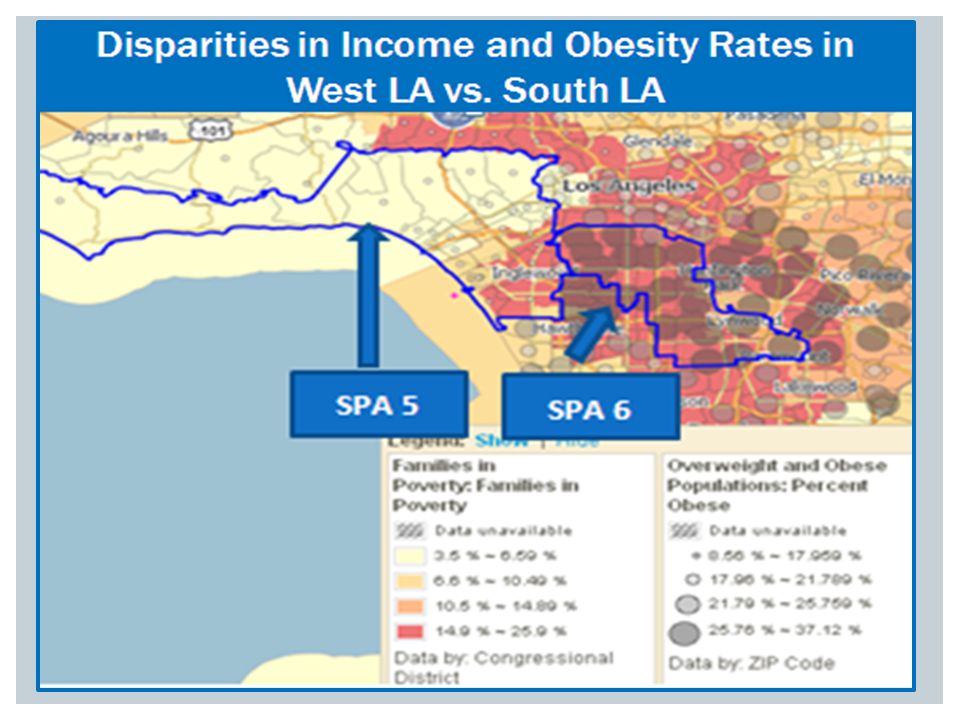
SOUTH LA 1.3 million population 94.5 square miles Pop density: 13,996/sq mile 33.5% of the population is 18 years of age or under West LA651,084 people210 square miles Pop density: 3,087/sq mile 16.8% of population is 18 years of age or under TARGET AND CONTRAST AREAS 9

10
Health OutcomesLA CountyWest LASouth LA Obesity Percent of children grades 5, 7 & 9 who are obese22.916.628.9 Percent of adults who are obese22.21035.4 Diabetes Percent of adults ever diagnosed with diabetes8.74.812.3 Diabetes death rate24.712.837.9 Cardiovascular Disease Percent of adults ever diagnosed with hypertension24.719.329 Coronary heart disease death rate167.6132.6217.6 Stroke death rate4134.451.9 Reproductive Health Rate of births to teens 15-19 years409.474.1 Injury Homicide rate among young adults 15-34 years23.2**64.7 Death rate attributed to motor vehicle crashes9.65.912.7 Cancer Lung cancer death rate34.630.741.8 Breast cancer death rate20.721.726.8 Cervical cancer death rate3.3**4.6 Colorectal cancer death rate15.312.321.4 Communicable Disease Pneumonia/Influenza mortality rate26.123.931.4 Incidence of AIDS among 13+ years old12.810.316.4 HIV infection-related mortality rate4.1**6.8 Incidence of chlamydia421.6208.7922.2 Incidence of gonorrhea96.163.4270.2 Incidence of tuberculosis8.43.710.6 All cause mortality660.6547.1831.3 ** if <20 deaths, a rate cannot be calculated Source: Los Angeles County Department of Public Health, Office of Health Assessment and Epidemiology. Key Indicators of Health by Service Planning Area; June 2009.

11
Area Life Expectancy at Birth (Years) Ranking (n= 103) Quartile Los Angeles County80.3 Council District 5 83.6131 Council District 11 83.2191 Council District 4 82.6251 Council District 3 81.8312 Council District 13 81.8322 Council District 12 81.2382 Council District 1 80.9442 Council District 14 80.7563 Council District 6 80.3633 Council District 7 79.9703 Council District 2 79.7713 Council District 10 79.1814 Council District 15 77.9914 Council District 9 77.0964 Council District 875.21024 LIFE EXPECTANCY BY COUNCIL DISTRICT
 Ranking (n= 103) Quartile Los Angeles County80.3 Council District Council District Council District Council District Council District Council District Council District Council District Council District Council District Council District Council District Council District Council District Council District LIFE EXPECTANCY BY COUNCIL DISTRICT")
13
WHAT ARE THE DRIVERS Housing segregation Lack of regulatory oversight and planning Discriminatory corporate and financial practices Public and private divestment Public policy Tax and fiscal policy 13

14
MOVING TOWARDS EQUITY THE ROLE OF DATA IN CHANGING THE ENVIRONMENT

15
INEQUITIES IN THE BUILT ENVIRONMENT CategorySouth LAWest LADisparity Physical Environment Resources-43%42%85 Nutrition-106%101%207 Physical Activity Options-55%24%79 Public Safety-17%7%24 Housing-40%16%56 Schools-43%63%106 Air and Land Quality5%39%34

16
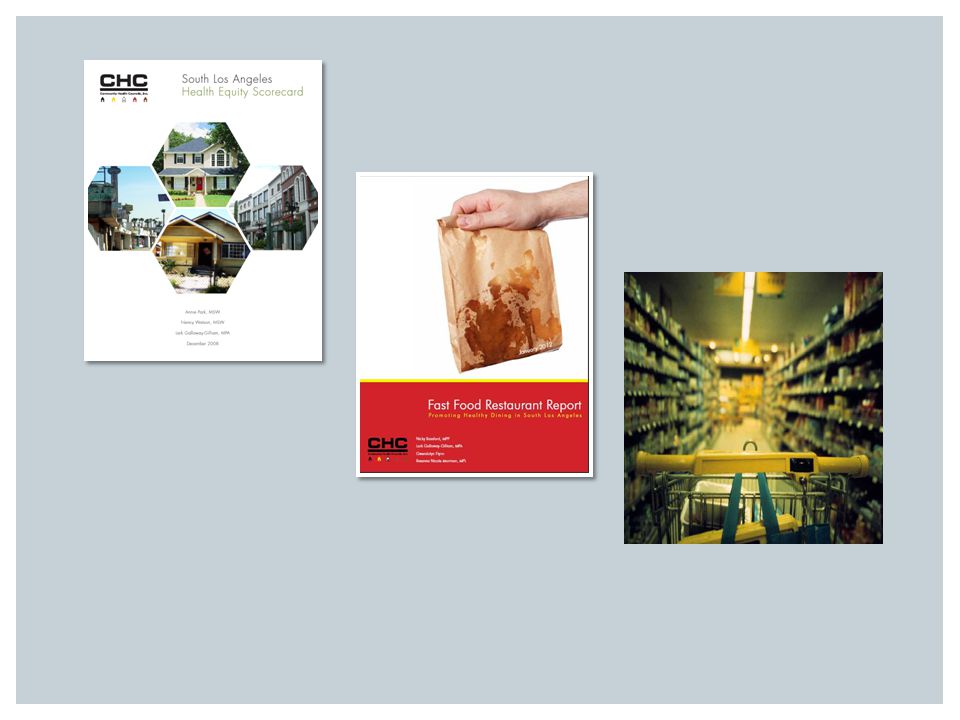
FOOD RETAIL RESOURCES South LA West LA 16

17
MEASURESOUTH LAWEST LALA COUNTY Percent Fast Food 71.8%40.7%47.7% Fast Food Restaurants per Square Mile 4.974.13

18
Built Environment Poor Access to Physical Activity Low Access to Healthy Food OBESITY DIABETES HIGH CHOLESTEROL HEART DISEASE CANCER OBESITY DIABETES HIGH CHOLESTEROL HEART DISEASE CANCER CONNECTING THE BUILT ENVIRONMENT TO HEALTH Exposure to Hazardous Substance

19
2010 General Plan Amendment prohibits a new fast food restaurant within a 1/2 mile radius, or 2, 640 linear feet, from any existing Fast Food Restaurant. Ordinances Proposed in 2012 Community Plan Update No more than one (1) establishment permitted within a ¼ mile radius of another free standing establishment” (CPIO sub-districts) “Prohibits…all new free standing fast food establishments seeking to locate directly adjacent, across a street, alley or intersection from a public elementary, middle or high school, including charter and magnet schools” (CPIO sub-districts) Drive through fast food establishments shall be limited to a maximum of 1 within a 750 foot radius of an existing free standing fast food use” (Crenshaw Specific Plan Amendment) REGULATION OF FAST FOOD RESTUARANTS IN SOUTH LA
 establishment permitted within a ¼ mile radius of another free standing establishment (CPIO sub-districts) Prohibits…all new free standing fast food establishments seeking to locate directly adjacent, across a street, alley or intersection from a public elementary, middle or high school, including charter and magnet schools (CPIO sub-districts) Drive through fast food establishments shall be limited to a maximum of 1 within a 750 foot radius of an existing free standing fast food use (Crenshaw Specific Plan Amendment) REGULATION OF FAST FOOD RESTUARANTS IN SOUTH LA.")
20
IMPACT: PROGRESS TOWARDS HEALTH EQUITY More Stores 6 New South LA Grocery Stores since 2007 Slowed Fast Food Growth Only 1 stand alone fast food restaurant since 2008 Increasing Healthy Food Access

21
IMPACT: PROGRESS TOWARDS EQUITY YearEH Building Permits 20105.96% 20114.49% Jan-June 2012 2.44%

22
Moving Towards Equity THE ROLE OF DATA IN CHANGING HEALTHCARE RESOURCES

23
INEQUITIES IN THE HEALTHCARE RESOURCE ENVIRONMENT CategorySouth LAWest LADisparity Healthcare Environment Resources-43%72%115 Healthcare Facilities-28%59%87 Healthcare Workforce-76%182%258 Healthcare Financing-65%22%87 Healthcare Coverage-30%38%68 Primary & Preventive Care Access-34%27%61 Primary & Preventive Care Utilization-24%103%127

24
24

25
1995 LA County closes 33 county primary care clinics Establishes contracts with Community Clinics to provide care for uninsured Allocation of Contracts: $27.12 per uninsured patient in South Los Angeles $34.05 per uninsured patient in West Los Angeles INEQUITY IN PUBLIC POLICY

26
Figure 1: Infant Mortality Rates over time in SPA 6 vs All SPAs Except 6 and SPA 5 MODEL IN ACTION: COMMUNITY ASSESSMENTS DISPARITIES IN INFANT MORTALITY Data Source: Los Angeles County Department of Public Health: Title V Perinatal Indicators (2009); Modified to emphasize South Los Angeles Figure 2: Rate of Low Birth Weight (>2500) Neonates Over Time in SPA 6 vs. All SPAs Except 6 and SPA 5 The Problem

27
LESSONS LEARNED OUTCOMES & SUCCESS

28
WHAT CAN COMMUNITY ACHIEVE 1 Passage of nation’s strongest regulation of density of fast food restaurants 2 Passage of nation’s strongest regulation of oil drilling in urban setting 3 Opening of 6 new grocery stores

29
Lark Galloway-Gilliam, Executive Director Breanna Morrison, Policy Analyst 3731 Stocker Street, Suite 201 Los Angeles, CA 90008 323.295.9372 www.chc-inc.org THANK YOU Community Health Councils

Similar presentations


 –Hubert H. Humphrey Comprehensive Health Center (South Los Angeles)>")


